It is suggested that the new coronavirus may be spreading exponentially
A new type of coronavirus infection (COVID-19) found in Wuhan, Hubei Province in China has been
Exponential growth and epidemics-YouTube
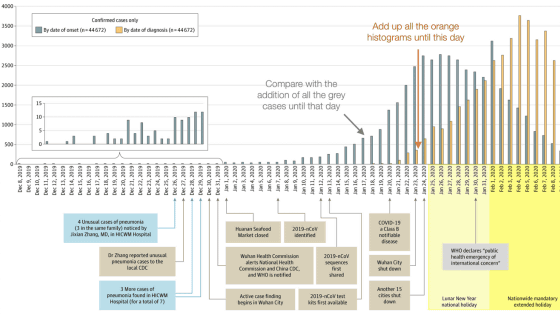
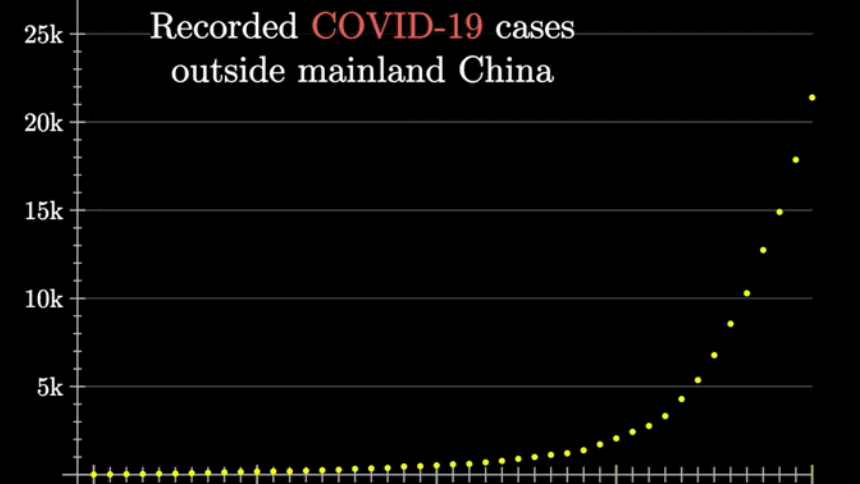
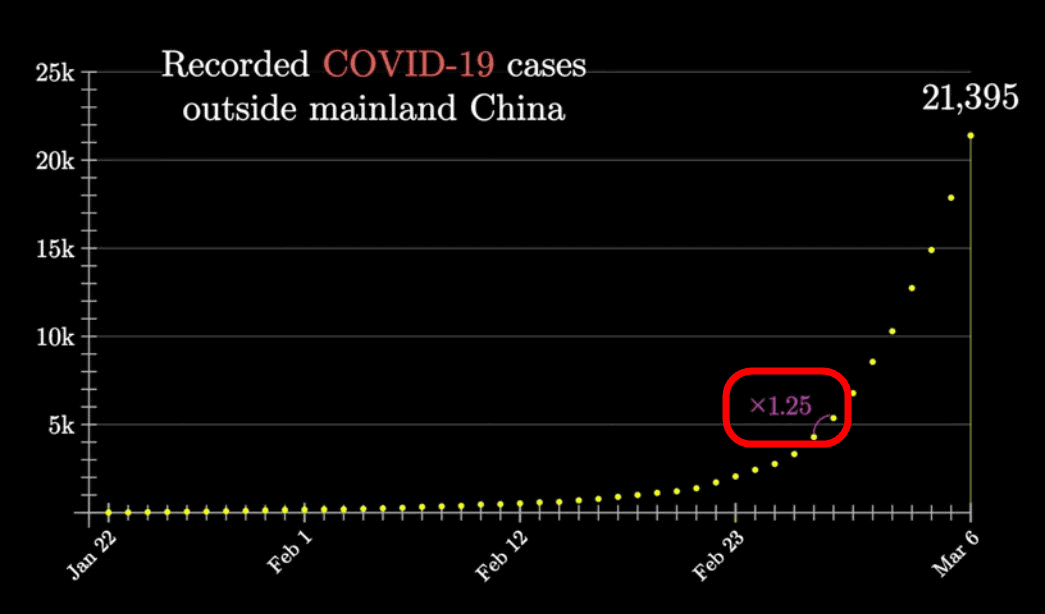
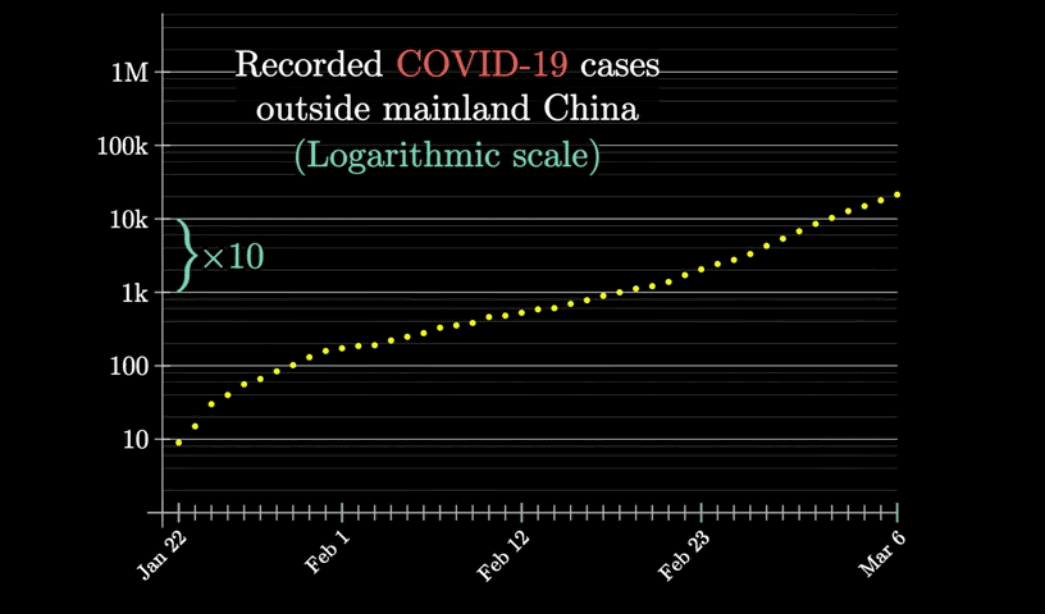
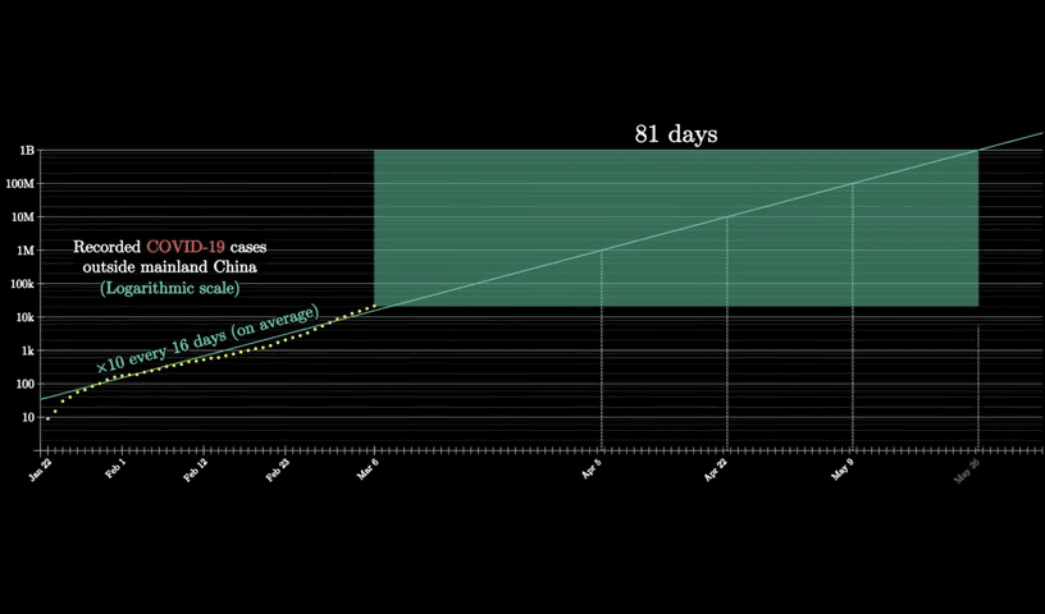
The following graph shows the change in the total number of infected people from January 22, 2020 (Wed) to March 6, 2020 (Fri), excluding mainland China. The vertical axis shows the number of infected people, and the horizontal axis shows the number of days.

Every day, the number of infected people continues to increase, from about 1.15 times the previous day to about 1.25 times, and 'exponentially increases,' Sanderson points out.
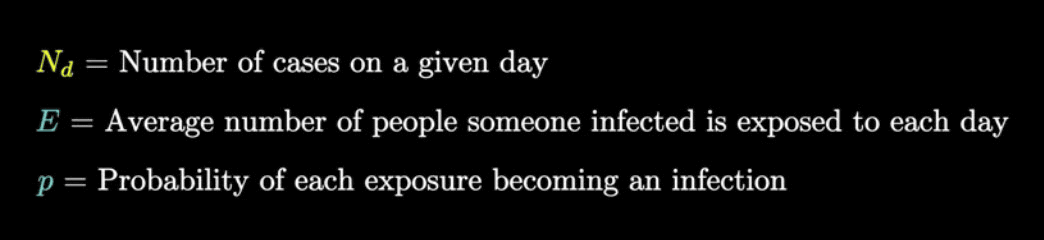
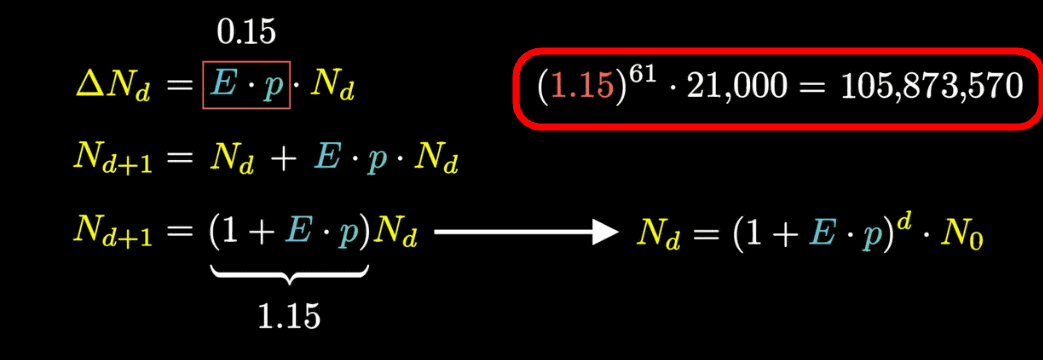
'N' is the number of infected people per day, and 'E' is the average number of people who are infected daily. If 'p' is the probability of contact by infected person, it will lead to infection ...
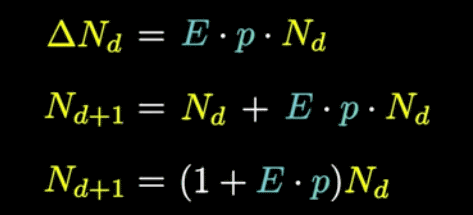
The number of new infections per day is given by the following formula. 'D' is a variable that represents the number of days.

When the above equation is expressed as follows, N d is the number of infected persons on a certain day, N d + 1 is the number of infected persons one day later, and (1 + E * p) can be expressed as the increase rate of the number of infected persons. I can do it. Since N is the number of infected people per day, it can be said that the more people infected, the faster the infection spreads.
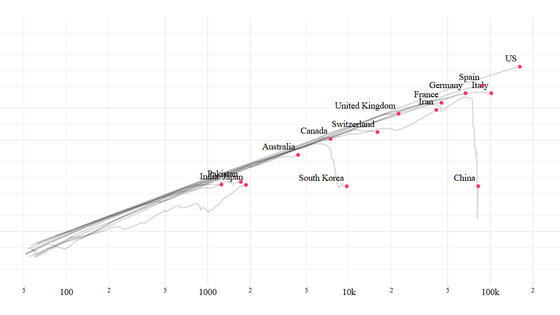
You can see how quickly the number of infected people is increasing by looking at the chart below. In the graph below, the scale on the vertical axis indicating the number of infected people is represented by a power of 10, such as 10, 100, 1000, ..., and the graph is shaped like a straight line.
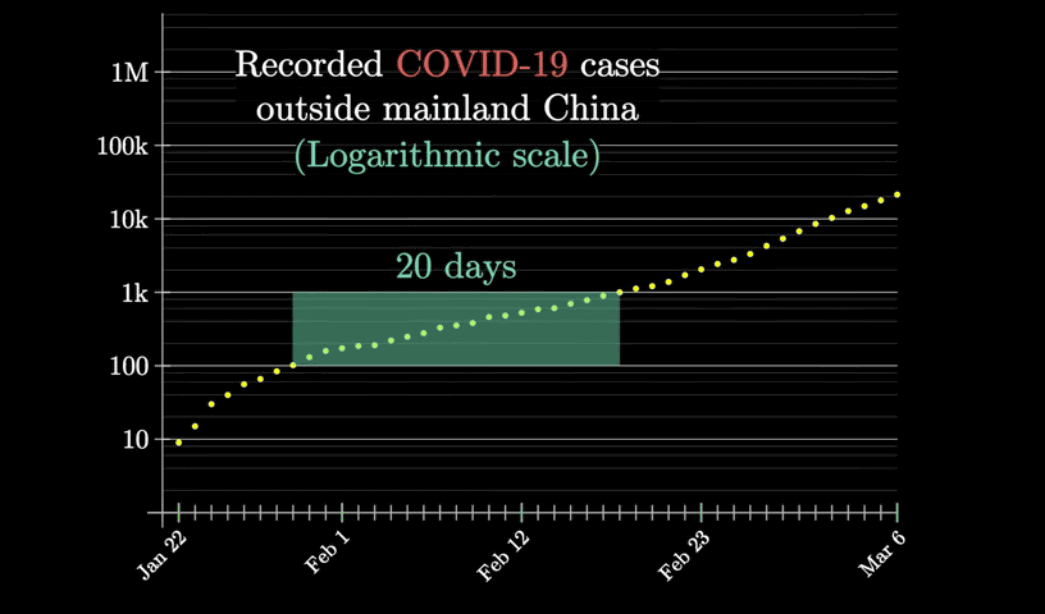
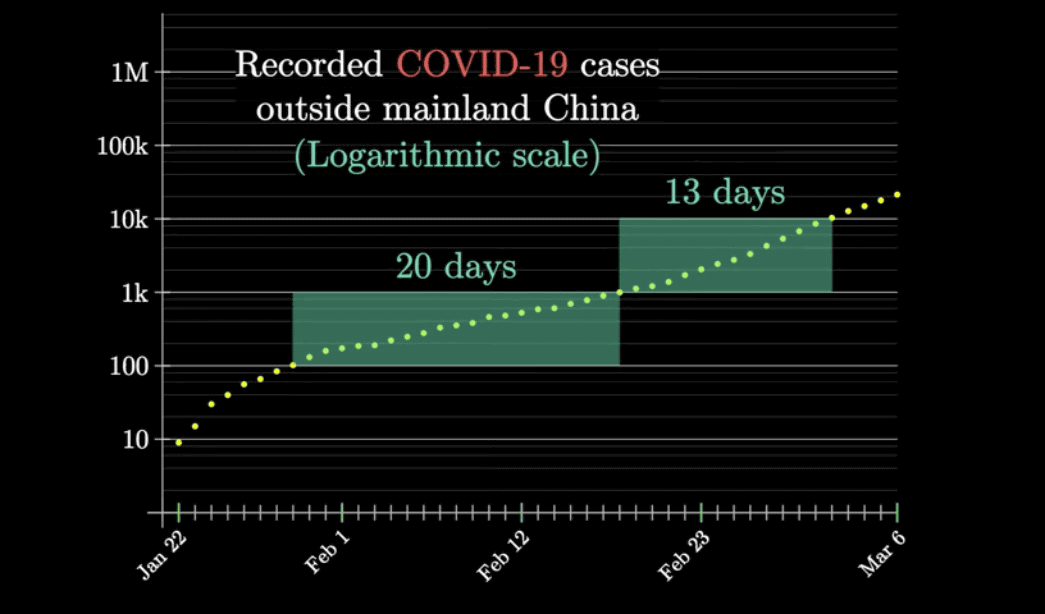
Looking at this graph, the number of infected people increased from 100 to 1,000 in about 20 days ……
It can be clearly seen that the number of infected people has increased from 1,000 to 10,000 in about 13 days.
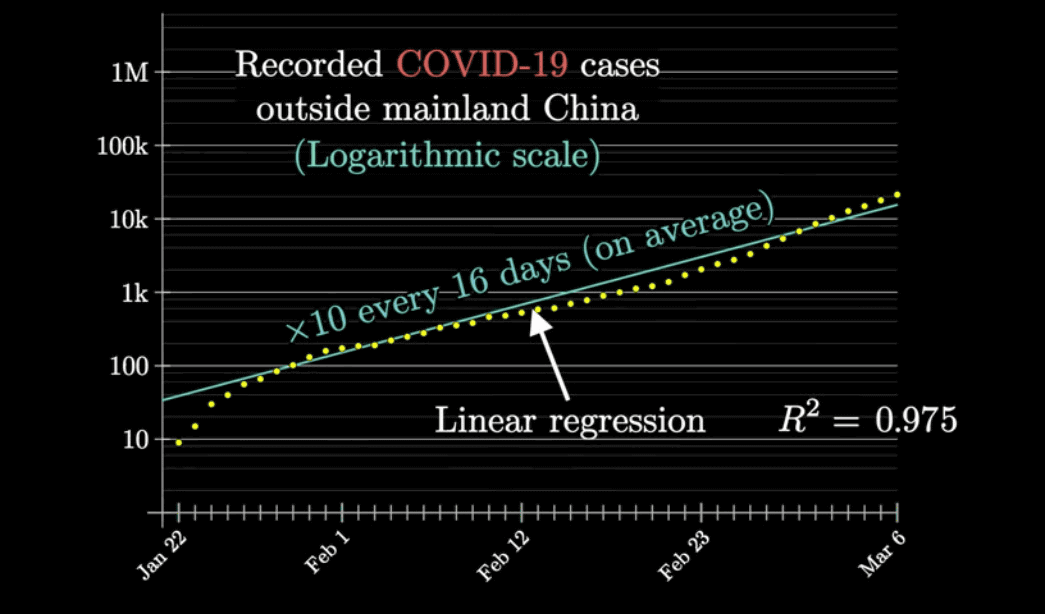
And from the slope of the graph, a prediction is drawn that, on average, the number of infected people will increase by a factor of about every 16 days.
If the number of infected people would increase by a factor of about 10 every 16 days, 1 million would be 30 days later on April 5, 2020, and 10 million 47 days later on April 22, 2020. A day later, on May 9, 2020, it will reach 100 million, and 81 days later, on May 26, 2020, it will reach 1 billion.
'Of course, this is not necessarily the case,' says Grant Sanderson, 3Blue1Brown's operator.
In addition, since the number of infected people does not always exceed the total population of the earth, “pop. Size” is the total population, and the probability of infection by contact with infected people “p” is “1-percentage of total infected people”. When expressed ...
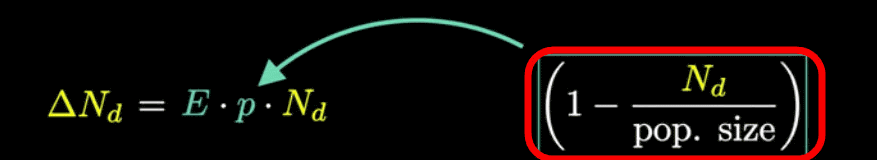
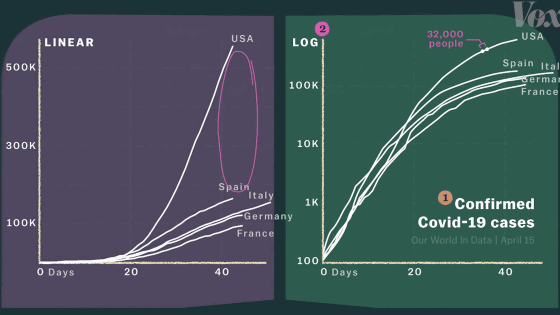
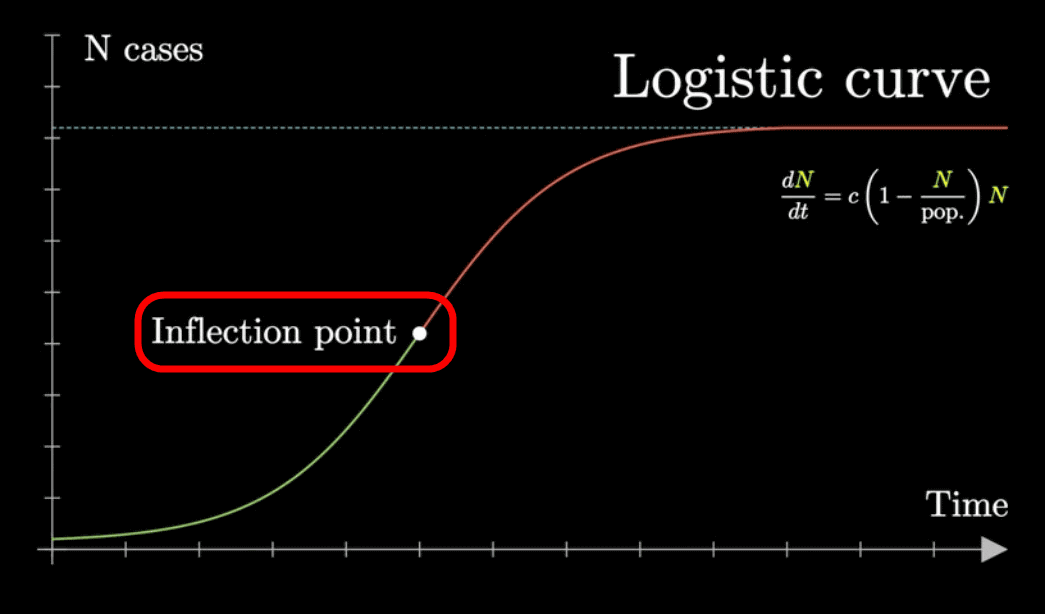
The formula for the transition of the total number of infected people 'N' can be expressed by a
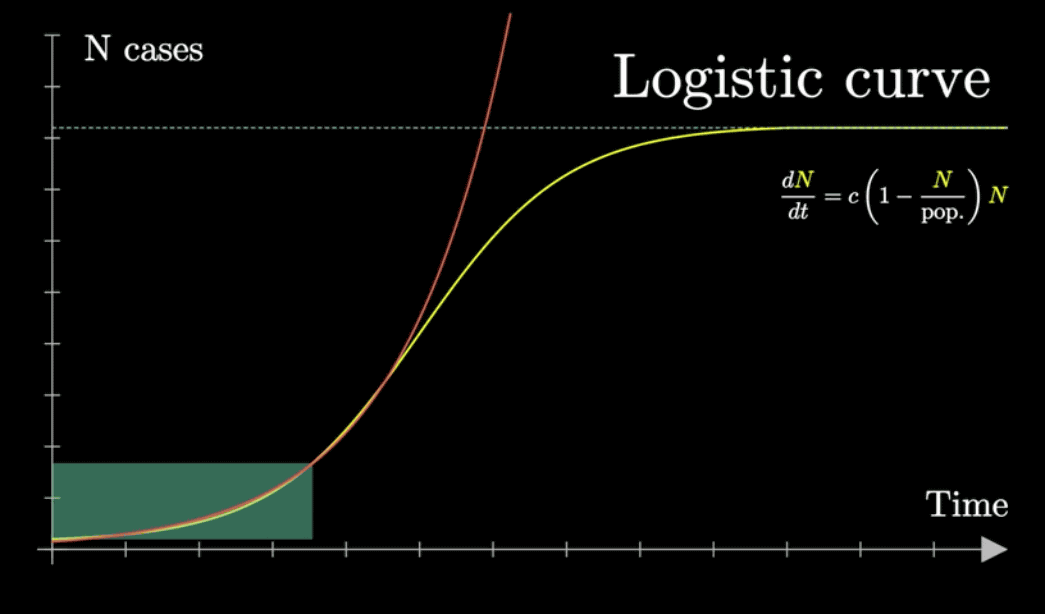
The logistic curve also follows an exponential increase halfway, but begins to decrease at the 'Inflection point'. If the number of infected people increases, the rate of change in the rate of increase decreases, and the point at which the rate of change begins to decrease is considered the inflection point.
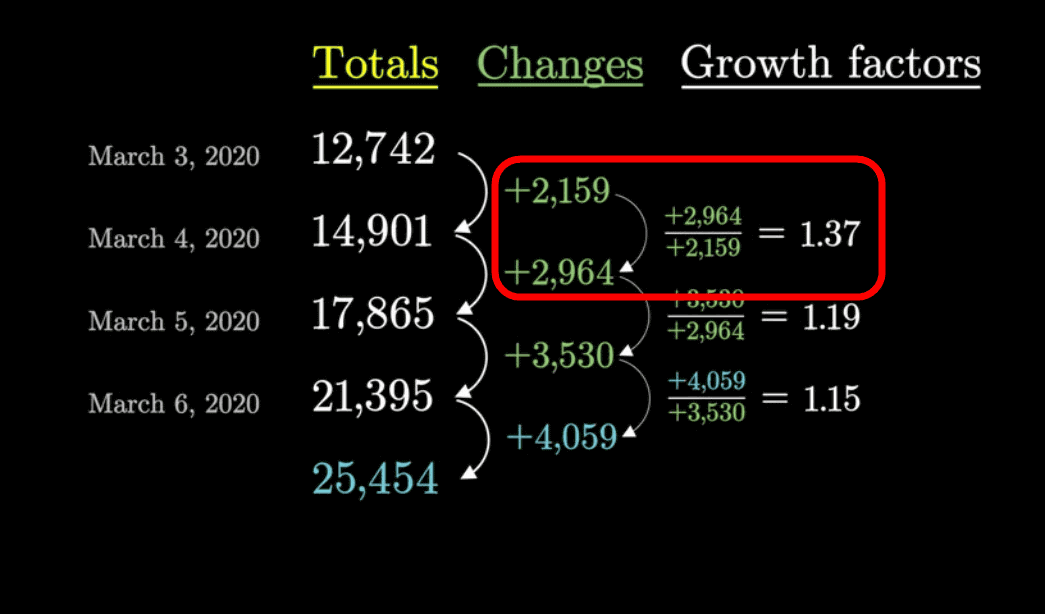
While the number of infected people is increasing, the growth factor of the number of infected people on one day divided by the number of infected people on the previous day is more than 1. For example, the growth factor for March 4 is about 1.37, which is the number of 2964 infected people on March 4 divided by 2159 infected people on March 3. When the growth factor is greater than 1, the logistic curve increases exponentially, and when it falls below 1, it converges.
For example, if the current number of infected people is about 21,000 and the growth factor remains 1.15, the number of infected people after 61 days will exceed 100 million.
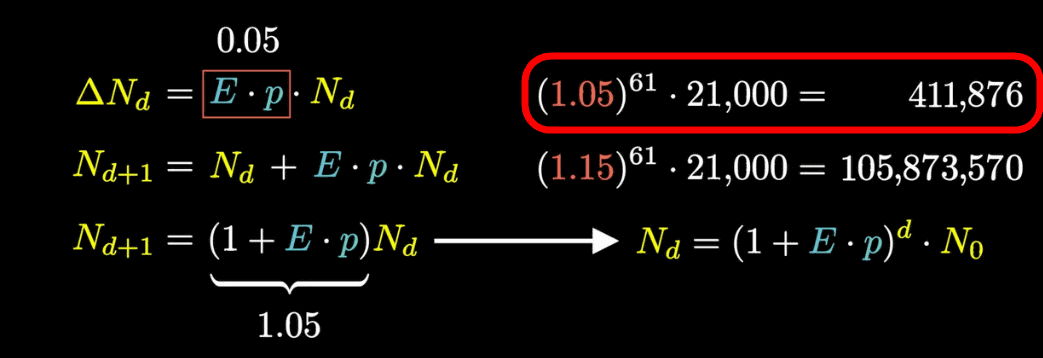
Even if the growth factor drops to 1.05, the number of infected people after 61 days will be 400,000.
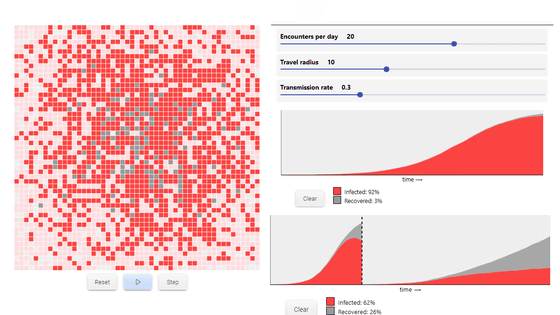
Mr. Sanderson said, 'The answer to the question' How can I lower the growth factors? 'Is to answer questions such as avoiding each individual to go out on a trip, avoiding people gathering, washing their hands well, etc. It's about prevention. '

There are a few things we didn't consider in the movie about the spread of the infection itself. The graph shown in the movie is `` realistic '' because it does not reflect in detail the time that infected people remain infected, that recovered or dead people can not spread the virus etc. Sanderson emphasizes that it is not a graph, but a graph that illustrates exponential and logistic equations as a timely case study.
Related Posts: