Which faculties are popular at university?

by Giammarco Boscaro
A graph summarizing such as "how much degree of each degree has been increased in higher education in the United States ?" From 2011 to 2017 is released. From this graph, you can see what kind of undergraduate boasts high popularity in the United States.
The History BA since the Great Recession | Perspectives on History | AHA
https://www.historians.org/publications-and-directories/perspectives-on-history/december-2018/the-history-ba-since-the-great-recession-the-2018-aha-majors-report
According to the survey conducted by the National Education Statistics Center in the United States in 2008, the number of students majoring in historical studies at that time was 34,442 students, but students majoring in history in 2017 with the latest version of the same survey It was found that the number decreased to 24,266 people. From 2016 to 2017, the number of students majoring in history studies has decreased by over 1,500. Thus, even if the number of people entering university increases, some faculties are decreasing their popularity greatly.
The graph below shows how much the number of degrees awarded by each undergraduate increased or decreased from 2011 to 2017. Located at the top of the graph is a "popular high school" where the number of degrees awarded has increased, and to the other side "lower popular faculties" where the number of degrees awarded has decreased.
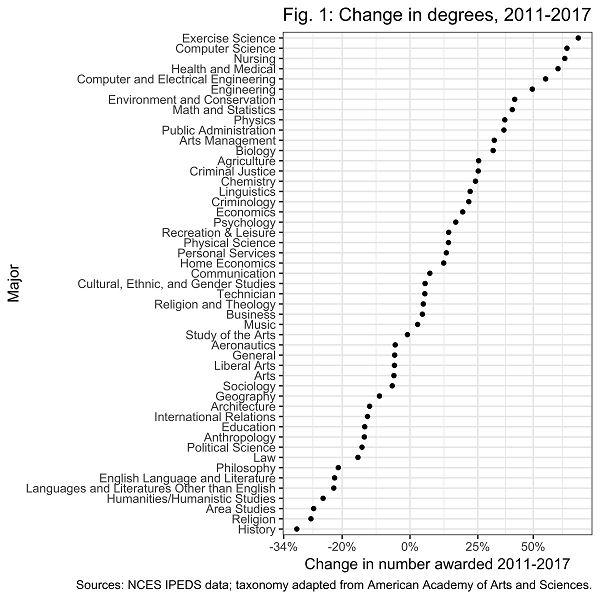
According to this data, the increase in the number of degrees awarded by more than 50% between 2011 and 2017 is attributed to "Exercise Science", "Computer Science", "Nursing" (Nursing) "," Health and Medical "," Computer and Electrical Engineering "," Engineering ".
On the other hand, the reason why the number of degrees awarded decreased by more than 20% between 2011 and 2017 is that in order of decreasing rate, "History", "Religion", "Area Studies" Humanities / Humanistic Studies (Humanities / Humanities research) "" Languages and Literatures Other than English "" English Languages and Literatures "" Philosophy (philosophy) "7 One.
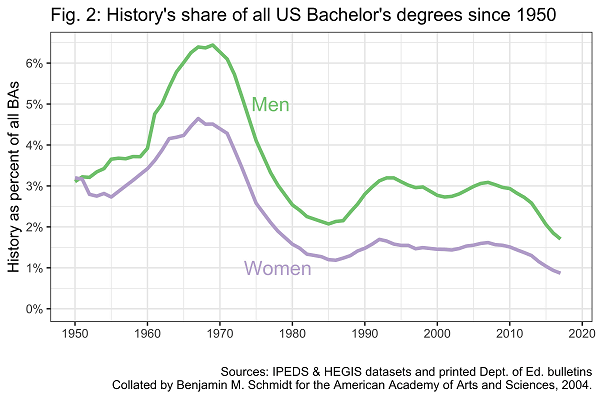
It was in 1966 that I started to record the number of degrees awarded by undergraduate in the US. However, if we use the data in the Humanities Indicators project of the American Academy of Arts and Sciences , we can trace the number of studies in the humanities sciences around the 1950s. These data are summarized in the graph below, which shows that the number of students majoring in history studies had declined by 66% from 1969 to 1985.
The graph below shows the proportion of those who acquired a bachelor's degree in the history department among university graduates in the US by gender. As of 1971, 11.8 people per 1000 people got a bachelor's degree in the Department of History, but in 1993 the number has decreased to 7.6 per 1000 people and to 5.3 per 1,000 in 2017.
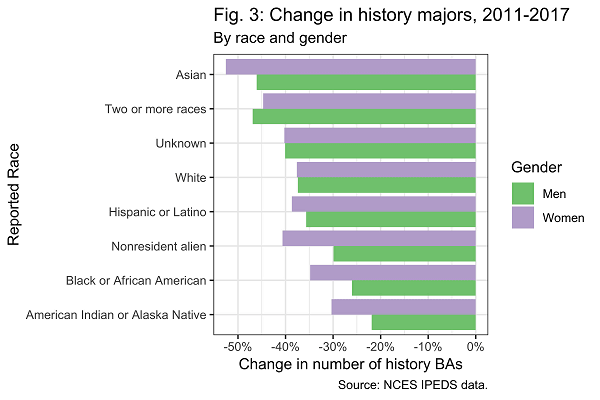
In addition, we classified people who acquired bachelor's degree in history department as person type, and showed how much number of degrees have decreased from 2011 to 2017 in the graph below. The green color of the graph shows male and purple shows the reduction rate of female. The biggest reduction rate is Asian students, followed by turns of mixed race, classification unknown, Caucasian, Hispanic / Latino, Non-resident alien, Black African American, American Indian Alaska Native.
The chart below shows the trends in the proportion of classes in the history department by type of university. "Private Bachelor's Colleges": "Private Research Universities: Private Research Universities" "Public Research Universities: Public Research Universities" "Public Bachelor's Colleges: Public Universities (Bachelor)" "Public Master's Colleges / Universities: "Master's degree" and "Private Master's Colleges / Universities: private university (master's degree)", even if the university is classified into six categories, the proportion of history class is decreasing in all.

Related Posts:


in Note, Posted by logu_ii