What do you see when you compare the graphs in which the directions of the roads of the world cities are visualized?

A method of comparing urban complexity by Jeff Boeing, a doctoral researcher at the University of California, Berkeley, by extracting the road network from the map programmatically and showing how frequently the direction of the roads will emerge Has been announced.
Comparing City Street Orientations - Geoff Boeing
http://geoffboeing.com/2018/07/comparing-city-street-orientations/
Mr. Boeing said that urban planner Kevin Lynch claimed that five elements "city", "region", "node", "landmark" "constitute a city" 60 years ago, We extracted the road which is one of them from OpenStreetMap of each city and compared it.
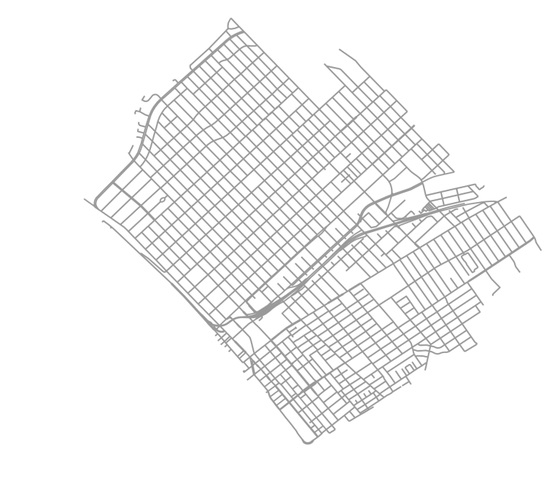
For example, the following figure extracts only the way of Santa Monica in California from the map. It is the impression that the road on the straight line crosses almost vertically, and the arrangement of partitions is tight.
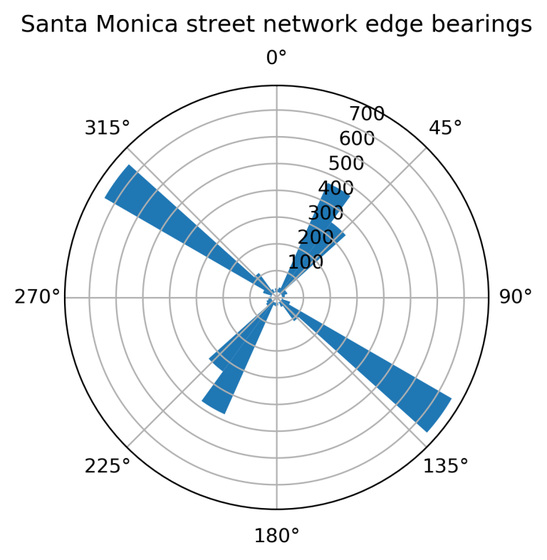
And the graph below shows the direction and frequency of the road on polar coordinates . The direction of the road is represented by a blue line with the north as 0 degree. The distance from the center represents the relative frequency, the longer the total distance of the road in that direction, the longer the blue part is displayed. Because the road of Santa Monica is almost orthogonal, we can see that it is classified into almost two kinds of "northeast to southwest road" and "southeast to north west road". "Southeast to northwest road" has a longer overall distance than "northeast to southwest road".
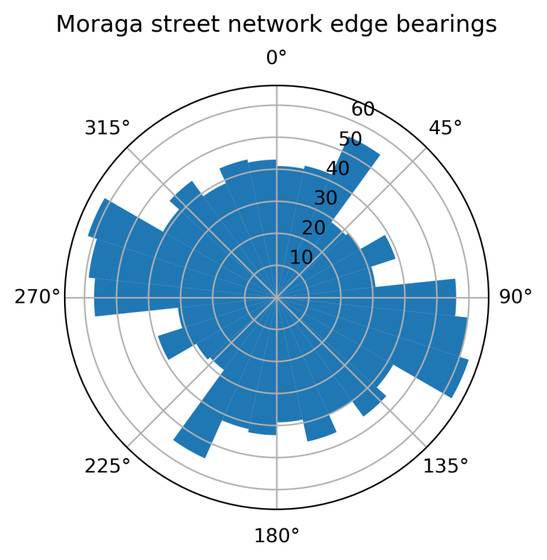
On the other hand, those of Moraga in the same state of California. Because the road is opened depending on the shape of the topography and the farmland rather than the landscape arrangement, the curve network is more numerous than the one of Santa Monica, which makes it a complex road network.
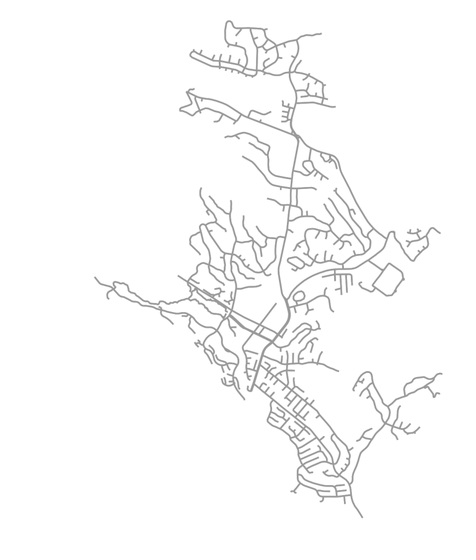
It looks like this when you actually graph it. It is clearly different from Santa Monica, which is divided into almost two directions, and it is scattered in various directions.
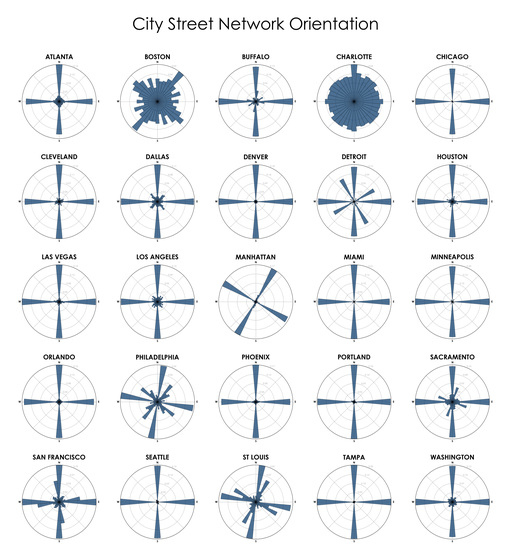
The following image is made for this polar coordinate graph for cities in the USA. In most of the surveyed cities, the direction of the road is concentrated in two directions, and there is an impression that it is organized exactly. On the other hand, North Carolina State · Charlotte, where the direction of the road is scattered considerably, is not relative to the north and south relative frequency, and the graph is not point symmetric. This means that there are many roads that are northward one way, which is one of the cities where the road enters the most.
In addition, graphs of each city in the world are the following images. Unlike the United States, you can see that not only cities where roads are organized in a lattice pattern on a global scale. Also, if you look closely, the graphs of Hong Kong and Glasgow lose point symmetry.
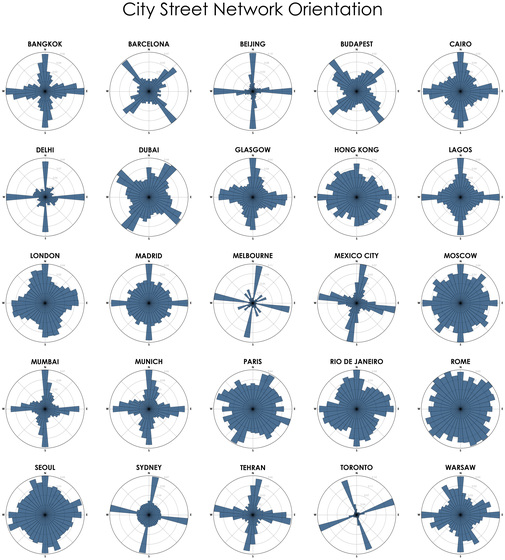
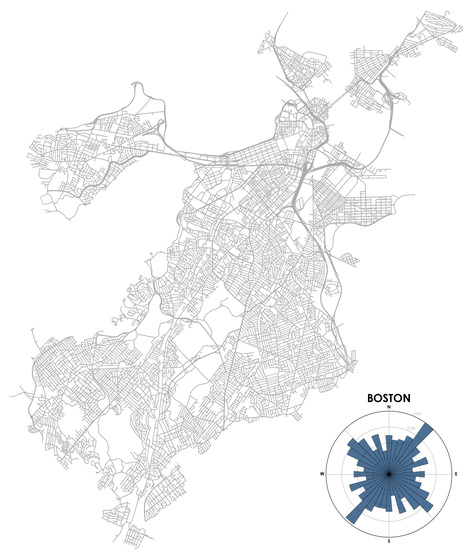
Mr. Boeing argues that the complexity of the city is highlighted only by looking at this polar coordinate graph. For example, Boston knows that the roads are not organized compared to Santa Monica, and you can see at a glance that if you are a person without Boston land intuition. In order to make it a city that is easy to imagine even for those who do not know Boston, we need to think about the other elements "Lynch" "Region" "Nodal Point" "Landmark" that Lynch says.
The Python package "OSMnx" used by Boeing to extract urban boundary lines and road networks from OpenStreetMap is published on GitHub .
Related Posts:
in Note, Posted by log1i_yk

