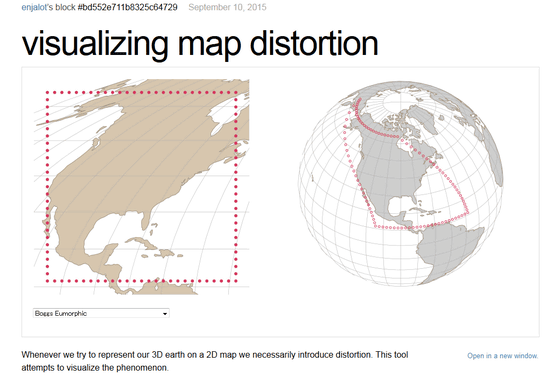
"Visualizing map distortion" that you can experience how distorted by map projection method in 2D and 3D
Various such as Mercator 's projectionProjection methodYou can see how much deformed it is compared with the actual terrain while comparing 2D maps using 3D globe with "Visualizing map distortion"is.
Visualizing map distortion
http://bl.ocks.org/enjalot/bd552e711b8325c64729
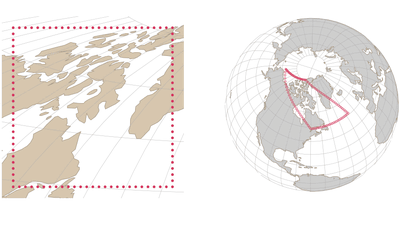
When you open the "visualizing map distortion" page, you will see a brown 2D map and a gray 3D globe. The area surrounded by the red dotted line on the 2D map is also displayed with a red dotted line on the 3D globe.
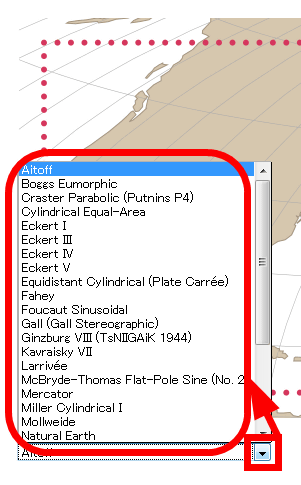
To change the 2D map projection method, choose the desired projection method from the menu at the bottom of the map.
Try it, it is also used for Google MapsMercator projectionI tried to display the east coast of the United States. The Mercator projection draws parallel latitude and the longitude is a map drawn parallel so as to be perpendicular to latitude. Although the actual meridian becomes shorter as it departs from the equator, since the lengths of the meridians are unified in Mercator 's projection, the area becomes higher than the actual area as it becomes higher latitude area. Therefore, in the 3D globe, I draw a short trapezoid of the upper side.
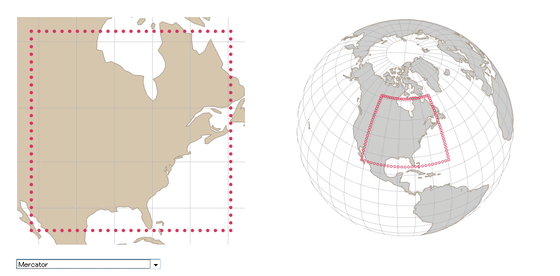
It is also possible to enlarge or reduce the map by operating the mouse wheel on the 2D map. If it is expanded to its maximum, distortion is small and can be accurately displayed.
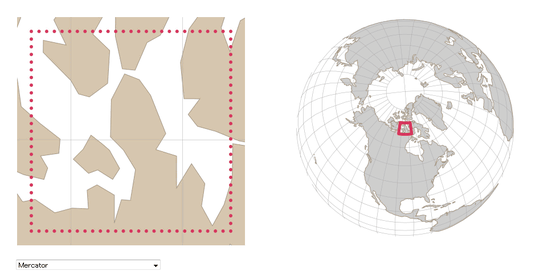
The distortion increases as it approaches the North Pole and South Pole.

Looking at Antarctica, it looks something like this, and in the 3D globe the short trapezoid of the upper side is displayed. The range that can be displayed is limited to the Americas, the west side of the continent of Europe, the continent of Africa, Antarctica, etc. It was impossible to display Japan and Australia.

I will also try other projection methods.Etoff projection(Aitoff) is a map of the equidistant azimuthal map with the equator as the major axis, and has an elliptical shape in which the length of the equator and the meridian are drawn in a 2: 1 length.

Eumorphic projection(Boggs eumorphic) is obtained by the arithmetic mean of the interval between the latitude and longitude lines of the Morweide projection and the Sanson projection, and it is drawn by an inverse pseudocylindrical projection which is an intermediate shape between the two projections.

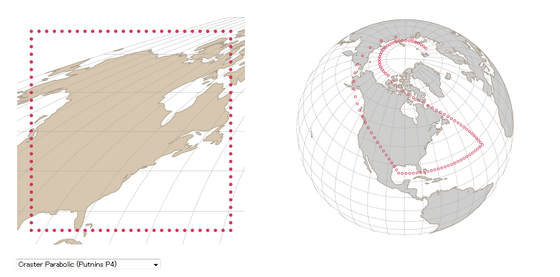
Cluster parabolic projection (Craster parabolic) is a pseudocylindrical projection also known as Putninsh P4 (Putnins P4).
Cartesian cylindrical projection(Cylindrical equal area) is a map of the cylindrical map which correctly represents the area ratio.

Six different types of geographers invented by Max EckertEckert projection(Eckert), the first echelt 1st projection is a map drawn in a hexagon with a triangle added to the left and right of the square.

Echelt The third projection adds a semicircle to the left and right of a square, an oval shape.

The fourth echelt mapmaking regulates the latitude lines of the Ecquert 3nd projection so that the area ratio is correct.

Echelt Fifth projection is a shape obtained by adding a sine curve to the left and right sides of a square.

Positive pyramid projection(Equidistant Cylindrical) is a map where parallels and meridians intersect at right angles and at equal intervals.

Fahy projection(Fahey) is a map depicting a vertically long oval shape.

Foucault sinusoidal projection(Foucaut Sinusoidal) is a map which raised the accuracy of the area by arranging "sinusoidal curve method" which expresses the meridian with a sinusoidal curve.

Gal projection(Gall Stereographic) is a flat cylindrical projection that expresses two lines of 45 degrees latitude and 45 degrees latitude as standard latitude lines.

Ginzburg 8th projection(Ginzburg VIII) is another pseudo-cylindrical projection method also known as TsNIIGAiK.

Kavraisky's 7th projection (Kavraisky VII) is also one of the maps drawn by the pseudo-cylindrical map.

Lalivee projection(Larrivee) combines several projections to create a map with a dented shape.

McBride-Thomas projection(McBryde - Thomas Flat - Pole Quartic) is a map of pseudo-regular cylindrical projection used for world map.

Mirror projection(Miller Cylindrical) is an improved map that can represent the extremes that could not be drawn by the Mercator projection.

Mollweide projection(Mollweide) is a pseudo-cylindrical projection that can display the whole earth as one ellipse with the correct area.

Natural earth graphics(Natural Earth) is one of the pseudocylindrical projections. Tom Patterson, a cartographer who has developed numerous open source tools on maps.

Nell · Hummer projection(Nell-Hammer) is a map of a shape obtained by stretching an ellipse horizontally, based on an orthogonal cylindrical projection.

Quartic Authalic is a map made of two sinusoids using pseudocylindrical projection.

Robinson projection(Robinson) is a map that adjusted the area and distortion which was a problem in the existing projection method.National GeographicBut it has been used.

Sinusoidal projection(Sinusoidal) is one of the pseudocylindrical projections correctly representing the area, also called Sanson projection.

Van der Glinthen projection(Van der Grinten) is a map showing the whole earth as a circle.

Wagner 6th projection(Wagner VI) is a pseudocylindrical map showing the whole earth in an elliptical shape, the North Pole and the South Pole are linear.

Wagner 7th projection(Wagner VII) is a map improved to draw Antarctica.

Winkel projection(Winkel tripel) is a combination of eccentric projection and Etoff projection, it has very small distortion and is suitable for displaying a world map.

The entire map of the map used in the visualizing map distortion can be seen from the following page.
Comparing Map Projections
http://bl.ocks.org/syntagmatic/ba569633d51ebec6ec6e

Related Posts:
in Web Service, Posted by darkhorse_log


