What will happen if you shout loudly toward the disk array device?

Disk array devices can use multiple hard disks as large capacity storage. The hard disk installed in the disk array operates physically using a motor and the like, and the built-in parts perform very delicate operation, so there is a weak point that it is vulnerable to vibrations. Oracle 's Fishworks team is conducting experiments shouting loudly towards the disk array device, and we show how it behaves like a device with many vibrating vulnerable hard disks on YouTube.
Shouting in the Datacenter - YouTube
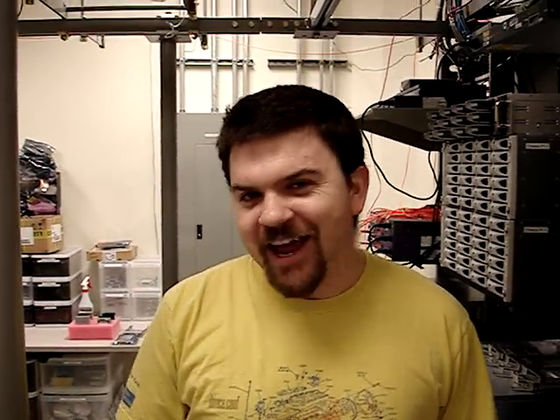
"I am Brendan, belonging to the research team of Fishworks, I think we can show interesting things from now on," says Brendan Gregg, who performs an experiment shouting loudly to the disk array device.
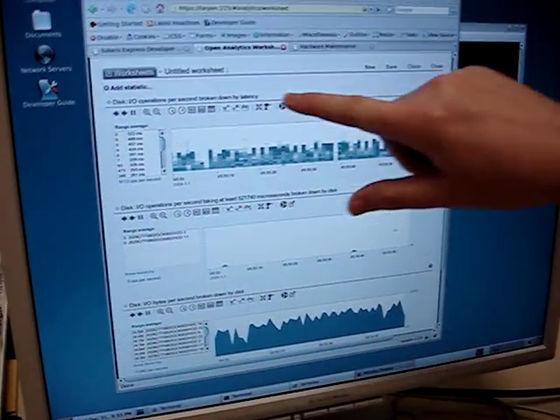
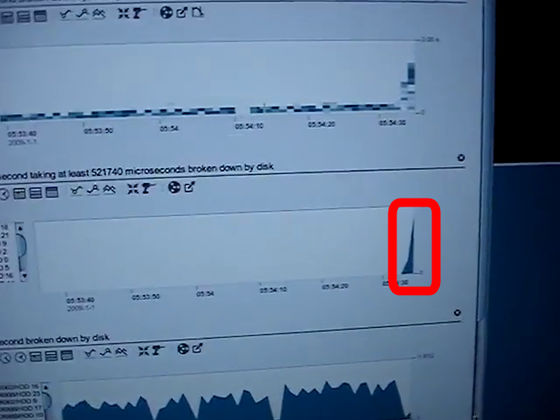
Mr. Greg points to the Solaris screen and explains "Here we measure the latency (waiting time) of disk I / O processing."
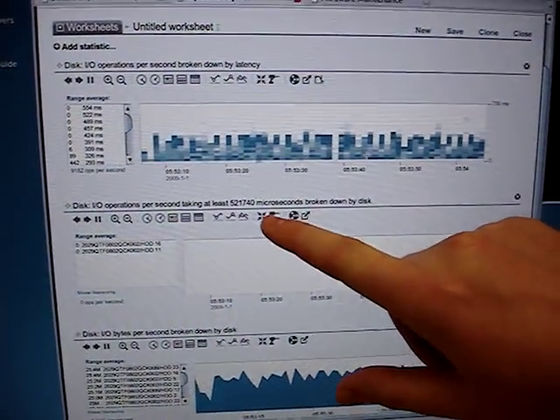
Next, Mr. Greg, who pointed to the middle graph, said, "We added detailed information so that you can see the state of disk I / O in units of 500 milliseconds as experimental data," and analyzed the hardware Using DTrace as a tool, we were able to measure latency in 1 second increments if it was originally intended, but we also made it possible to acquire 0.5 second unit data for this experiment.
Mr. Greg said, "If it is not recommended or recommended from now on, it is an unsupported act," tells the viewers that they should never imitate it.

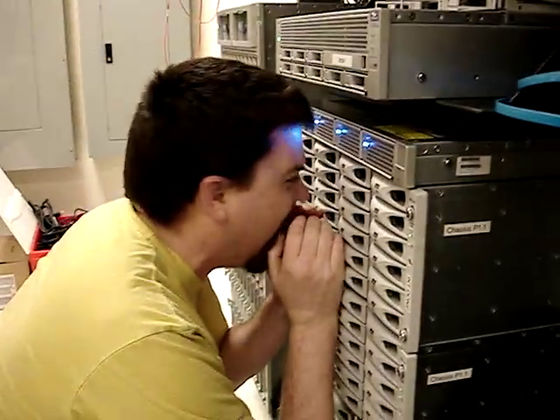
And, immediately afterwards Mr. Gregg raises a loud voice toward the disk array device.
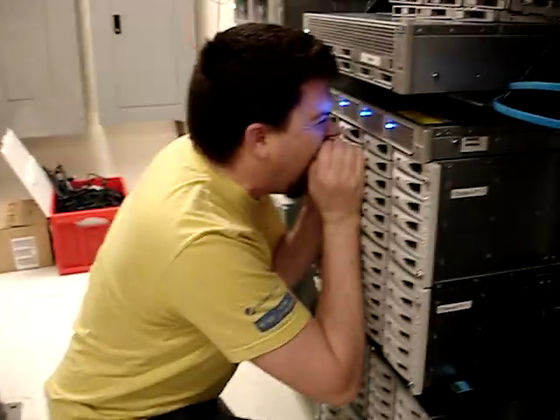
Then the previous graph moves and you can make a big mountain.
Mr. Greg opens a little time and gives out a loud voice again.
A second mountain appeared on the DTrace graph.
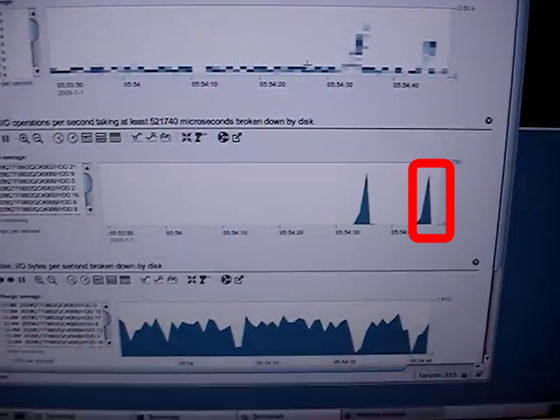
Mr. Greg said, "This is the effect of vibrating the disc, not a special effect, it is also a serious problem for the disc," explains that the phenomenon is a phenomenon in which the graph swings due to large sound vibration It is.
"When you look at the state of the disk I / O of DTrace, you can see that the latency of the time you were shouting is rising."
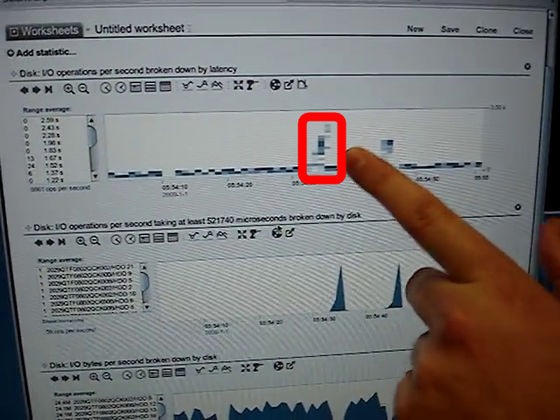
"The graph above is in 1 second increments, but this graph shows latency in 0.5 second increments, so you can find more detailed information."
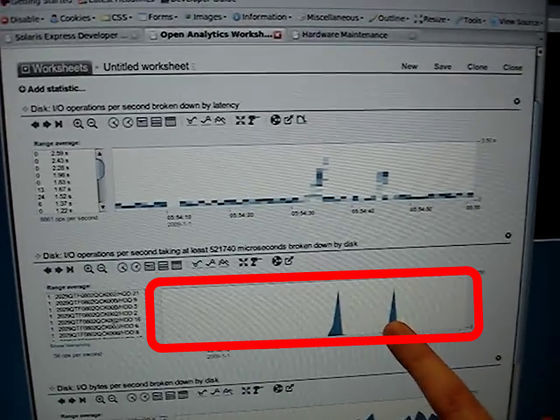
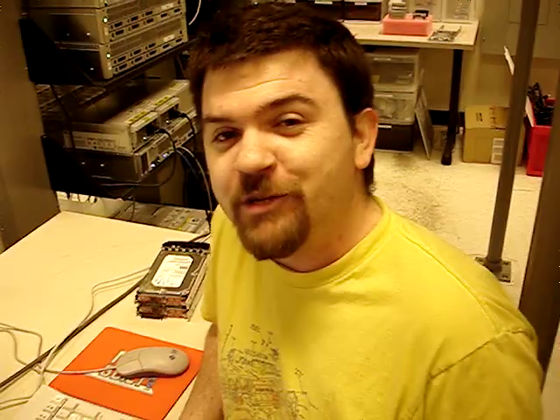
"Fishworks technology can visualize such things, but please never cry in front of JBOD (disk array device)," Greg said, finishing the movie.
Related Posts:

