A report full of trend information to understand what the future Internet will become "2016 Internet Trends"
ByITU Pictures
A 2016 version of the Internet Trends report covering various data related to the Internet that Mary Miker, an analyst of the Internet in general, is open every year has been released. It is clear that the growth of the net is not an advanced country any longer, and the fact that emerging countries, mainly Asia, are becoming the main stage, and more than 200 pages of materials are revealed.
2016 Internet Trends - Kleiner Perkins Caufield Byers
http://www.kpcb.com/internet-trends
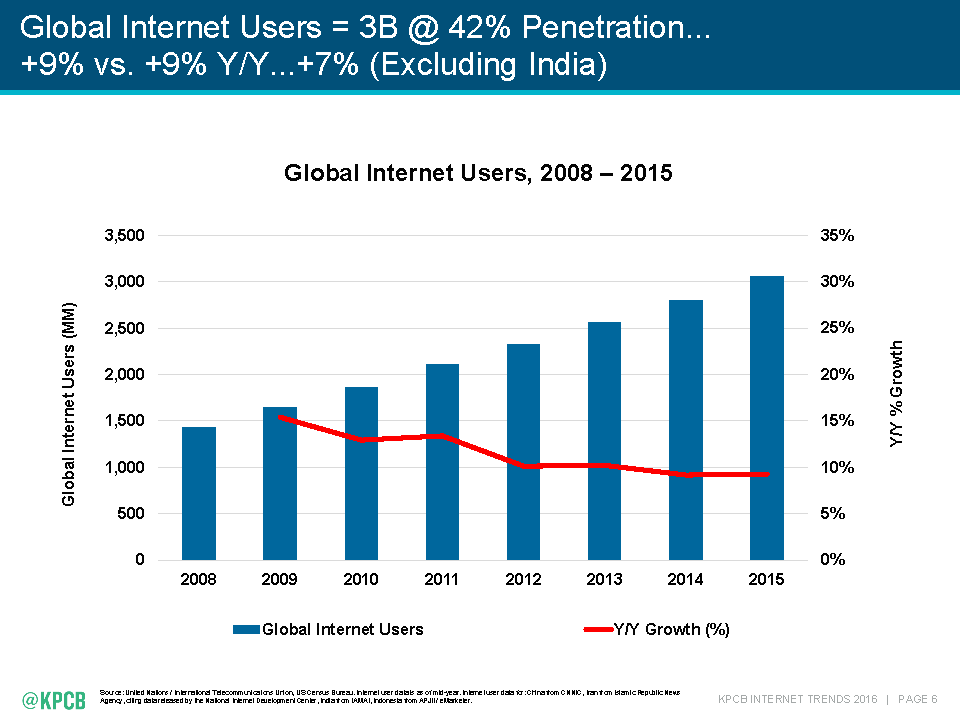
The number of Internet users in the world is 3 billion people, the penetration rate to the population is 42%. However, the year-on-year rate of increase (Y / Y) indicated by the red line has continued to decline from 15% in 2009 and 9% in 2015.
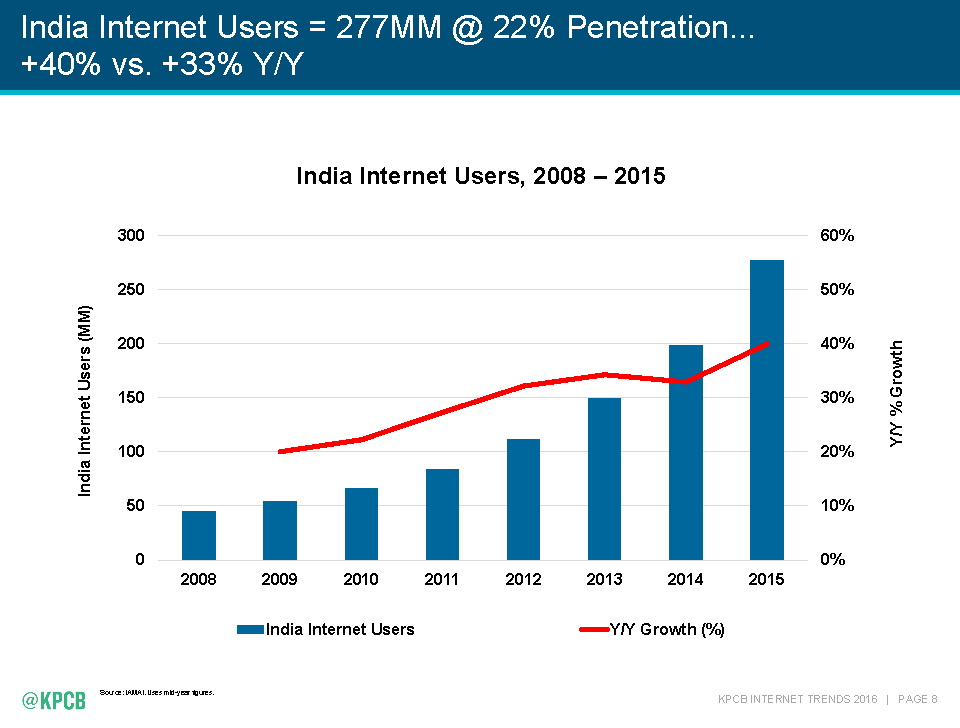
On the other hand, the number of Internet users in India is rapidly increasing. The rate of increase is also rising just right, reaching 40% in 2015. Moreover, the penetration rate in the entire population is 22%, a number that makes us feel the future growth.
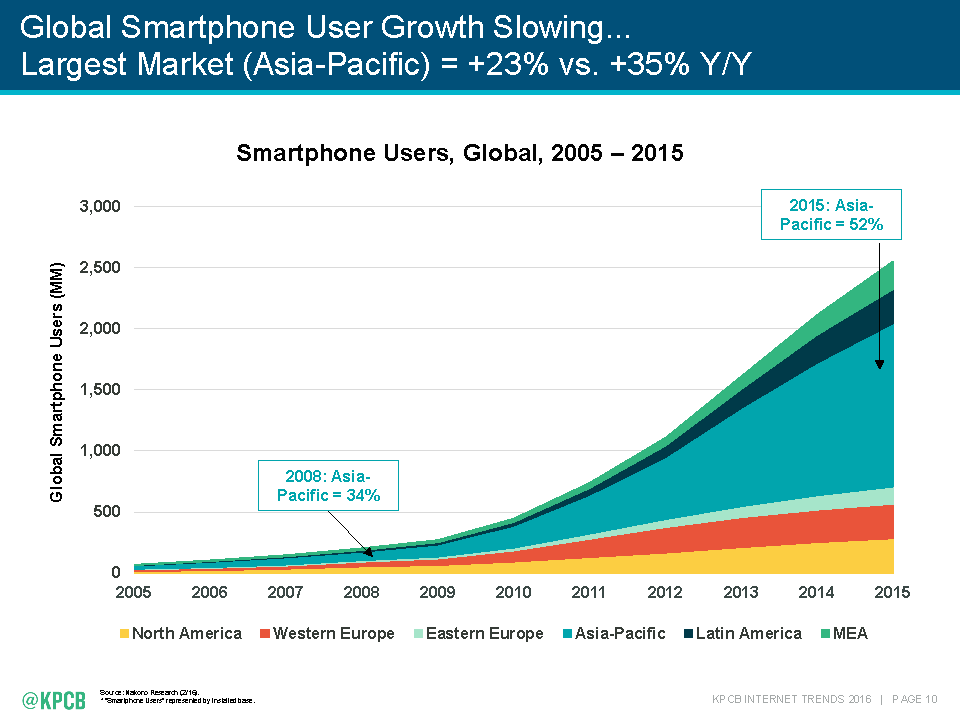
The rate of increase in the number of smartphone users has seen significant growth especially in the Asian region. In 2008, the ratio of users in the Asia-Pacific region, which was 34% of the whole world, has increased significantly to 52% in 2015, and it can be said that the growth in this region is driving the expansion of the market indeed .
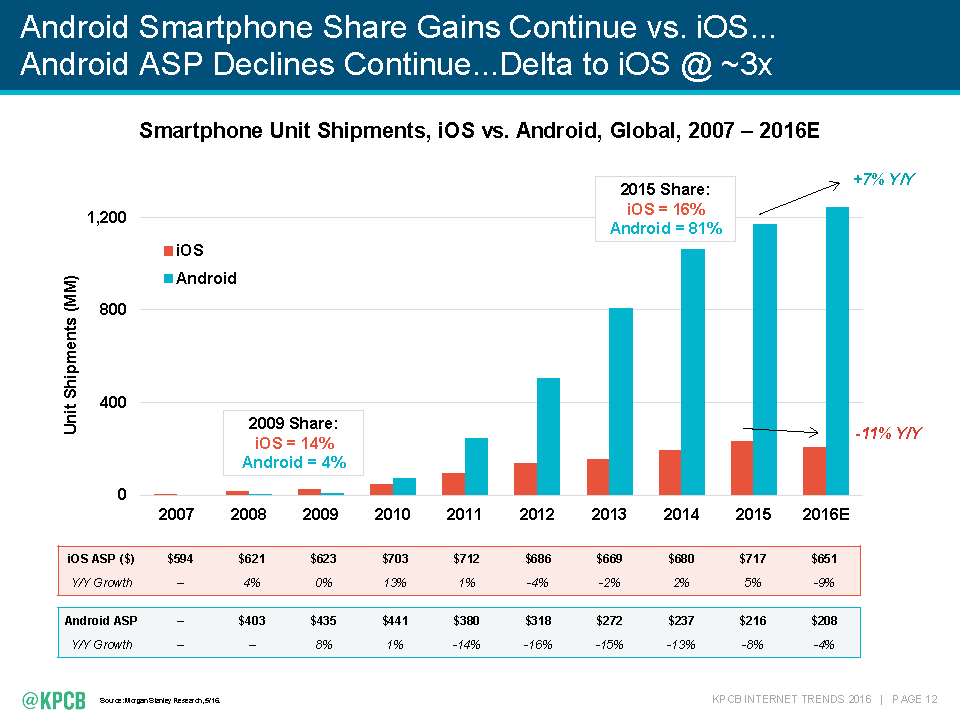
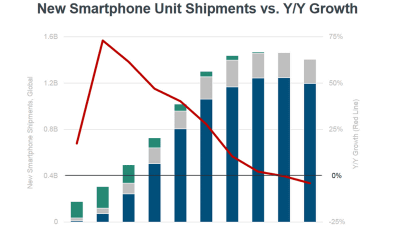
Growth in shipments of smartphones has continued to decline at around 80% in 2010. It is down to around 10% in 2015.

Comparing changes in the number of shipments between Android and iOS devices, you can see that only Android is growing dramatically. The difference in growth rate is also a point of attention, but also pay attention to the numerical value of ASP (average selling price) written at the bottom. The iOS terminal repeats up and down in the range of 600 to 700 dollars (about 60,000 yen to 70,000 yen range), whereas the Android terminal reaches 441 dollars in 2010 (about 45,000 yen ) To peak at the end of 2016 and is expected to decline to 208 dollars (about 23,000 yen) by the end of 2016. This seems to suggest that Android's growth is strongly related to the increase in low price models.
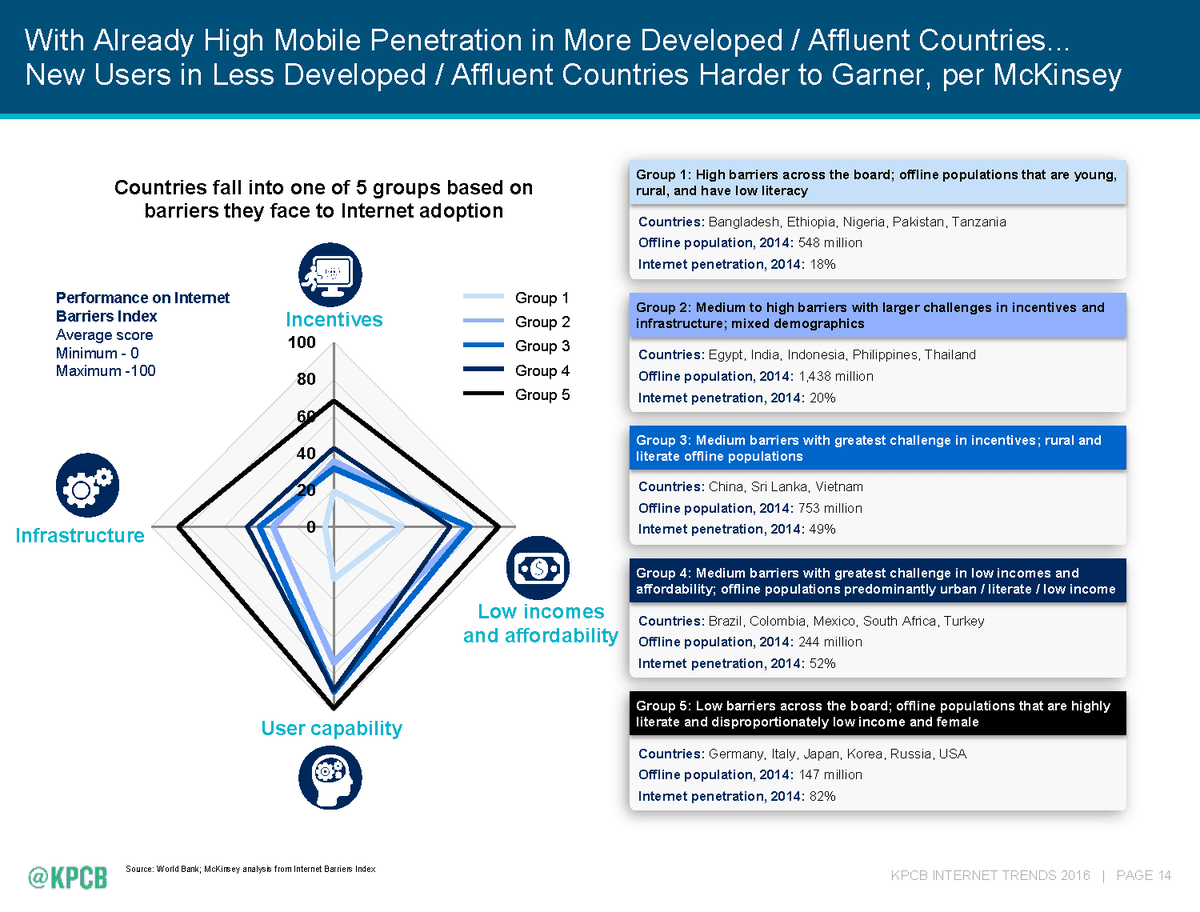
We classified the countries of the world into five groups according to the degree of barriers to the Internet and classified them as "Incentives", "Low incomes and affordability", "User capability", "Infrastructure (Infrastructure improvement) "is summarized in the graph below. It is clear that the figures shown in black lines are higher in IT developed countries such as Japan, South Korea and the United States, whereas the countries with higher barriers to the Internet have lower numbers.
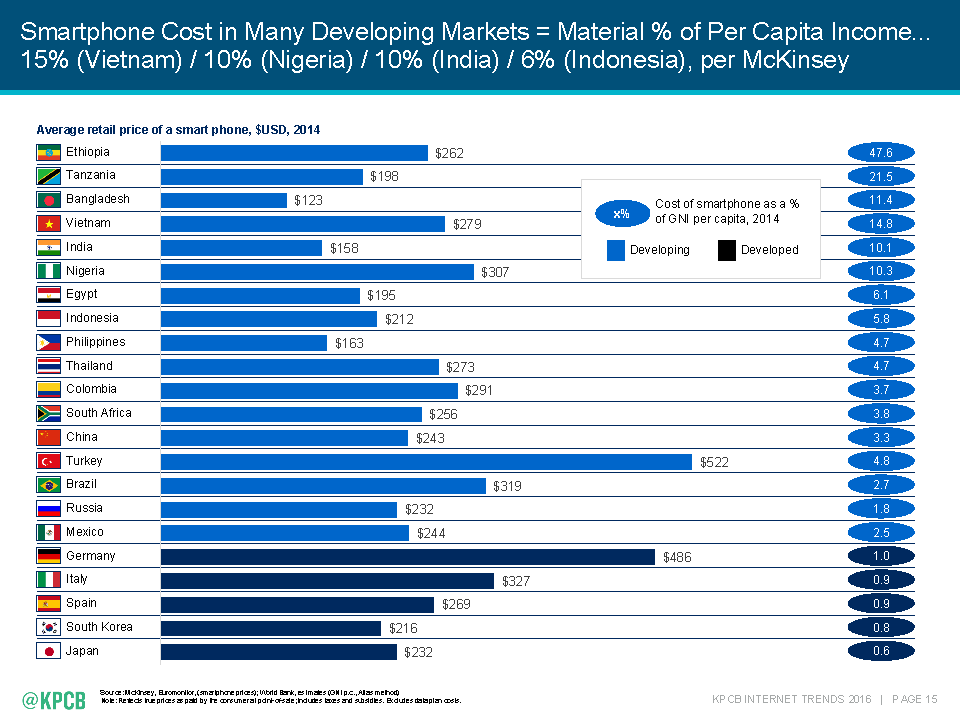
The graph below compares the cost required to get a smartphone to the annual income. The length of the graph shows the absolute value of the cost, and the percentage of the annual income is listed in the ellipse on the right side. Ethiopia was the most expensive (= heavy burden), with the result that terminal price 262 dollars accounted for 47.6% of annual income. Below, 21.5% of Tanzania and 11.4% of Bangladesh, etc. continue, but in developed countries such as Japan, Korea, Spain, Italy etc. the proportion is less than 1%. It is also interesting that the developed countries shown in the dark graph concentrate at the bottom of the graph. This means that the more developed countries are, the more they will change to an environment that makes it easier to obtain smartphones.
◆ Global economic trends
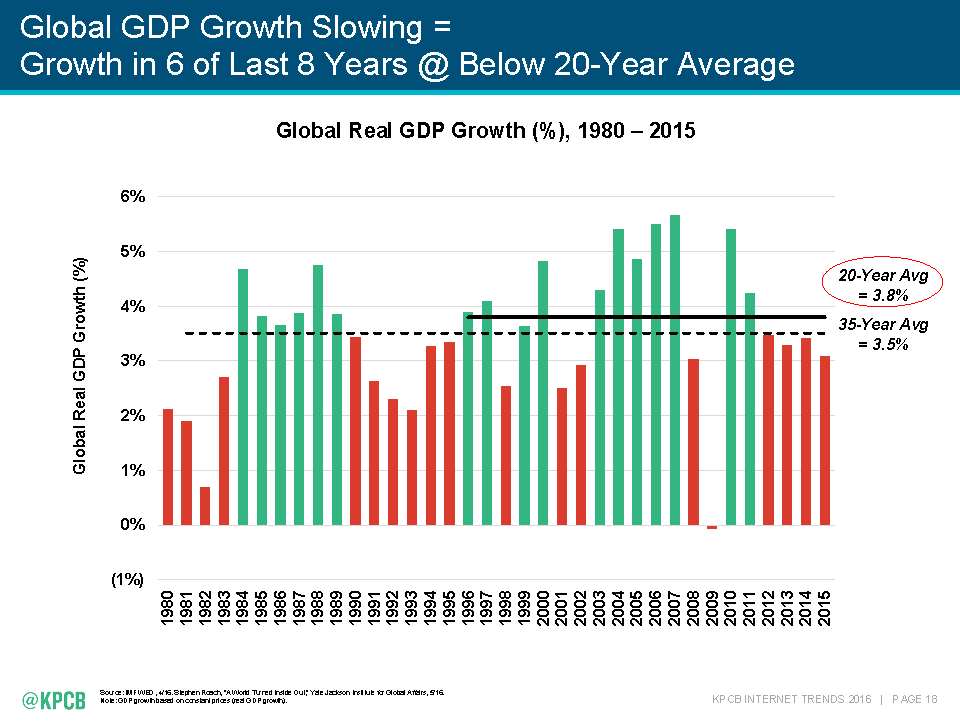
Looking at the GDP growth rate of the whole world, we can see that there is a decelerating trend after 2012. The average growth rate has not been able to exceed the average since 2012 since the average growth rate of 3.5% from 1980 to 2015 continues.
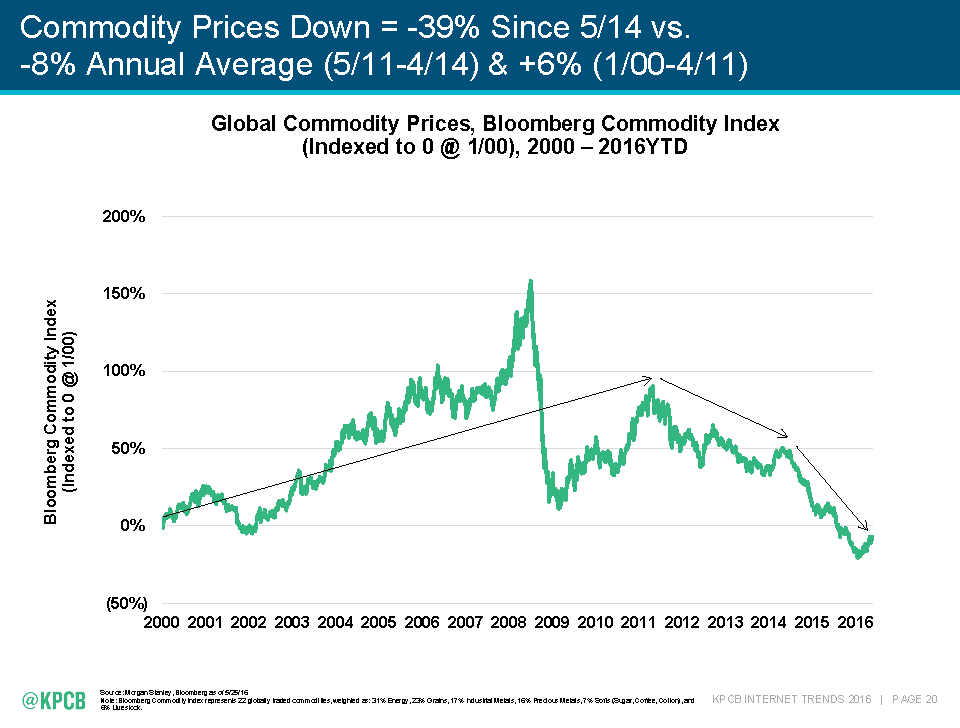
The news media Bloomberg has providedBloomberg Product IndexThis is the change in the futures market. We can see that it is clearly falling trends around 2012.
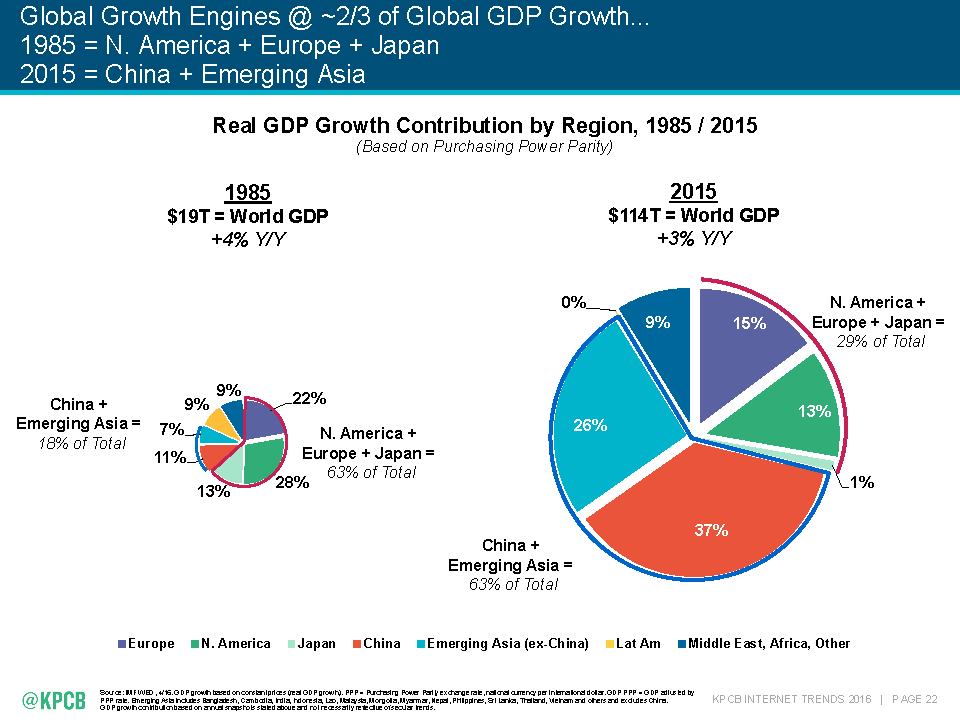
At the time of 1985, the worldwide GDP was 19 trillion dollars (about 2000 trillion yen), a growth rate of 4% compared with the previous year. At that time the economy was dominated by North American, European and Japanese markets, but in 2015 the global GDP increased to 114 trillion dollars (about 1 ky2,400 trillion), and North America, Europe, The proportion occupied by Japan is drastically reduced to 29%. China and the emerging countries of Asia are occupying the remaining 70%.
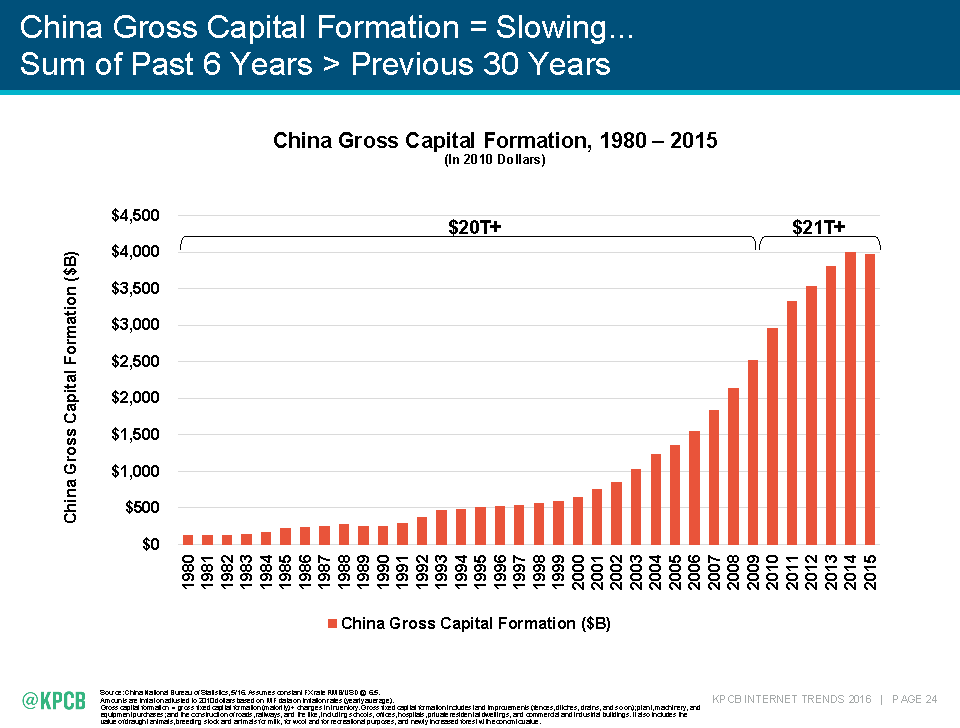
Especially the growth is remarkable in China. Indicates tangible or intangible assets newly purchasedTotal capital formationLooking at the changes in the past six years, the amount in the past six years is larger than the total in the previous 30 years, you can see the rapid growth in recent years. Nonetheless, this growth isHe is showing off his appearanceAlso worth paying attention to points.
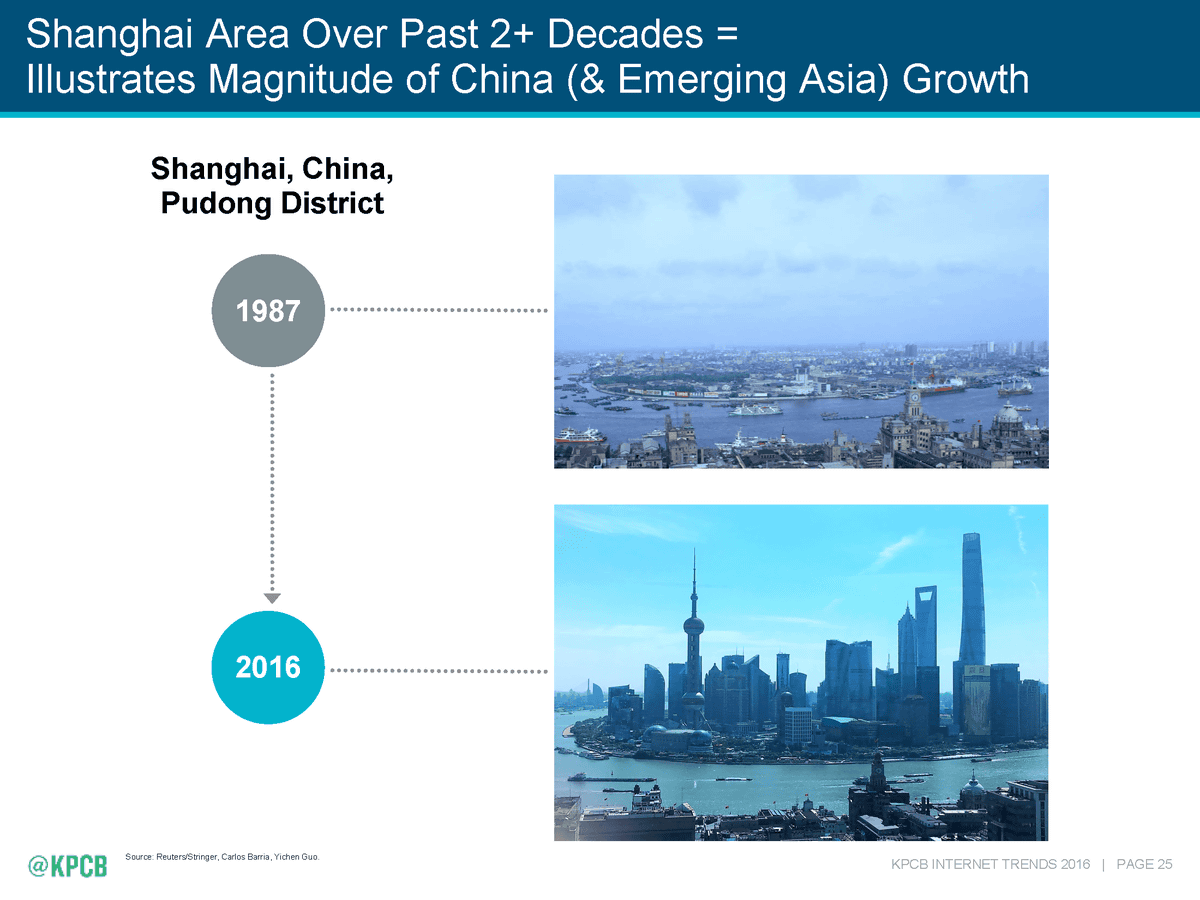
One of the symbols symbolizing its growth is the change in the landscape of Shanghai. At that time in 1987 the high-rise building that was not seen as totally as it was, changed to a situation where it was just forested as of 2016.
Meanwhile, it is also obvious that the ratio of debt (= debt) to the overall economy tends to increase in developed countries
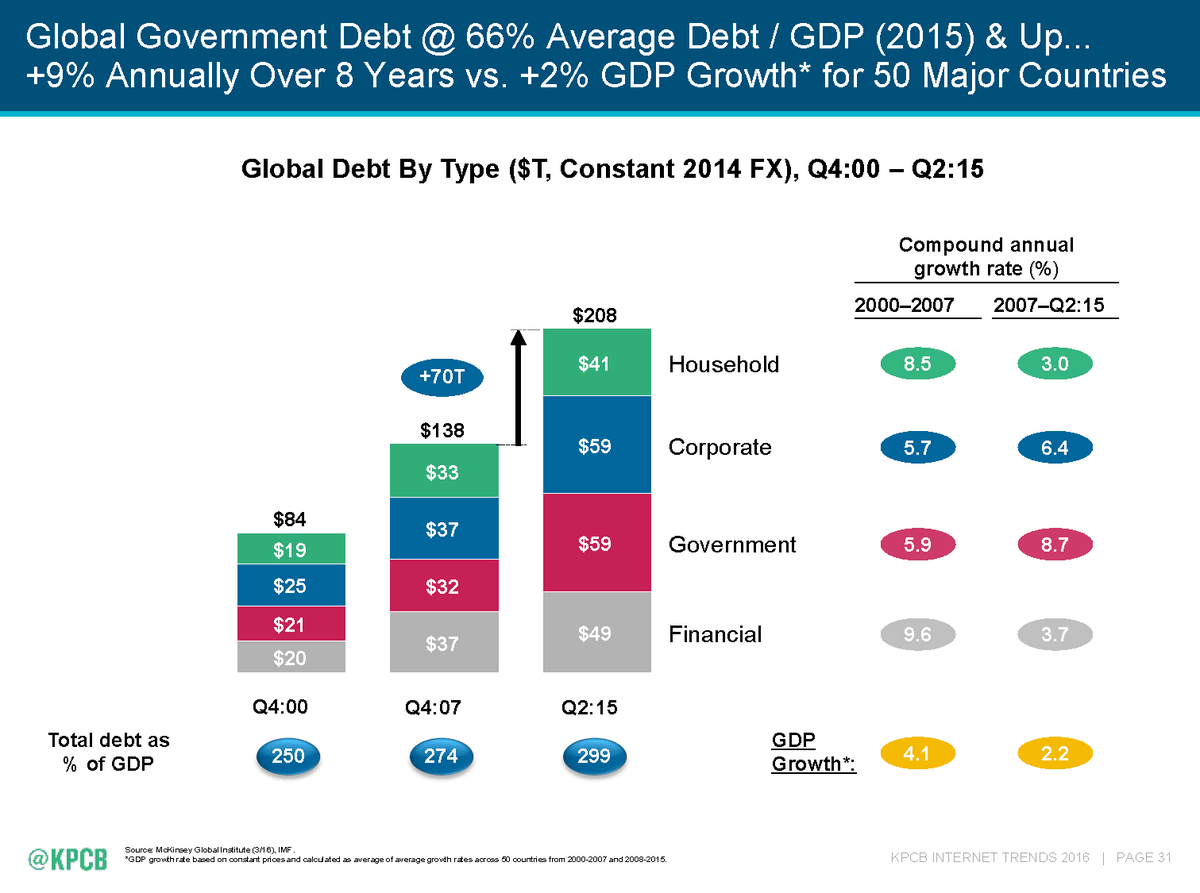
This is a graph plotting the ratio of debt to GDP for each emerging country (light blue) and developed countries (orange). It seems clear that the tendency is higher as the proportion is higher for developed countries.

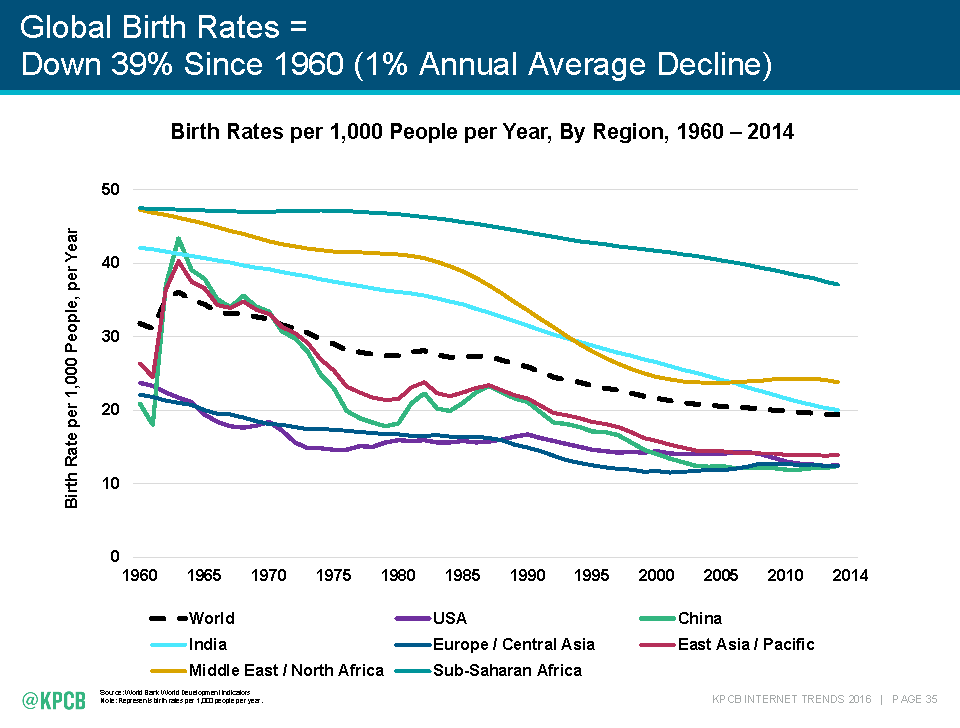
Trend of declining population growth rate in the world
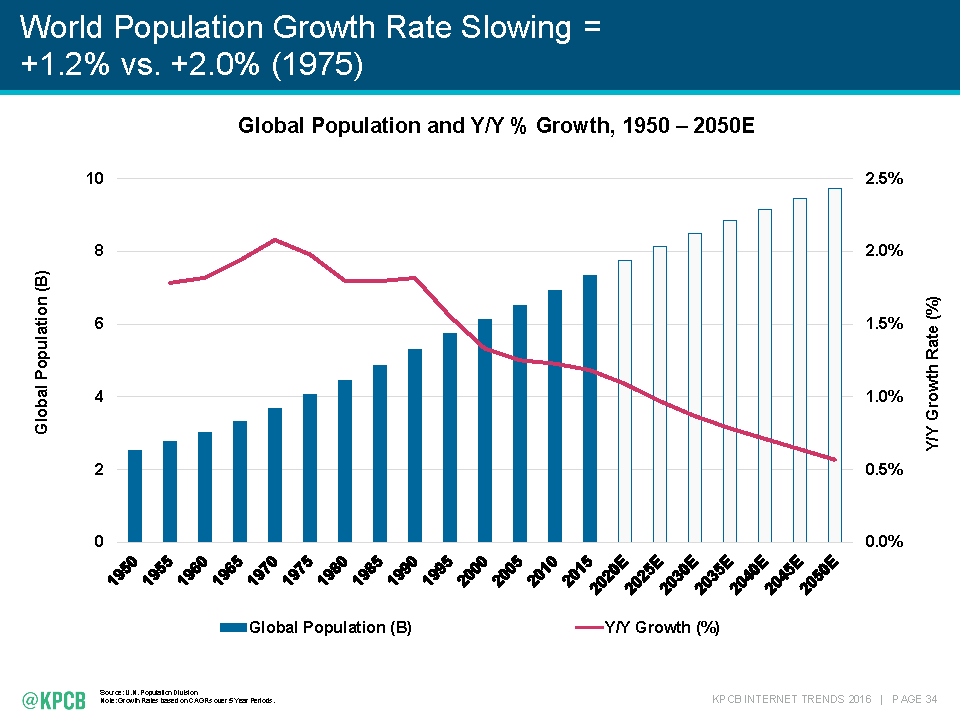
Although it is a decline in the birthrate which is regarded as a big problem in Japan, you can see that it is on a downward trend even in the whole world.
On the other hand,Life of society as a whole tends to increaseYou can see. In the 1960s, the average life expectancy of the whole world which was mid-50 years old changed in 2014 to the 70s.

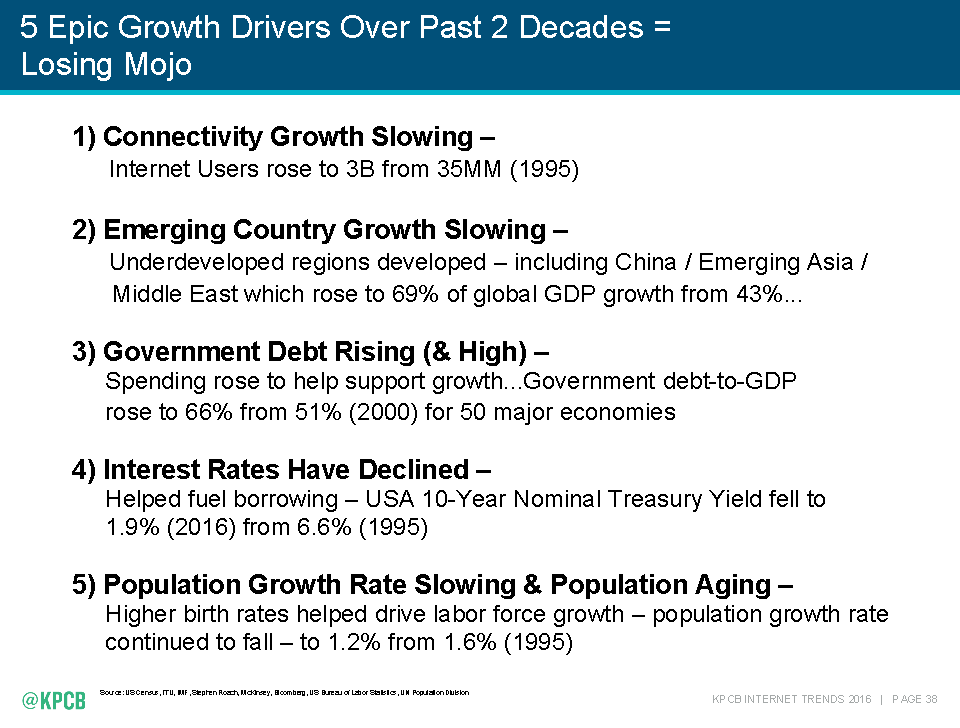
Looking at these circumstances, it is expected that "the growth of connectivity to the Internet will slow down", "the growth of emerging countries will slow down", "the debt of each country will increase," "the interest rate will decline" "the declining population growth rate and the aging" It seems to be said that the growth of power is losing power.
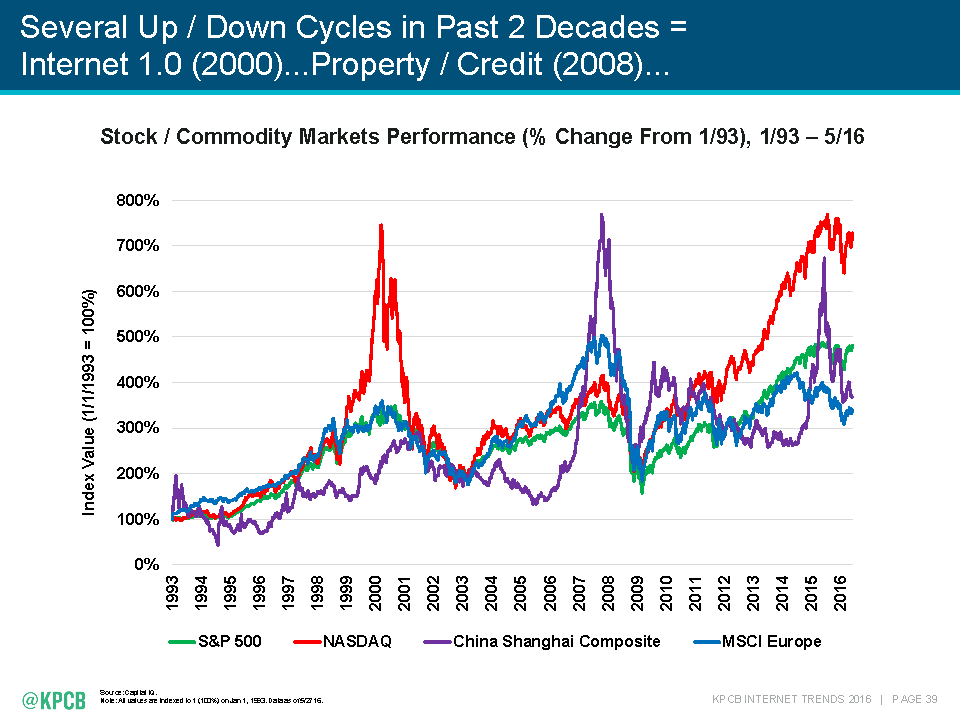
Regular ups and downs have been seen in the global economy. From 2015 to 2016, the NASDAQ in the US has reached its peak, so I am concerned about how we will change from here.
◆ Internet advertisement
The Internet advertising market growth in the US is keeping keeping the 15% to 20% range. Especially, growth of mobile advertisement in light blue color has greatly affected growth of the entire market.

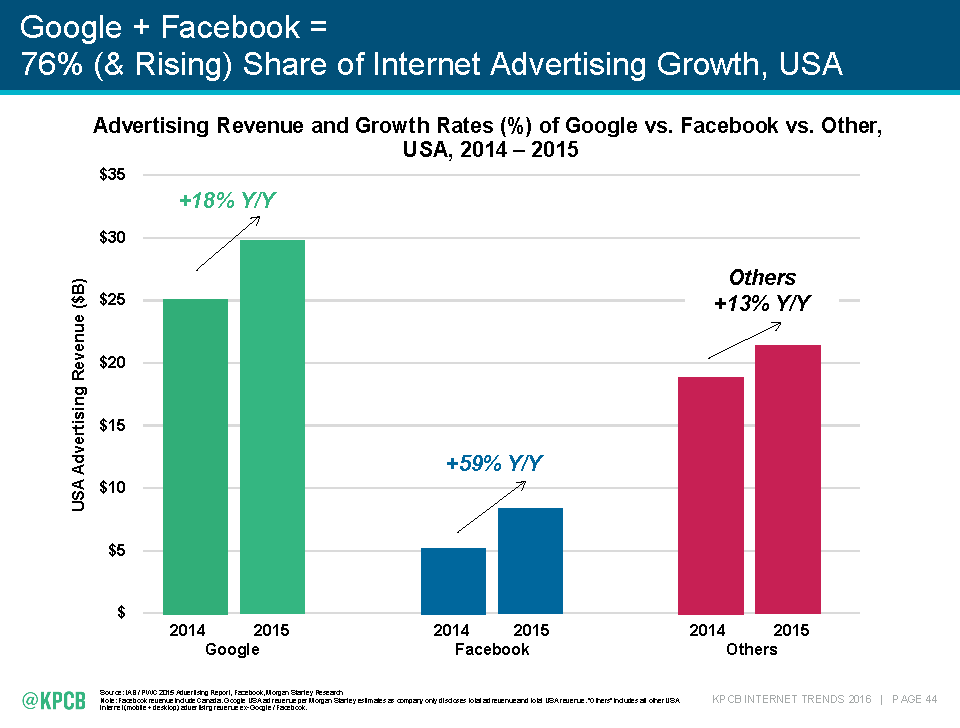
In the period from 2014 to 2015, Google has shown growth of 18%, while Facebook is growing by 59%, while other advertising market also shows a strong growth of 13% Situation.
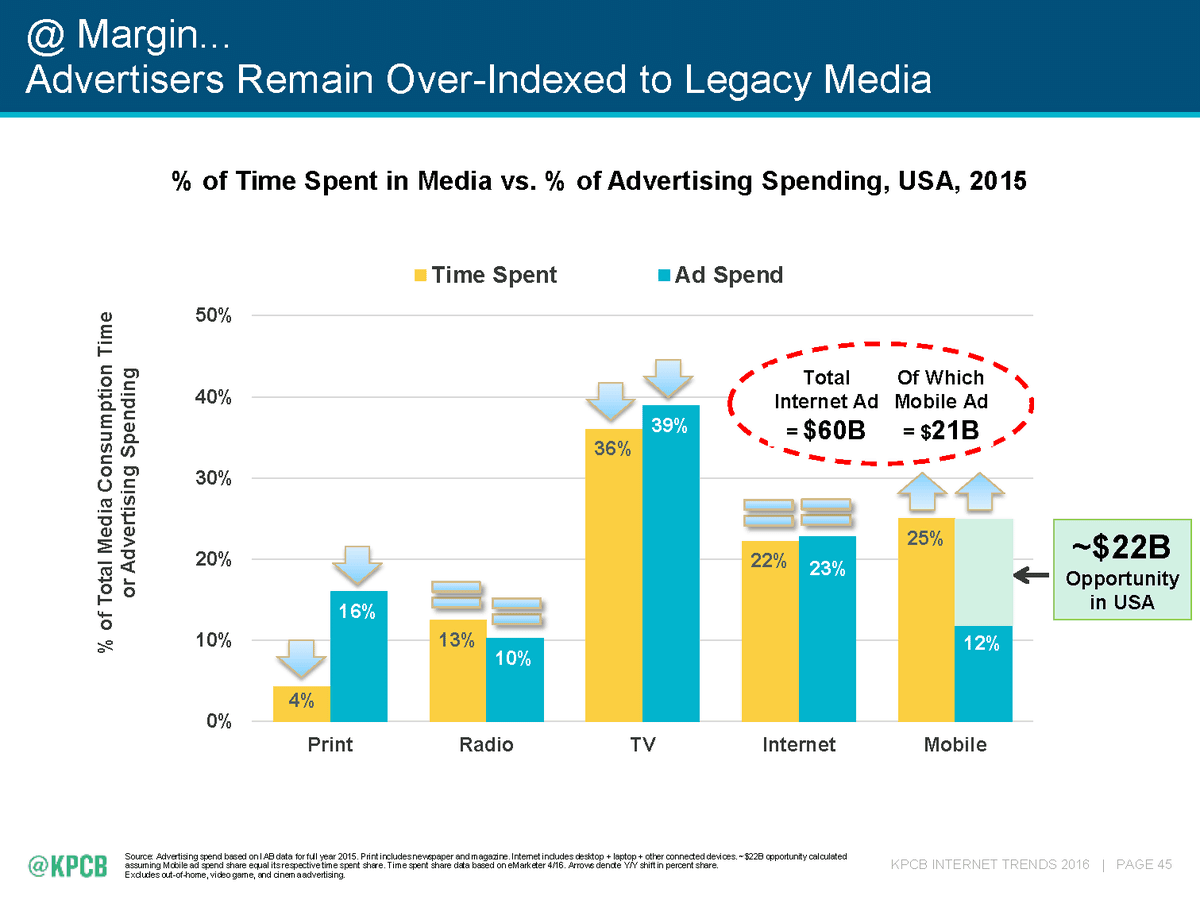
However, it is a feature of mobile advertising that it says that advertisement is less touched than existing media. On the radio, television and the Internet as a whole it is almost the same time, while on mobile it turned out to be greatly reduced.
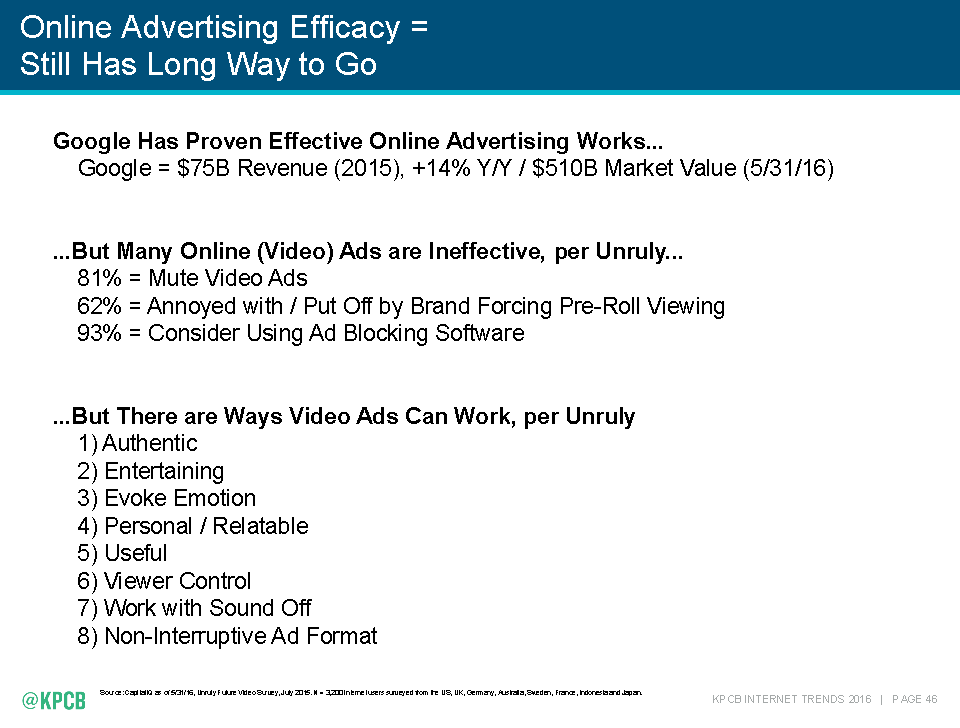
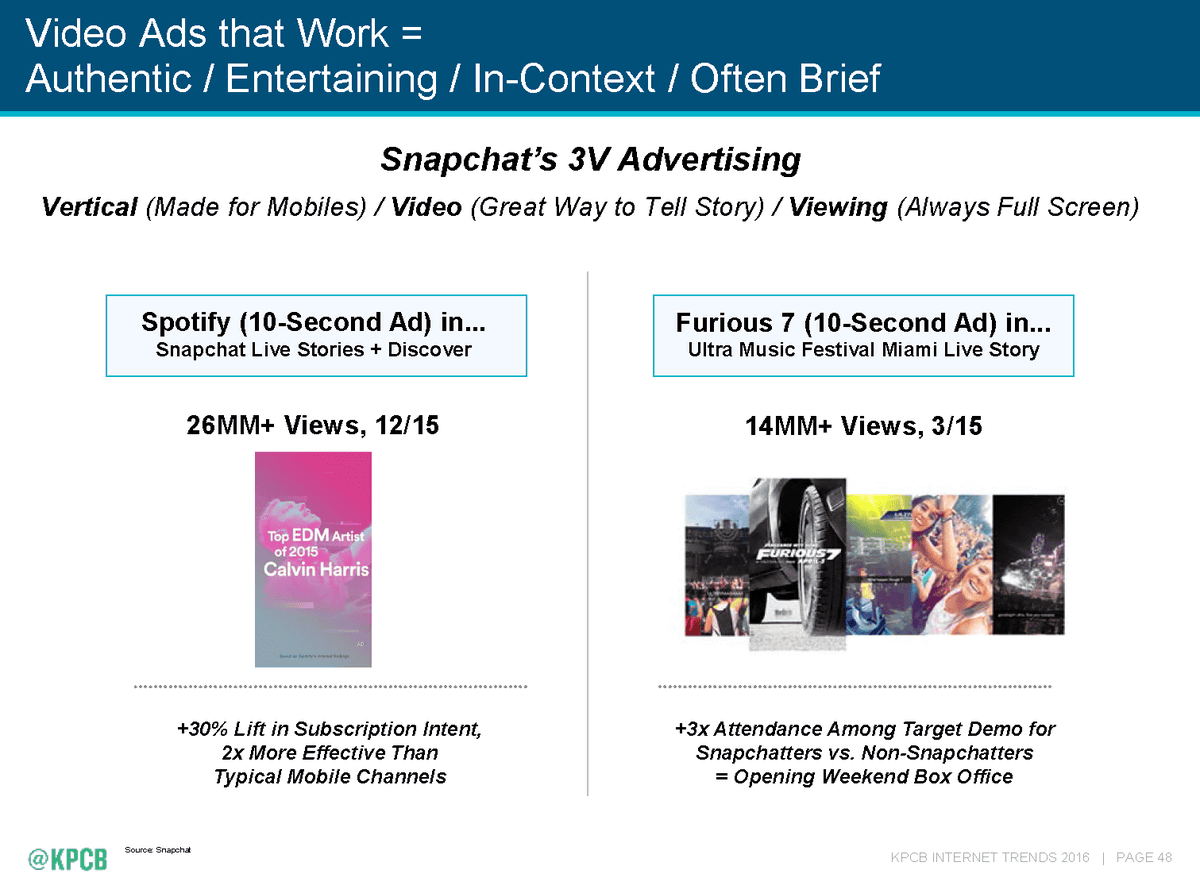
Google's market itself is growing, but we also know that real users mute video ads or feel uncomfortable with pre-roll ads inserted before the video. Nonetheless, countermeasures such as enhancing entertainment and raising usefulness can also be effective.
The big trend in the world of mobile advertising is,Measures for ad blocking function. From around the year 2013, software with ad blocking function has expanded on the Internet, but advertisement block of mobile terminal indicated by blue is growing remarkably.
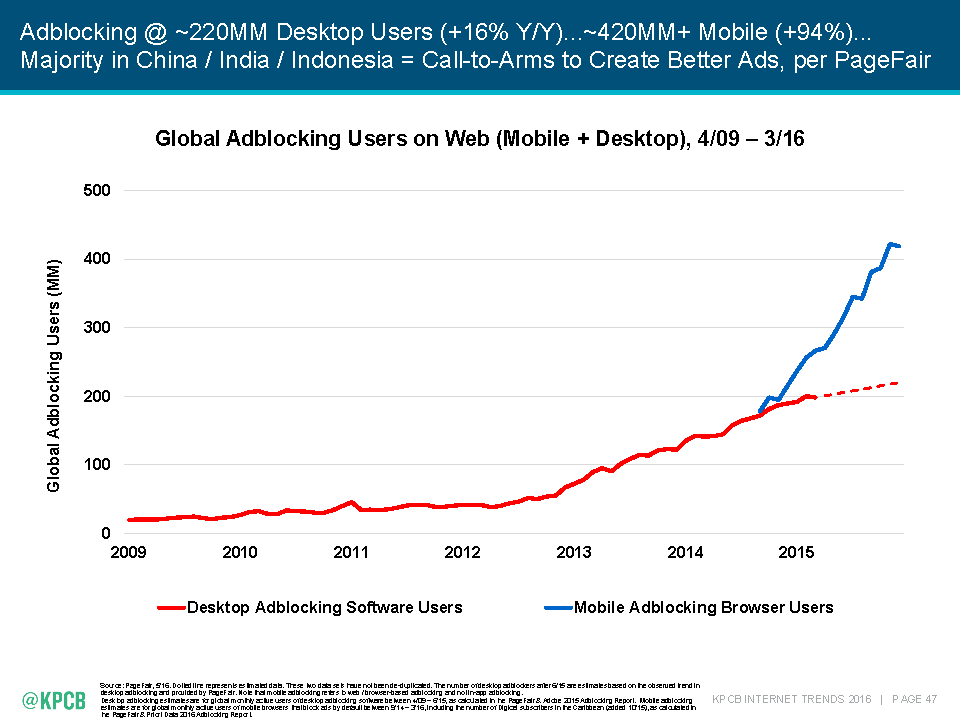
The effective effect on this is the introduction of advertisements (not possible) that do not need to skip for as short as 10 seconds.
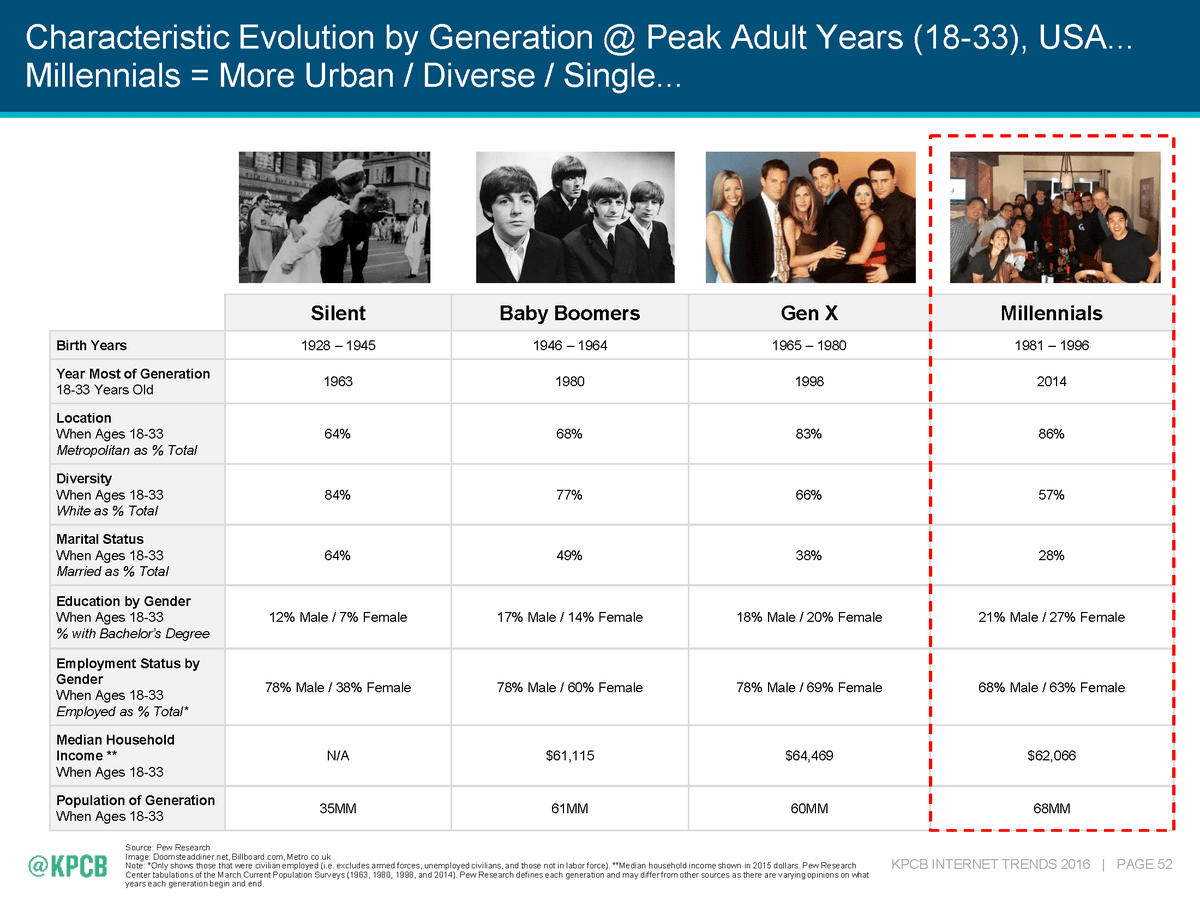
We also know that the reactions are totally different even for generations.
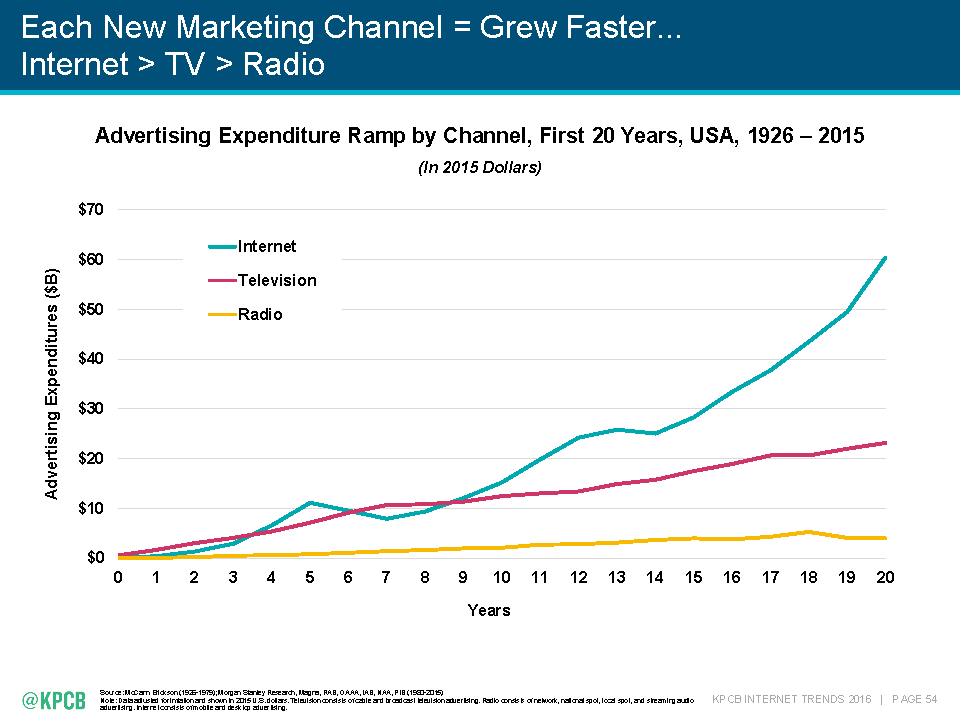
The growth of Internet advertising shows a higher growth rate than the advertisements of radio and television
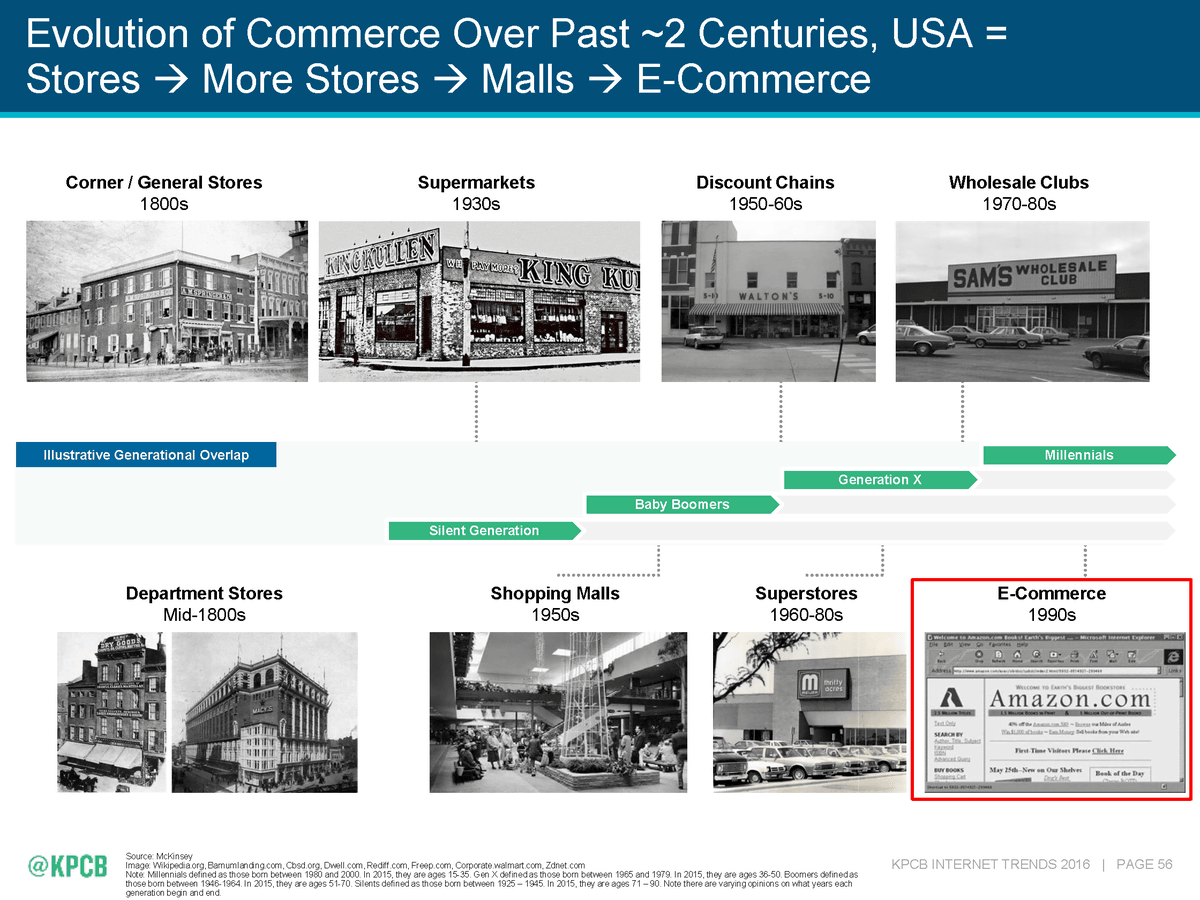
The place to buy things also changed from traditional personal shops to supermarkets, shopping malls, discount / wholesale stores, and now e-commerce such as online shops has changed to show a strong presence.
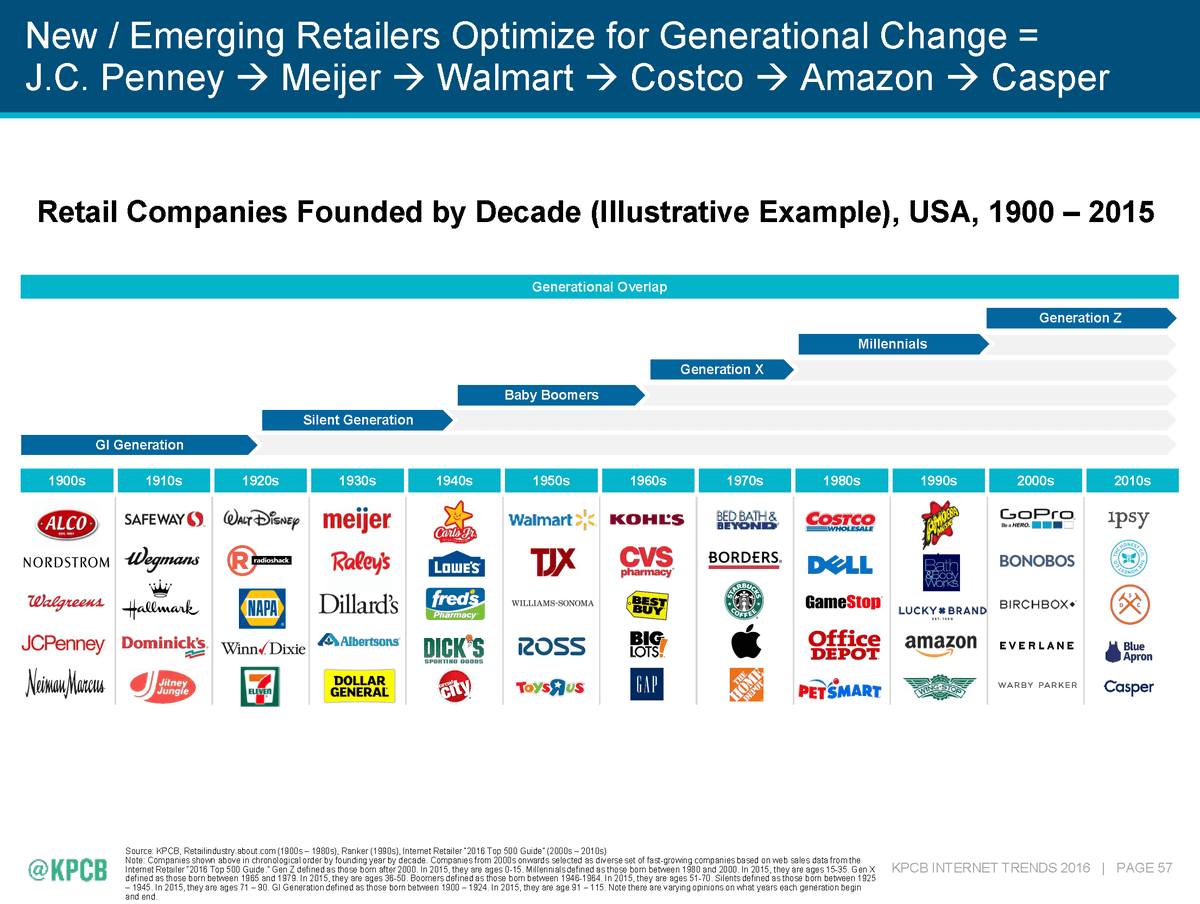
In the case of the US, the main retailers of each era also changed from JC Penny → Meyer → Wal-Mart → Costco → Amazon and when Casper became the mainstream generation of "Generation Z" .
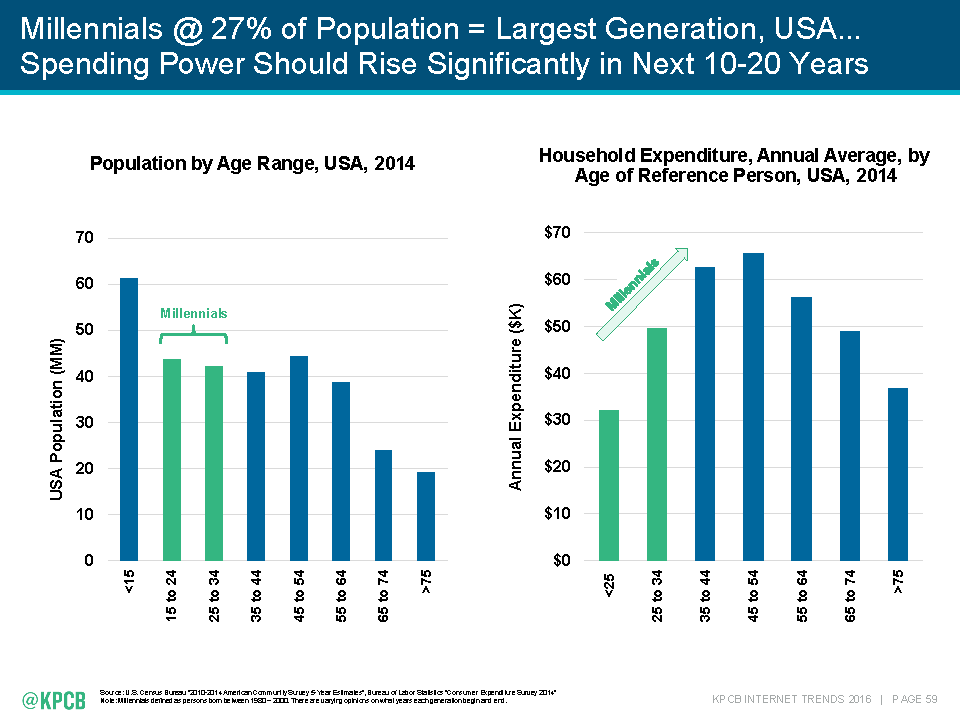
And the Millennial generation, which keeps 27% of the population grows to the generation that buys the most among the next ten to twenty years.
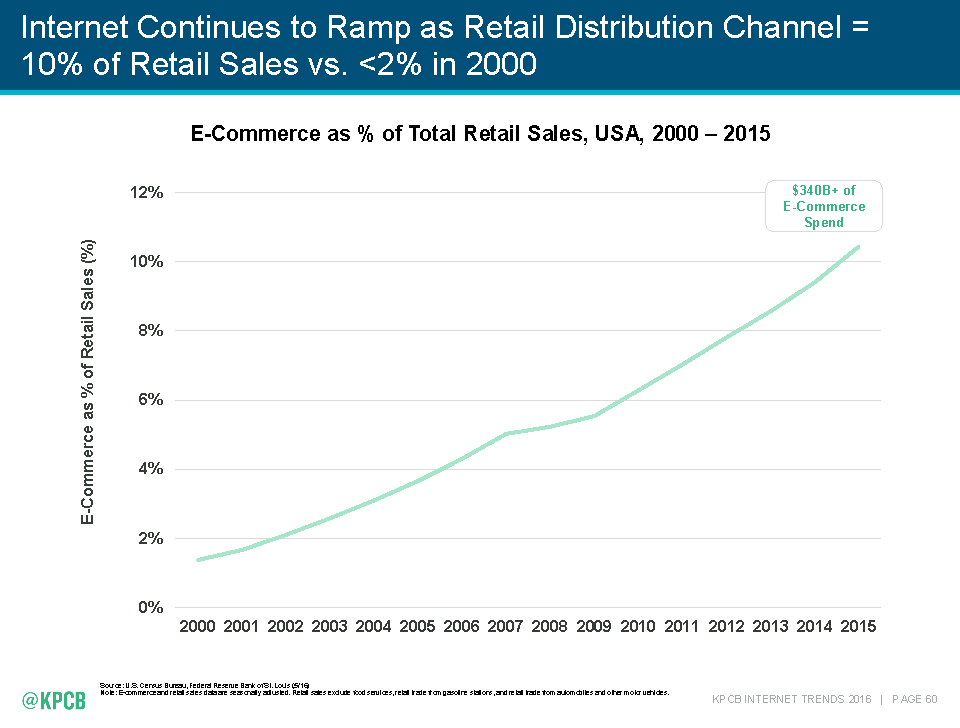
And e-commerce business has been growing since 2000.
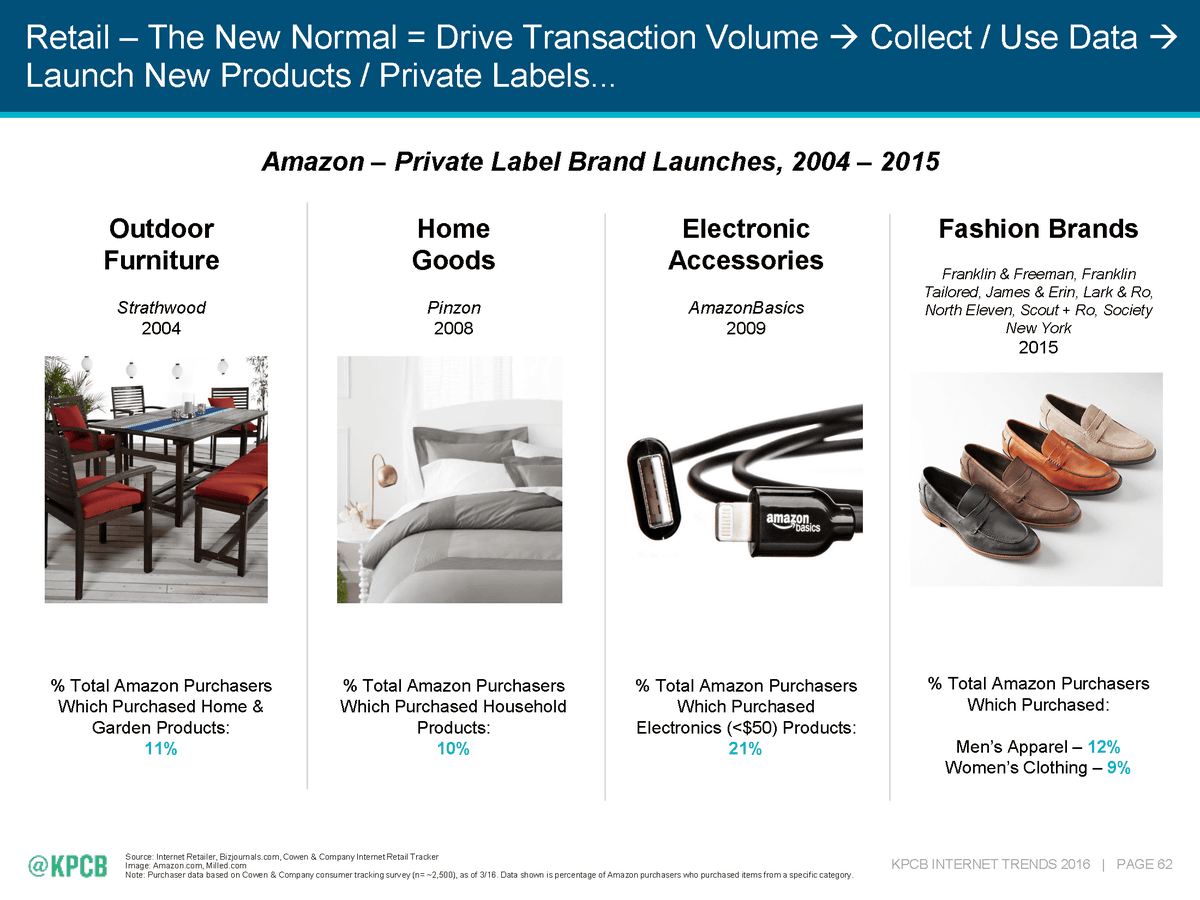
The biggest online retailer,Amazon own brand (private brand)We are implementing measures such as launching measures to expand our market share.
It is also one of the trends that items and brands, and retailers' barriers are vague. There are situations where there are intense changes as many brands retail themselves or retailers set up brands.
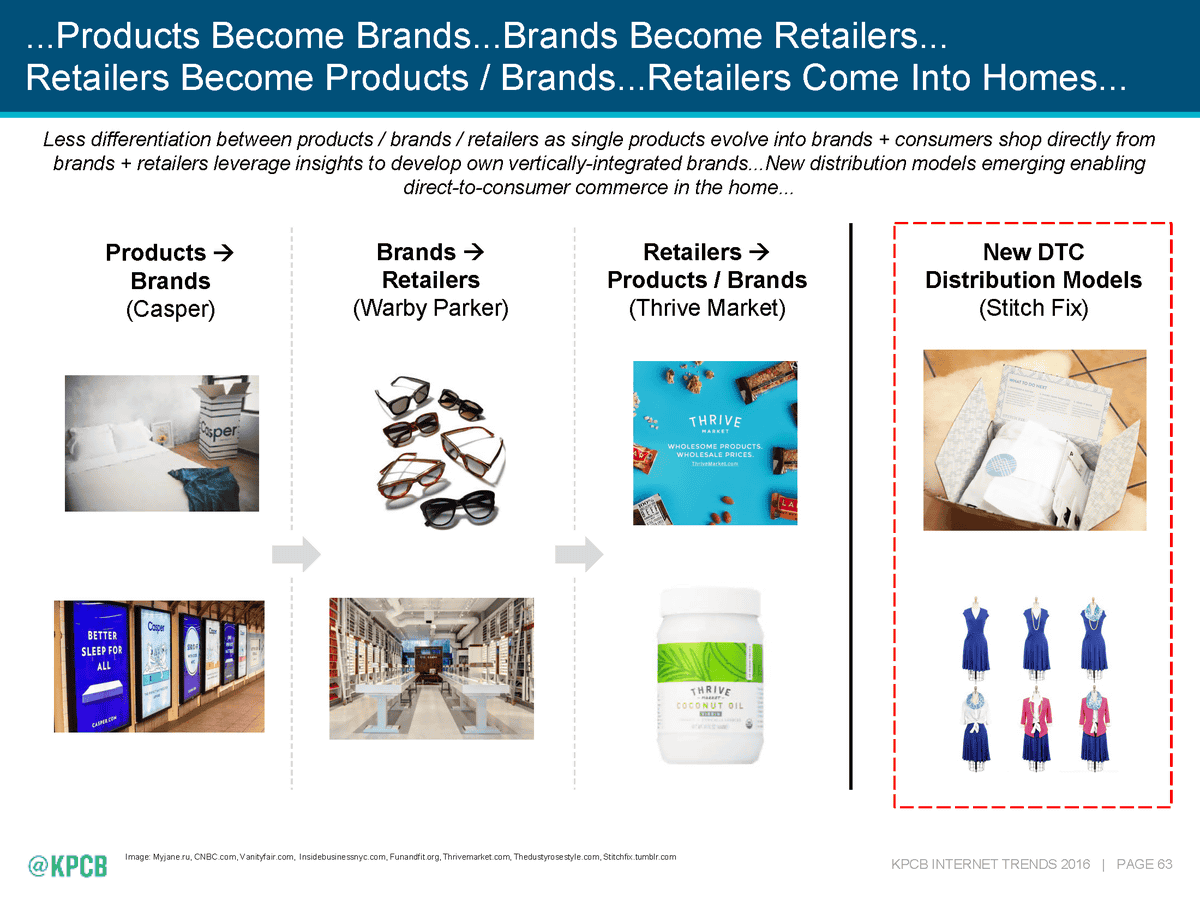
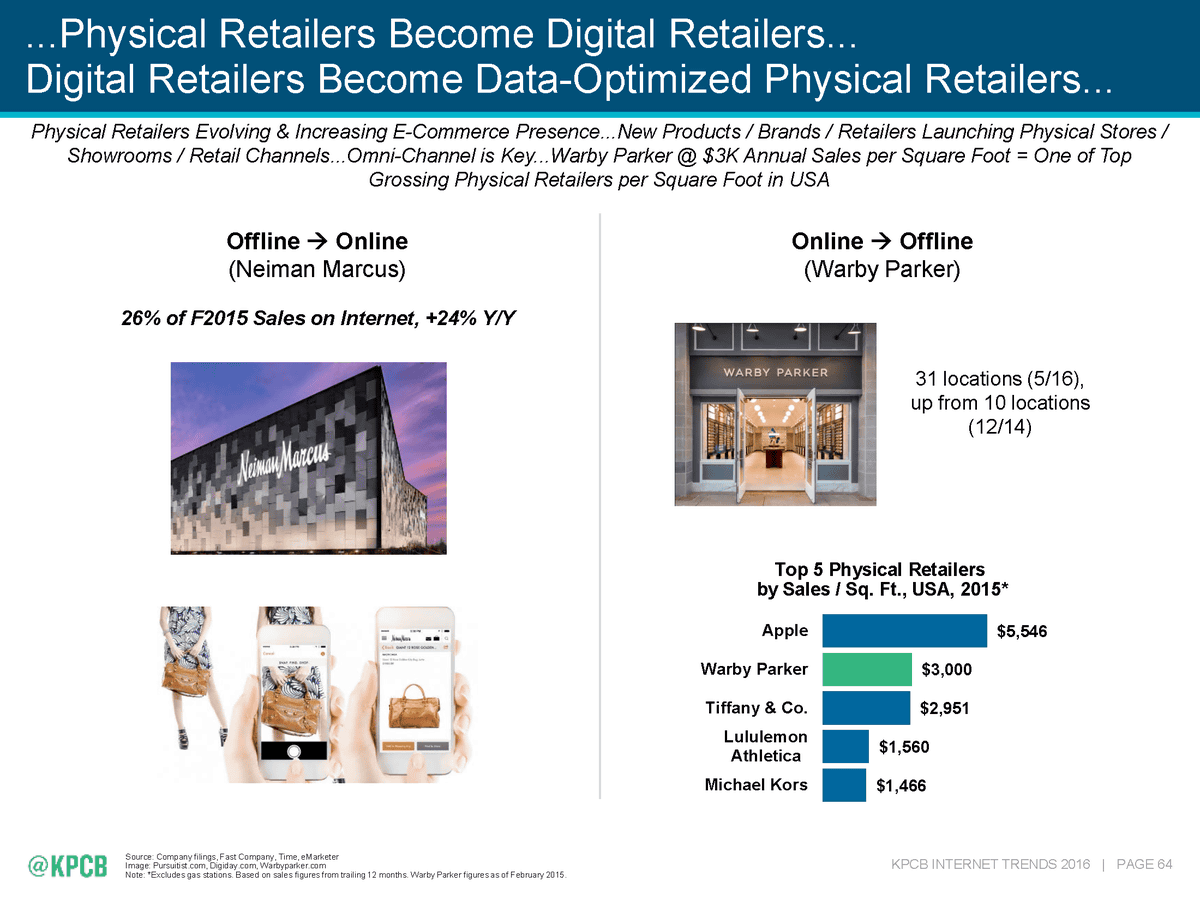
Until now, the flow from the existing store to the internet store was occurring, but now it is also interesting that the retail format of a real store type based on enormous data forms in shape.
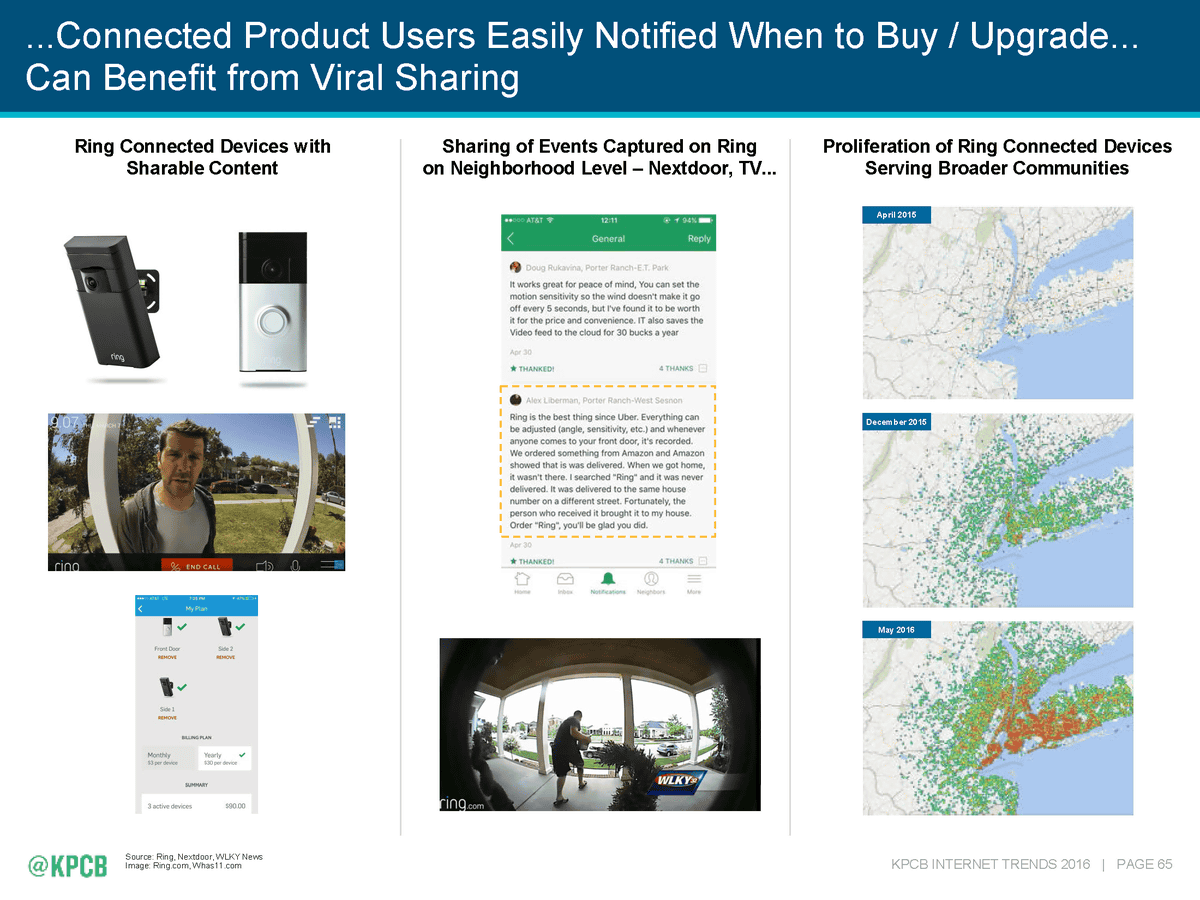
With the increase in the number of devices connected to the net, it becomes easy to know when to buy things, and you can receive various benefits depending on the culture of "share".
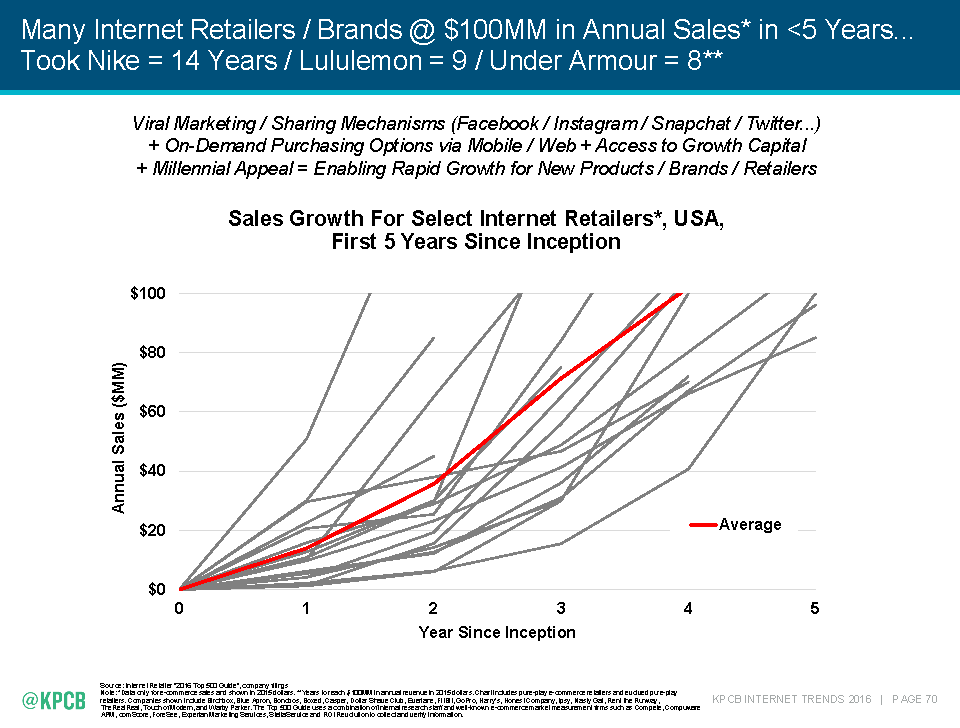
Many net retailers have successfully grown to $ 100 million in five years. This is a much faster pace than traditional companies.
◆ Growth such as SNS · messaging applications
Growth of message applications, mainly mobile, is a recent trend. The main ones are WhatsApp, Facebook Messenger, WeChat, etc.

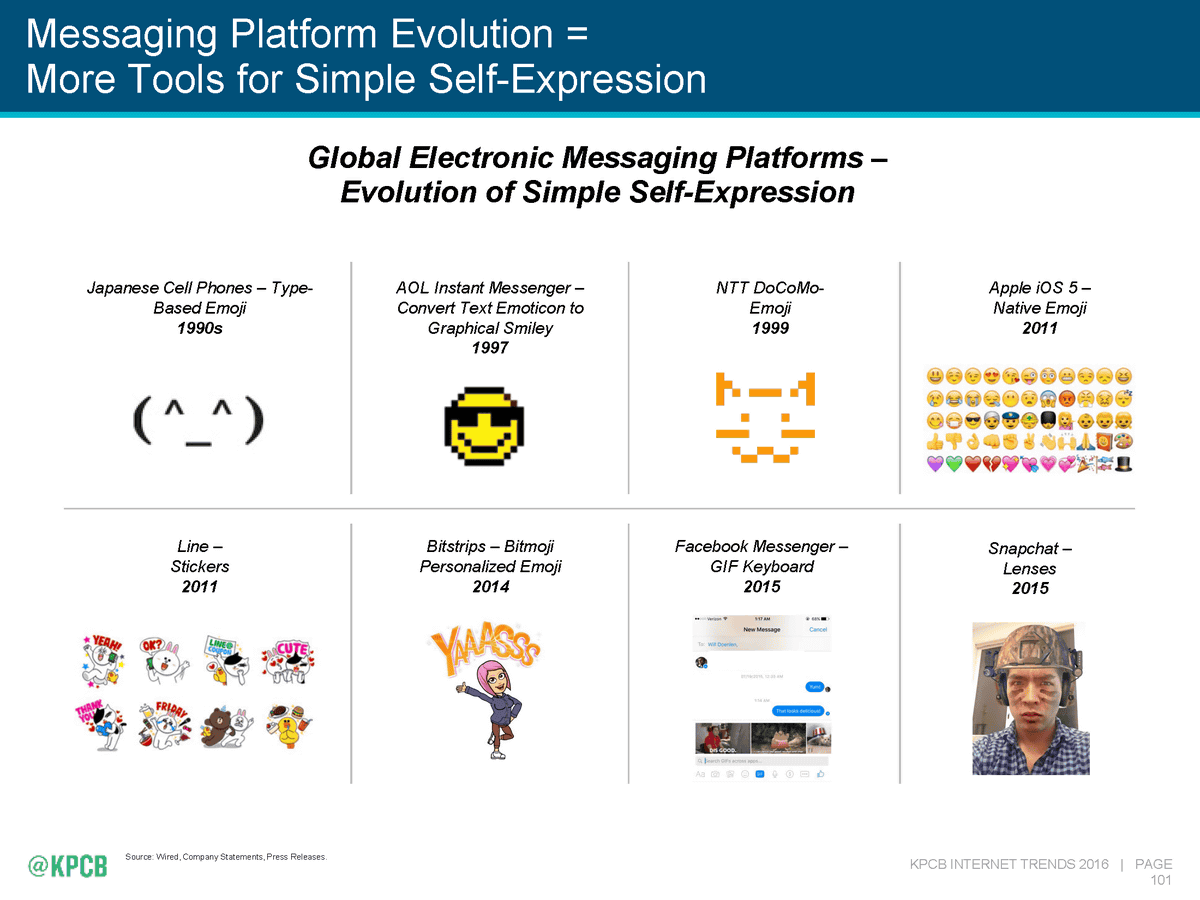
Due to the evolution of the message exchange platform, techniques to express myself are increasing. Communication methods with new functions such as messaging application stamps continue to spread after the illustration pictograms of AOL chat, which started with pictograms of the 1990's combining symbols, became popular.
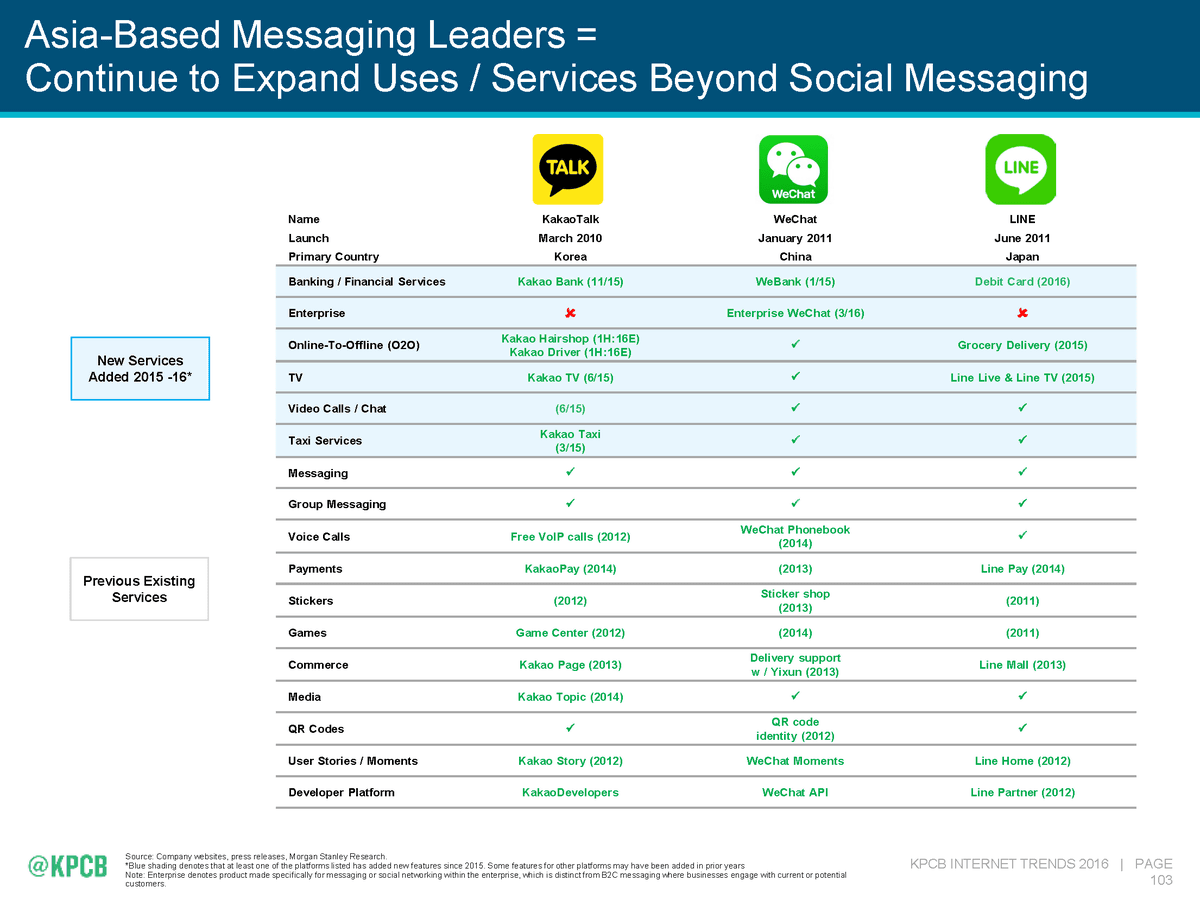
A messaging application that shows great growth in Asia also shows its presence. Cacao talk, WeChat, LINE and others are their most examples.
And there is a trend to utilize that messaging application for business.

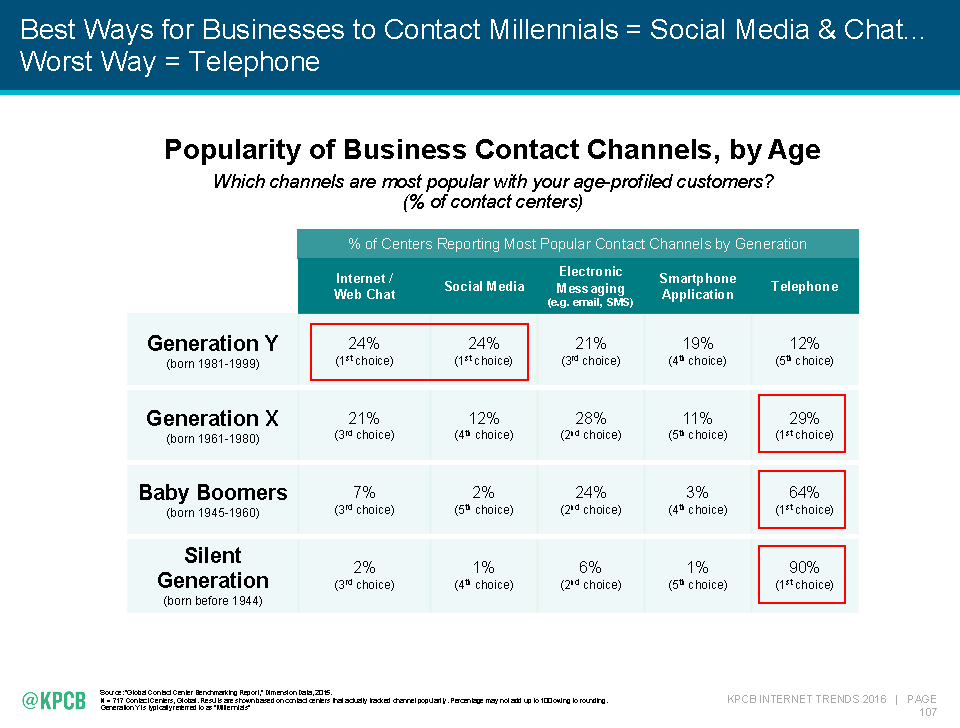
In modern times, approaches to the Millennial generation are social media and messaging applications. Conversely, the method which is not the best is to call "telephone".
The number of applications installed on the terminal is 33 on average worldwide. Among them, 12 people are using everyday, 4 hours a day out of the day to operate the terminal, the average modern figure.
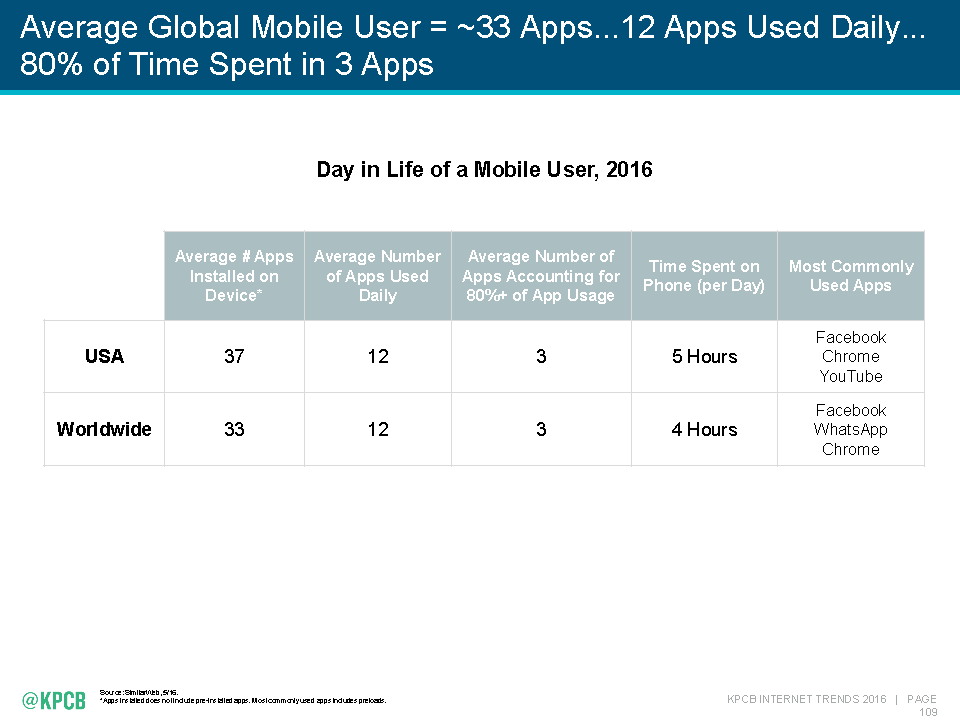
Now that the messaging application is said to be a "second home screen".

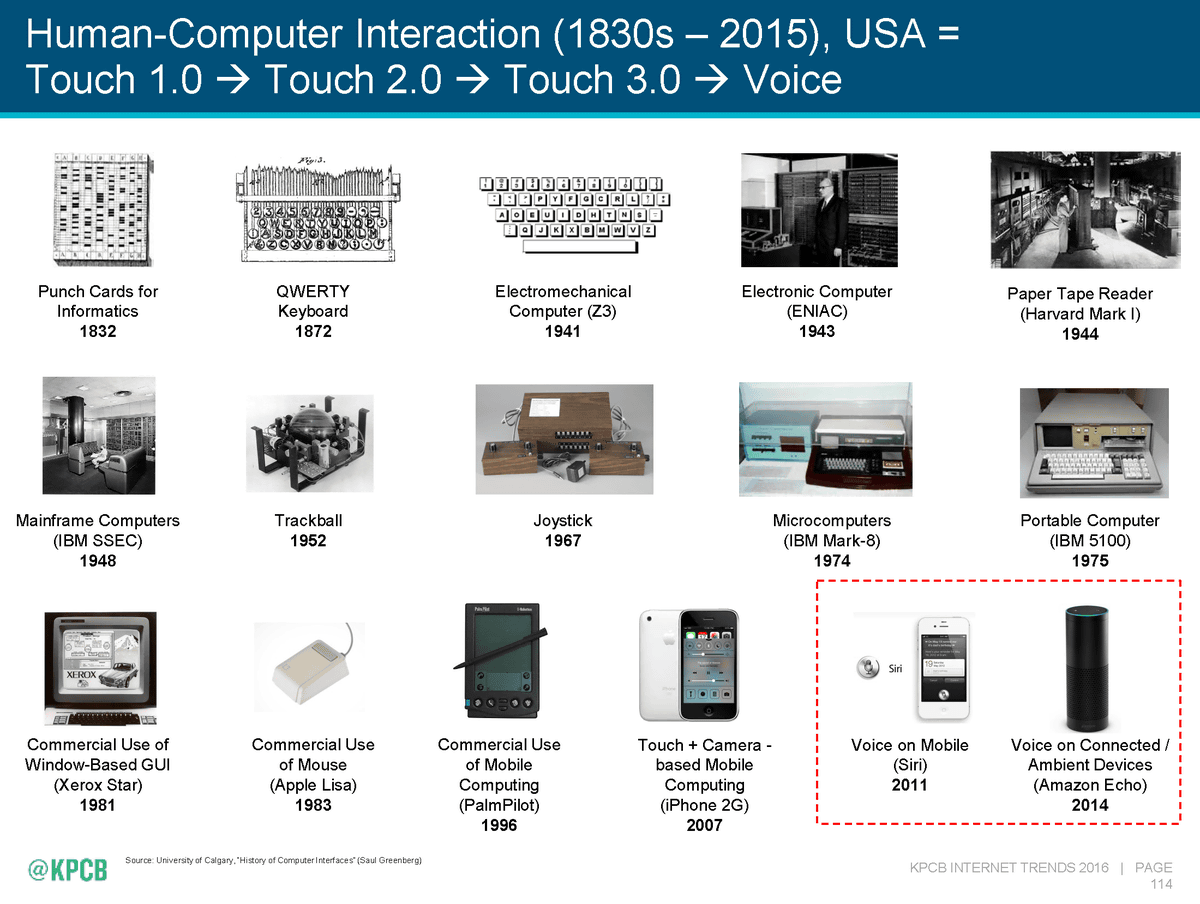
The way to operate the computer has evolved from "Touch 1.0" which operated the keyboard etc. to "Touch 2.0" by the mouse etc, and "Touch 3.0" which directly manipulates the screen, then the voice that came the next The era of "voice command" by.
The accuracy with which the computer recognizes the voice has reached 90% in an environment with low noise, and the number of vocabularies that can be distinguished has dramatically increased.
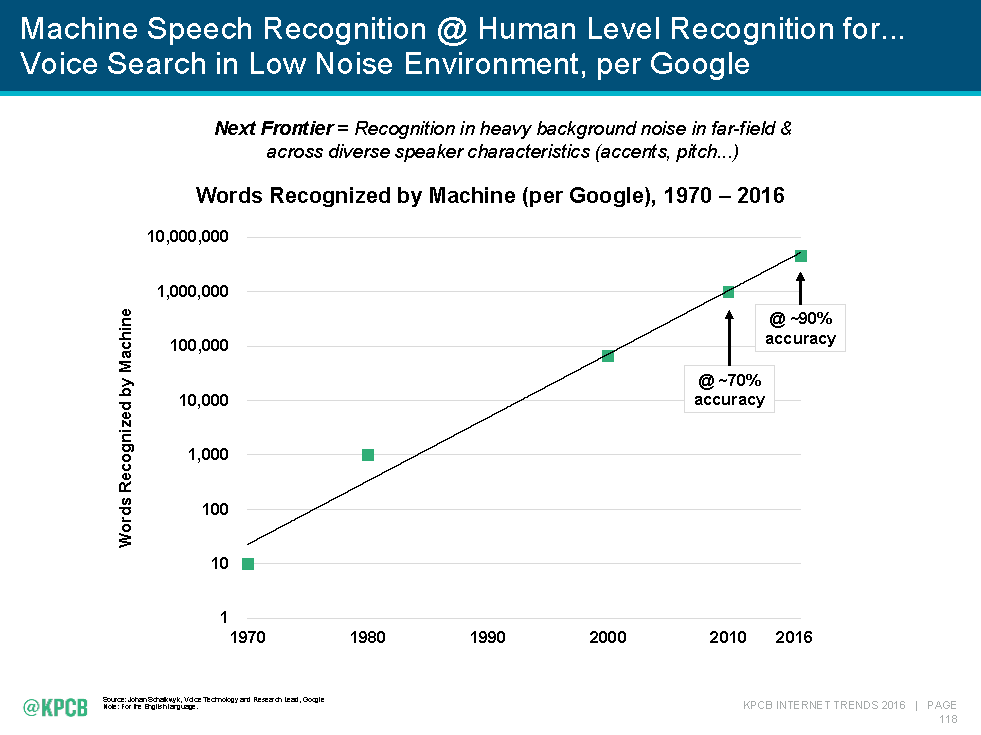
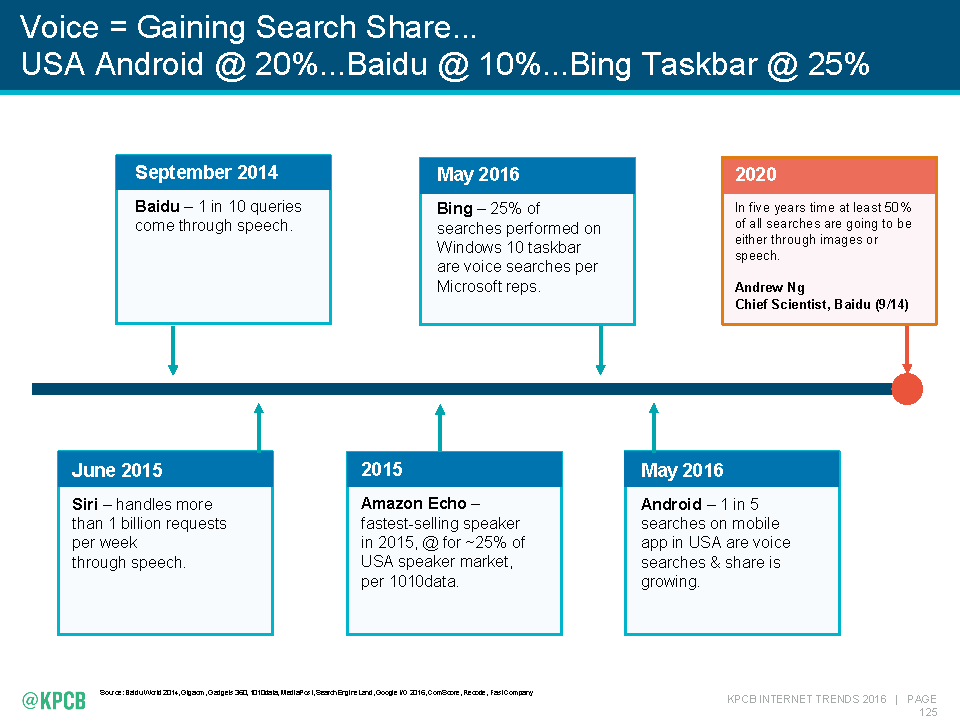
Speech recognition technologies such as Baidu, Google, Hound Voice Search, etc. are also improving accuracy over the years as we follow the years.

Users in the United States who use the voice operation function greatly increased from the 30% level in 2013 to 65% in 2015.

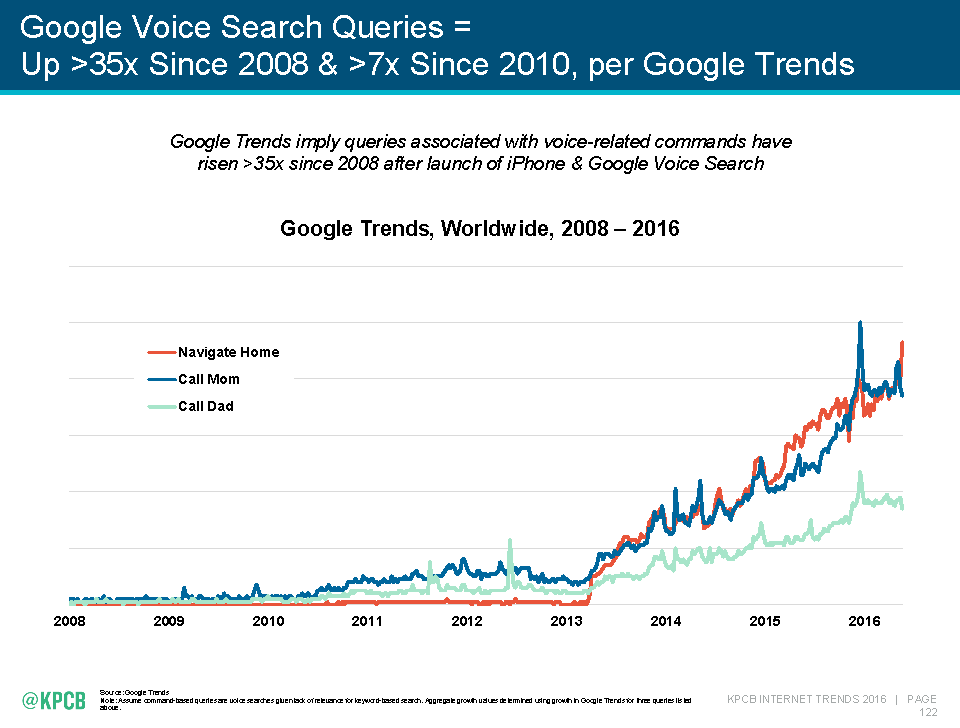
It was said that what greatly increased with the content searched using voice by Google was "Navigating to Home" and "Calling Mommy". Compared with 2008, I know that it was about 35 times more usage.
Even in Baidu, the number of calling APIs (such as speech recognition) to call (= using the function) is about four times that in 2 years.

Such speech retrieval has increased to occupy 10% to 20% of the entire retrieval.
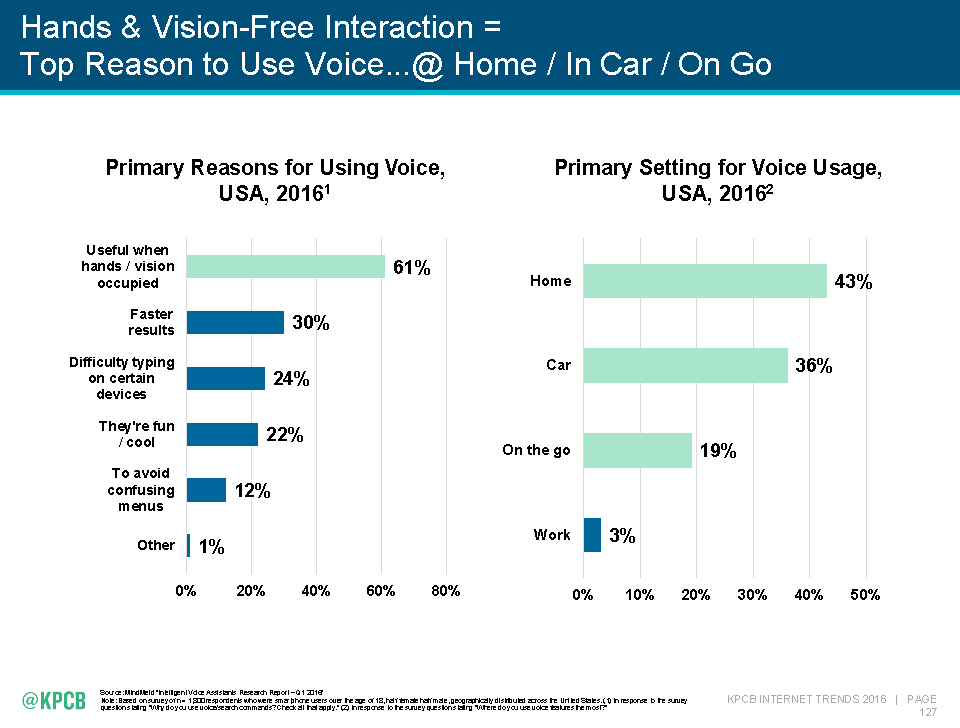
The reason why you use the voice recognition function is when you are occupied with driving, etc., or when you want to operate quickly while moving. Also, it seems that the convenience of returning the answer as cucky rather than operating each time is also the reason for evaluation.
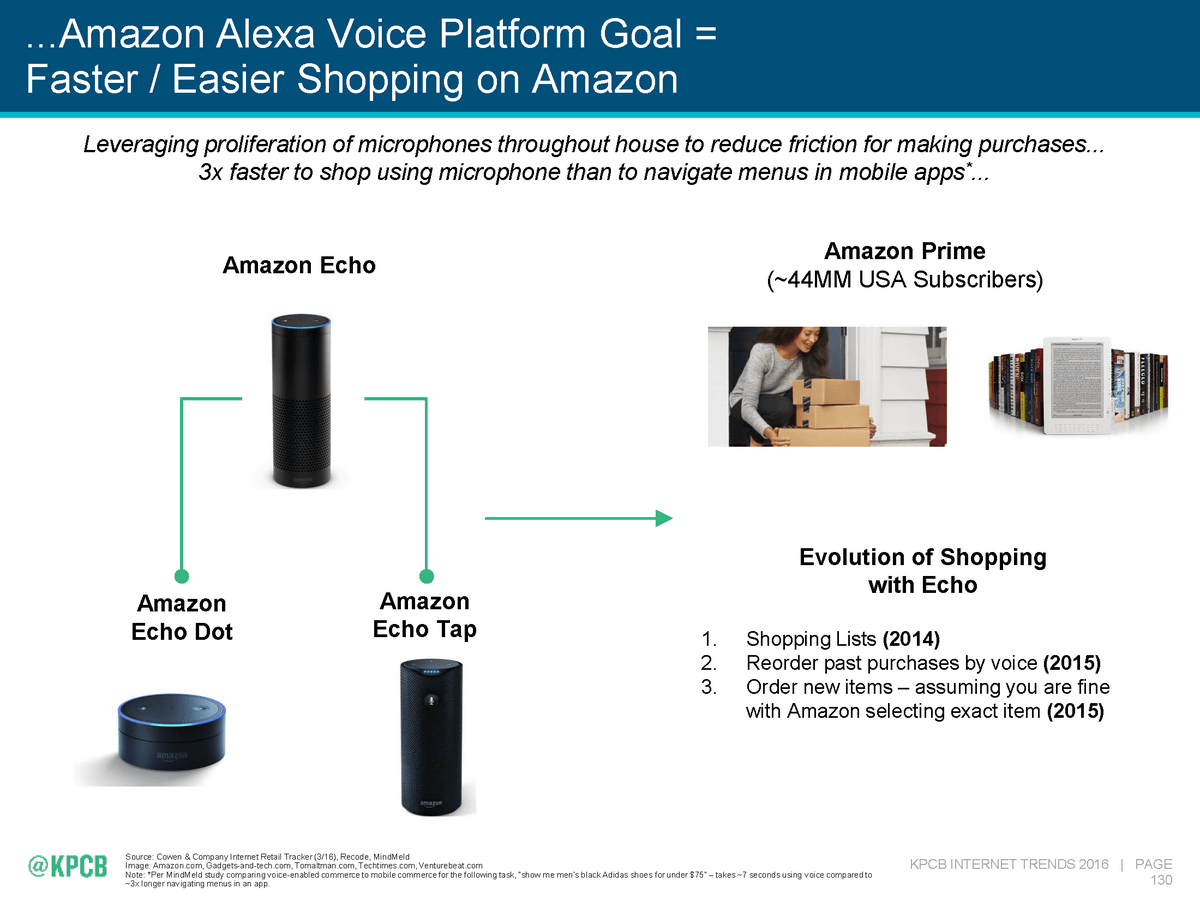
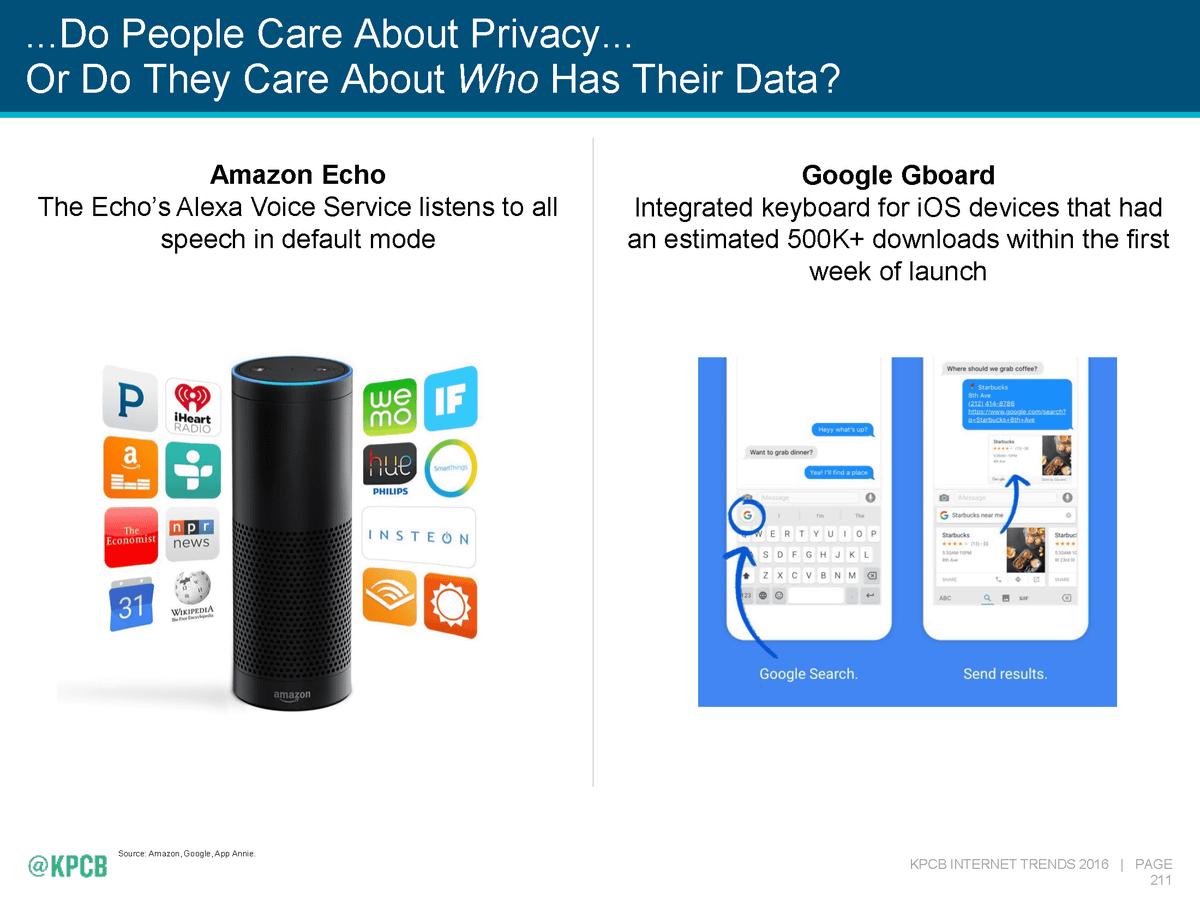
And of course retailers such as Amazon,We are concentrating on the spread of devices that can be ordered by voice. As you can see, this is a speech recognition function that seems not to be widely spread in Japan yet, but in the United States you may be seeing occupying a larger weight than you can imagine.
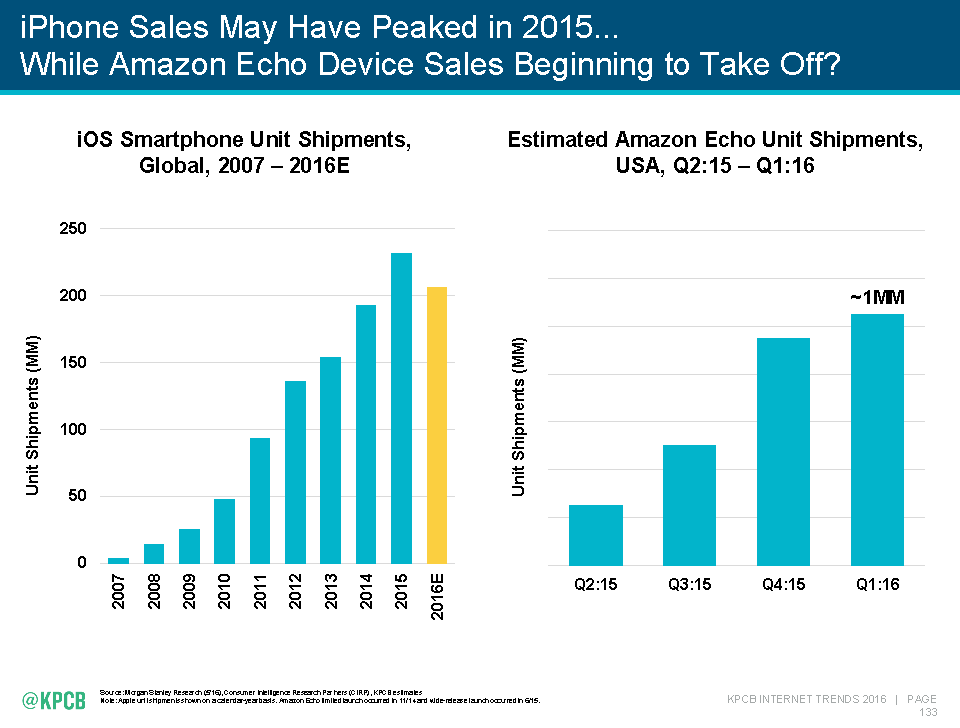
IPhone sales are likely to be peak in 2015, but Amazon's speech recognition device "Echo" is expected to continue growing.
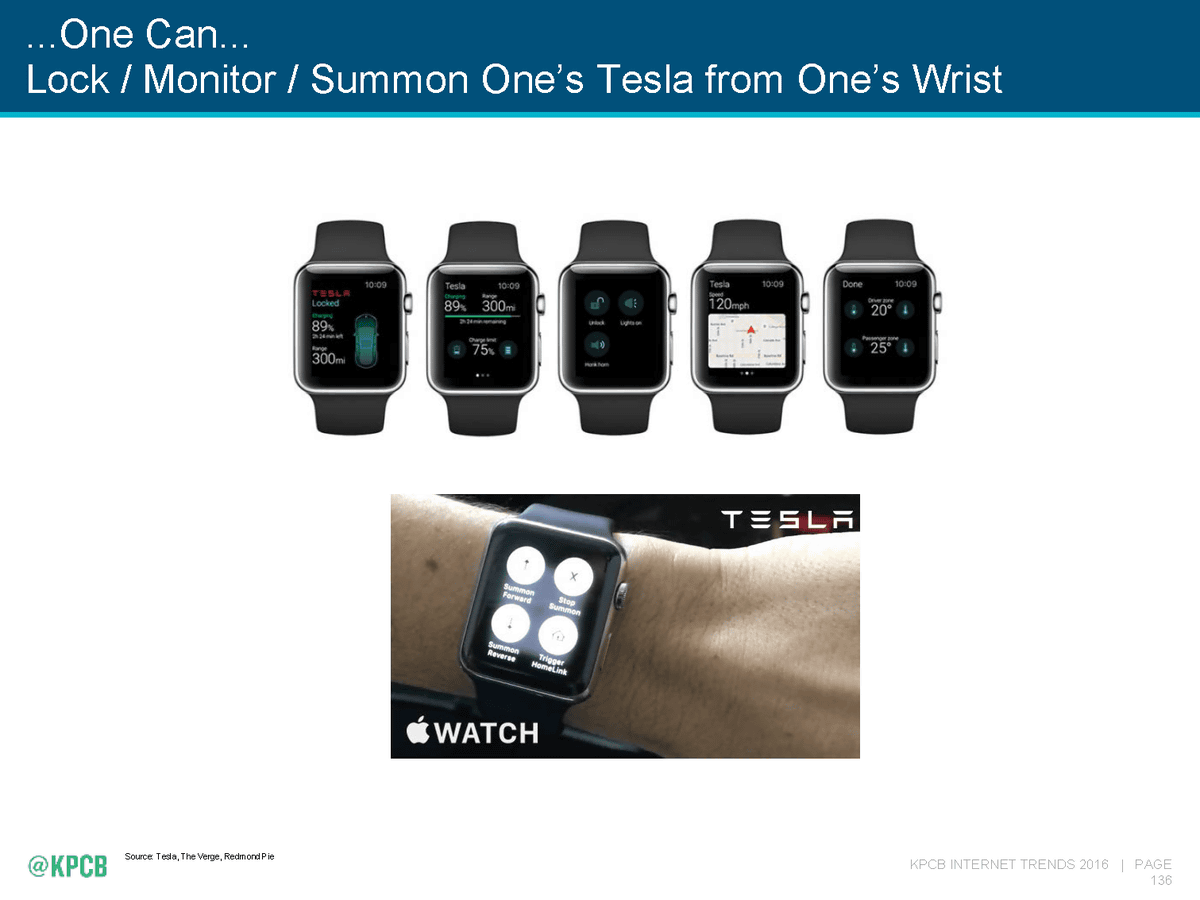
One of the big trends in recent years is "smartization" of various products. Electric vehicles and others are considerably advanced with computer integration and are no longer changing the concept of the "automobile" that is still remarkable.

It has reached an era where it is now possible to operate an electric car with a smart watch and actually run it.
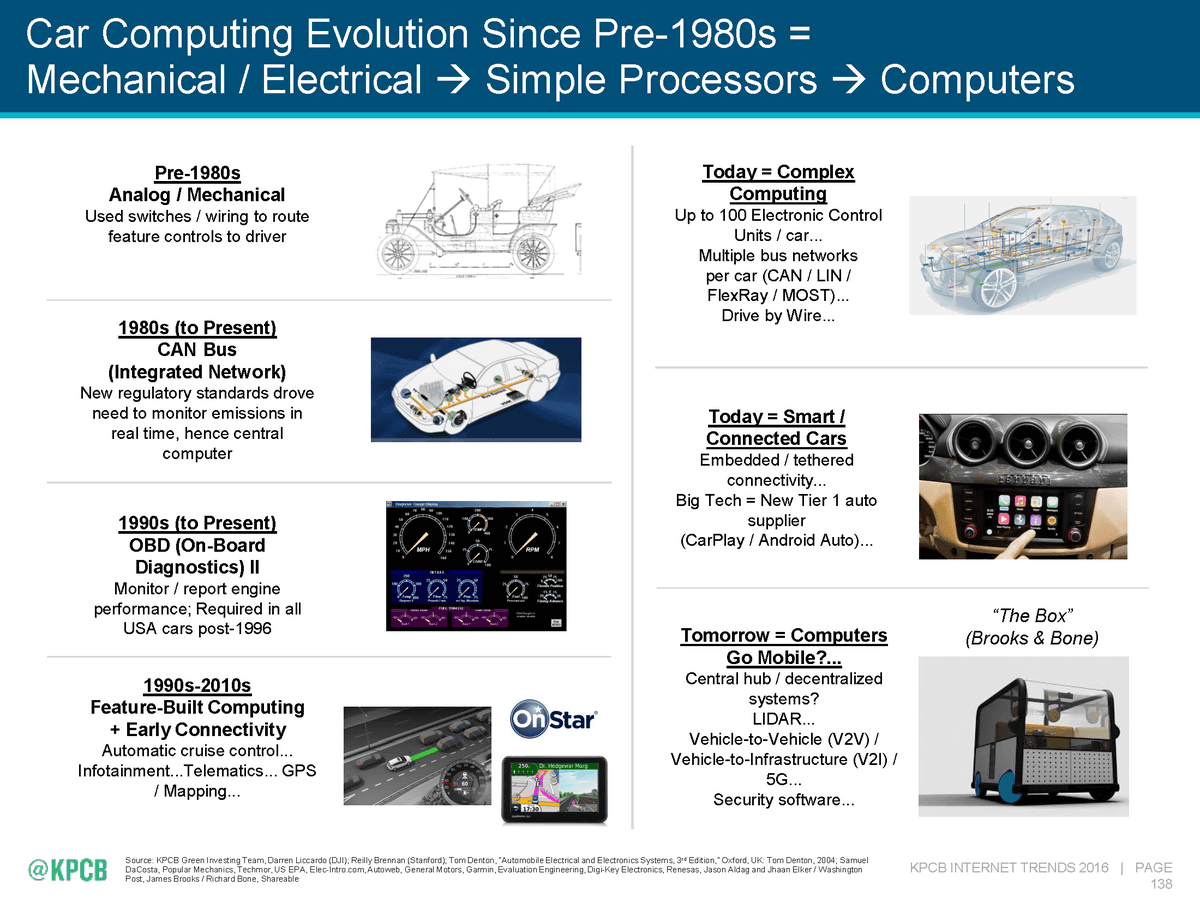
The old car was literally a gathering of machines. In the 1980s, the installation of a system to electronically grasp the state of the vehicle began, and in the 1990s the vehicle diagnostic system which is still used today called "OBD II" is put to practical use. After that the specifications of the computer steadily advanced and now the level that the car can not run without a computer.
We took the viewpoint of "level 4" which allows full automatic operationGoogle's automatic driving carAndTesla which can use semi automatic operation on public roadFunctions accumulate experience in the real world, improvement is done day by day.
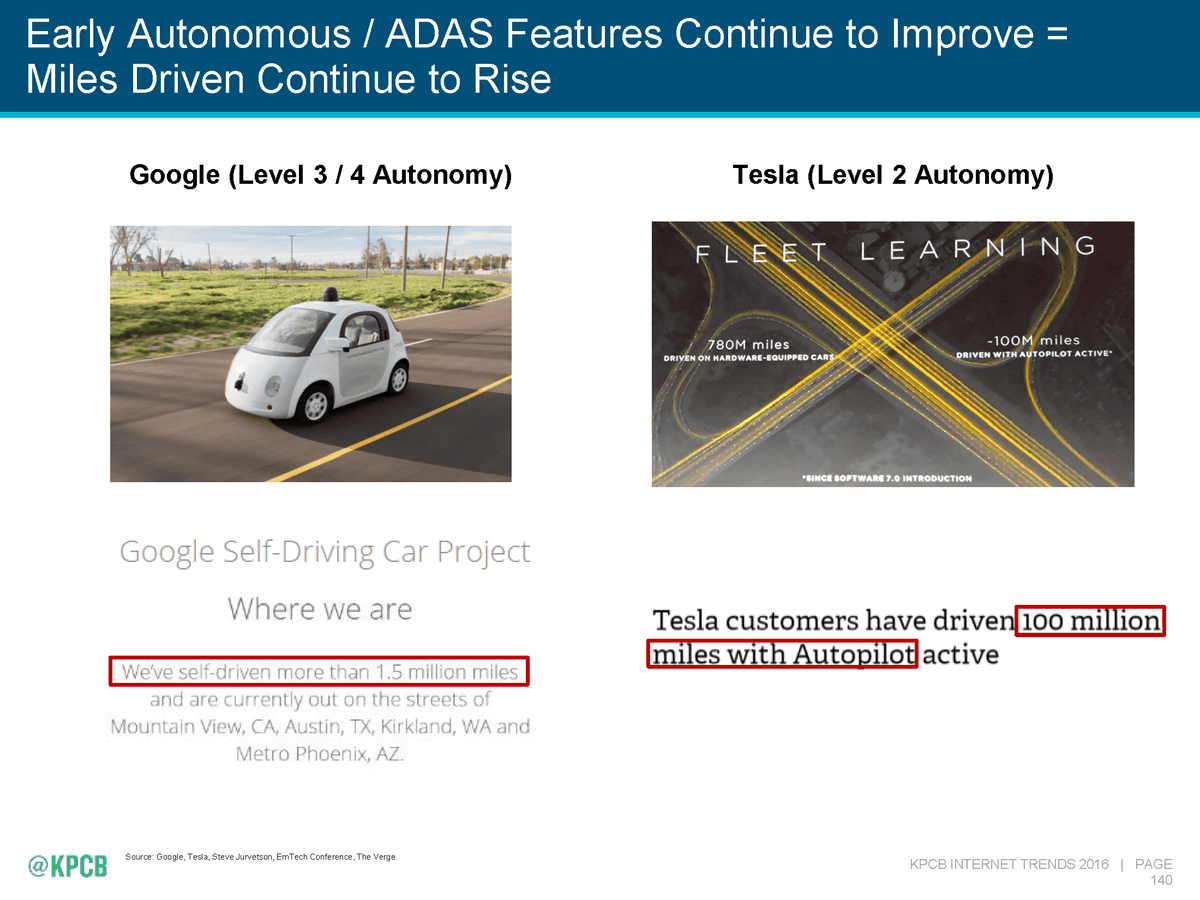
Advances in automotive technology are no longer just for the automotive industry but for the IT industry.
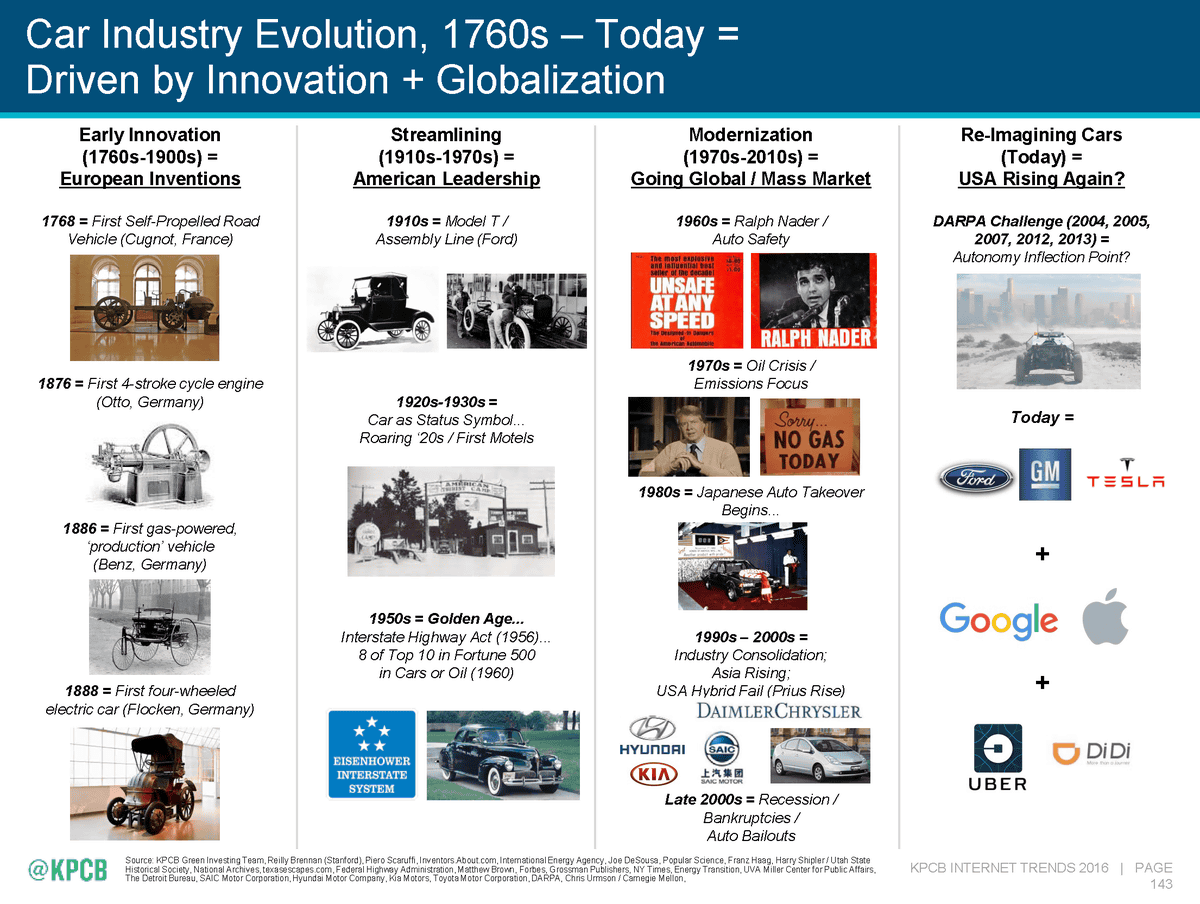
Graphing the scale and share of automobile manufacturing shows that the share of the US (the bottom) is declining and that China (light blue) and other areas (green) are growing big.

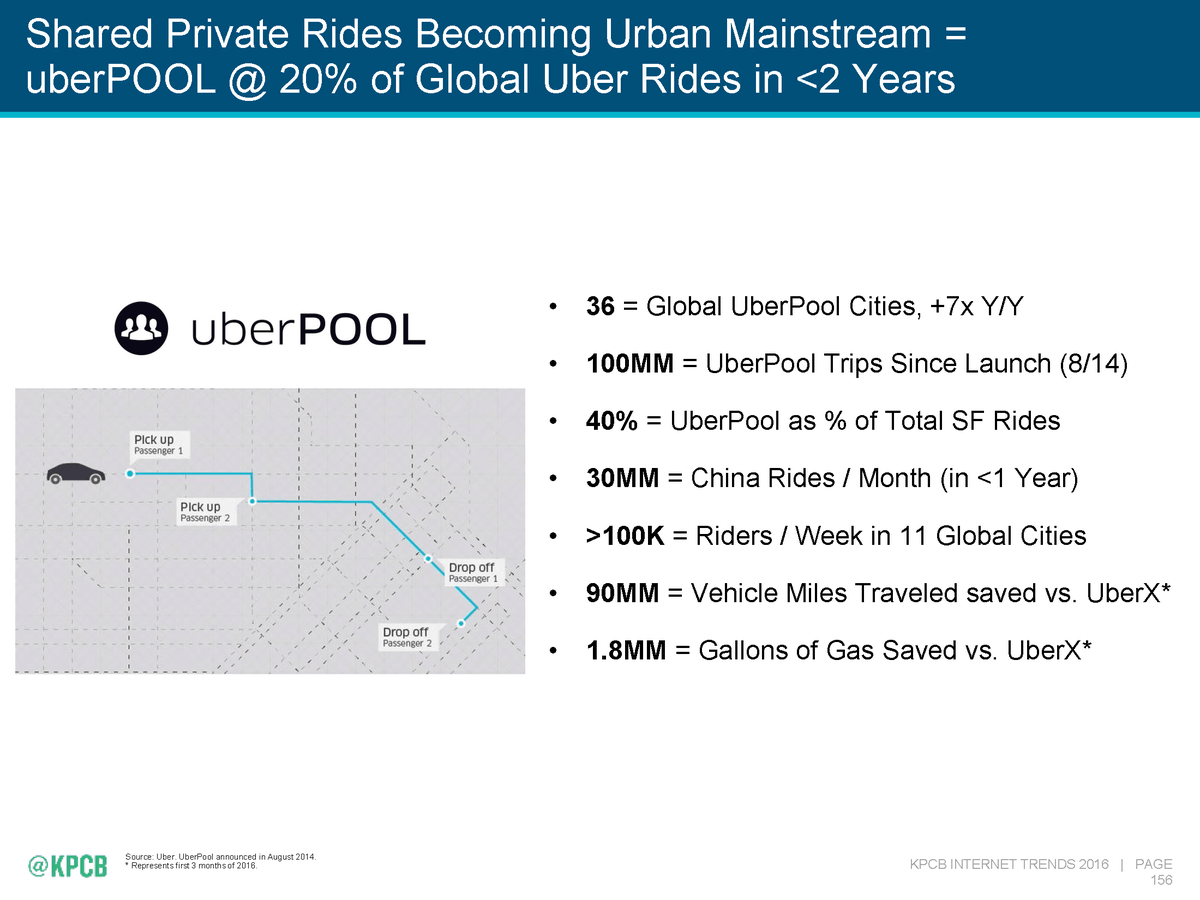
The movement of modern automobiles can be said to be the spread of the concept of "share ride".UberPOOLAs you can see, the way people with cars ride people in their vehicles and share it is getting more attention now.
◆ Meaning and value of data
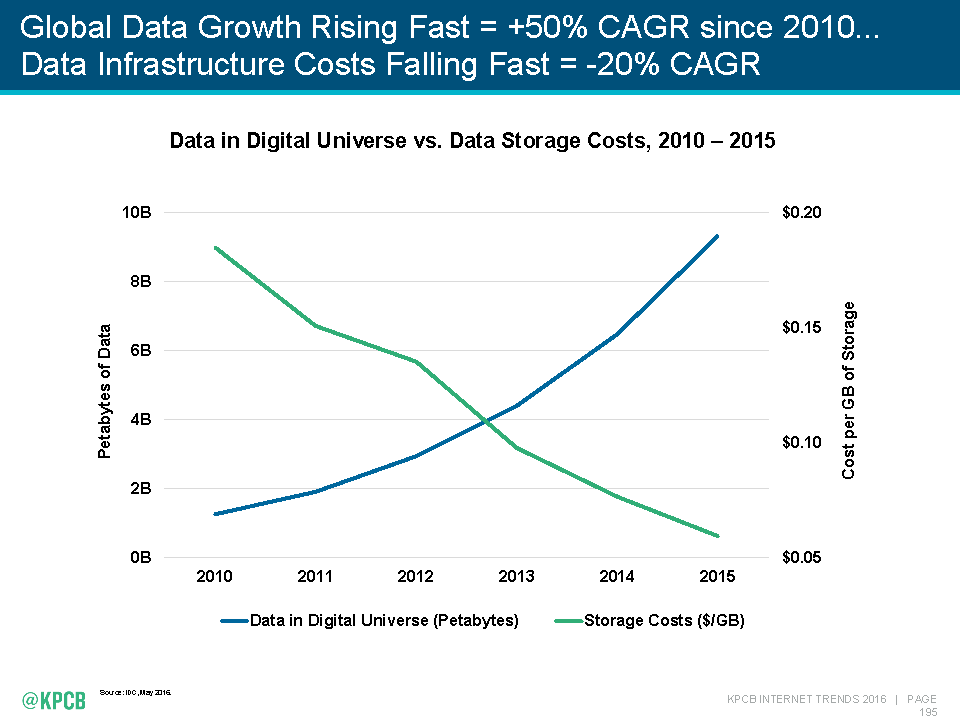
The amount of data in the whole world is steadily increasing, and accompanying it, the cost of storage (storage) continues to decline.
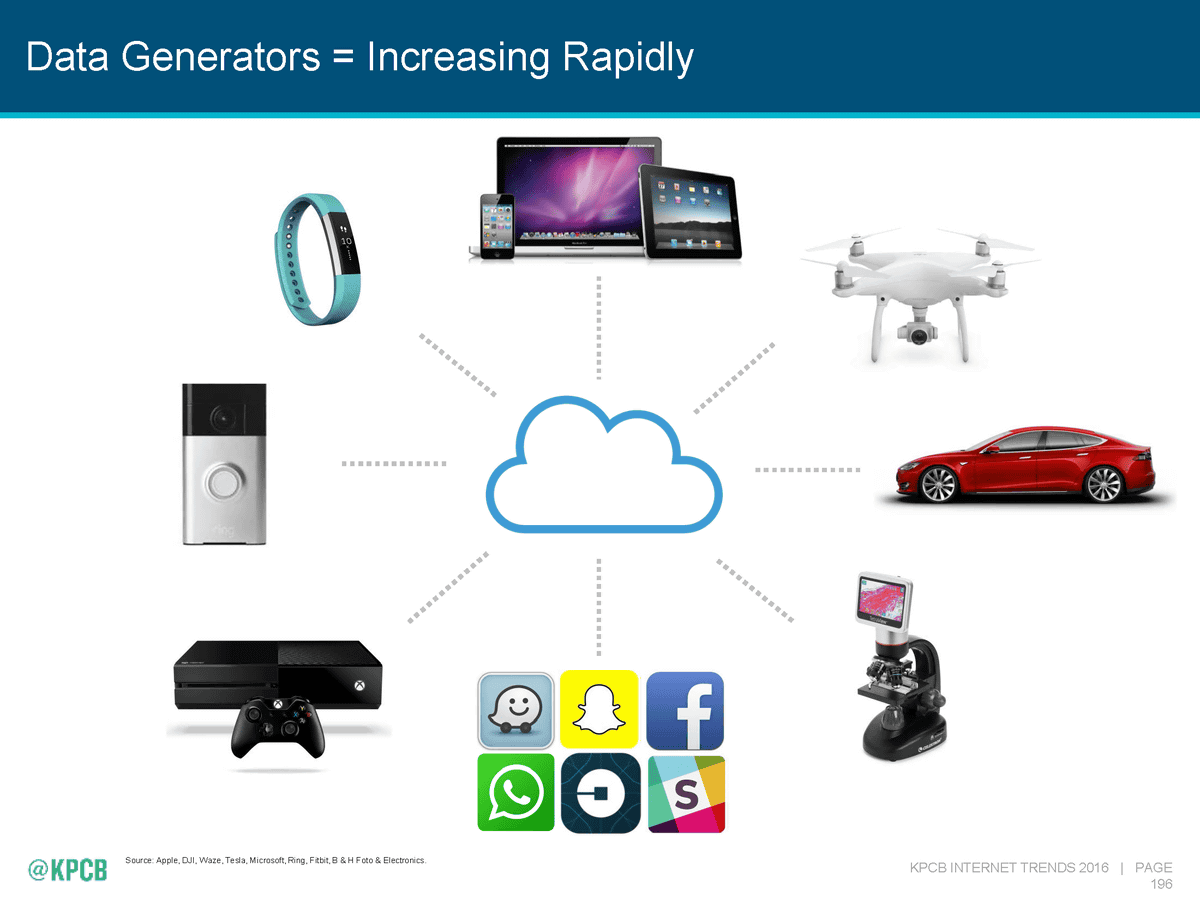
It can be said that all the things now spew data and utilize it.
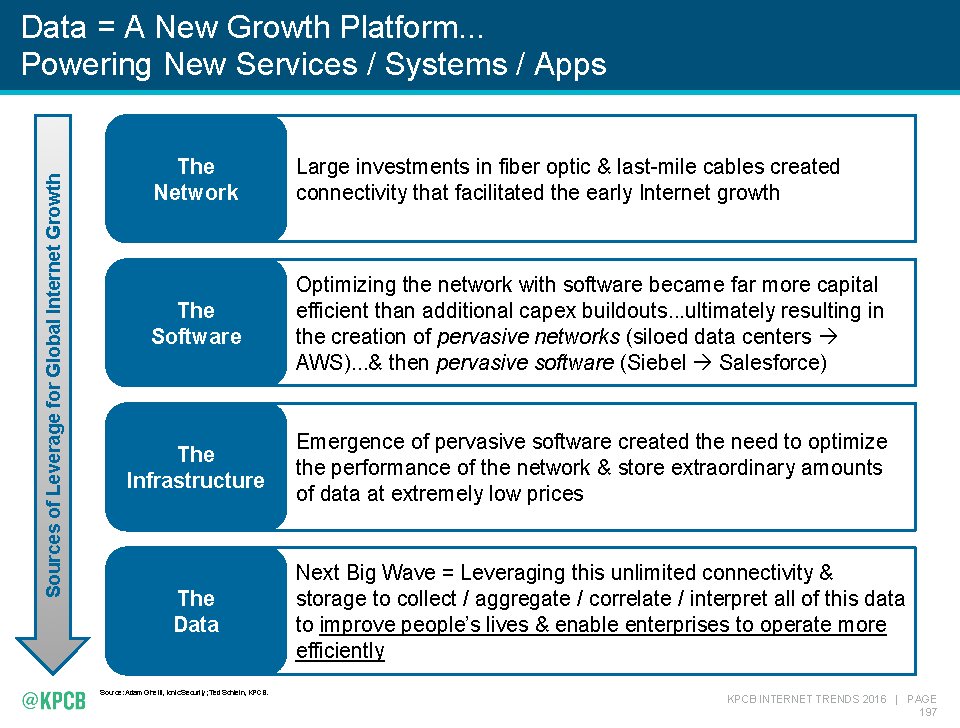
And the data is now a "growth platform". It is used in services, systems, and applications.
The evolution of data seen from the 1990s to 2016 is that the amount of data was limited "The first wave(First Wave) "data whose data has increased sharply"Second wave(Second Wave) ", and intelligence is born from a lot of data"The third wave(Third Wave) "and change.
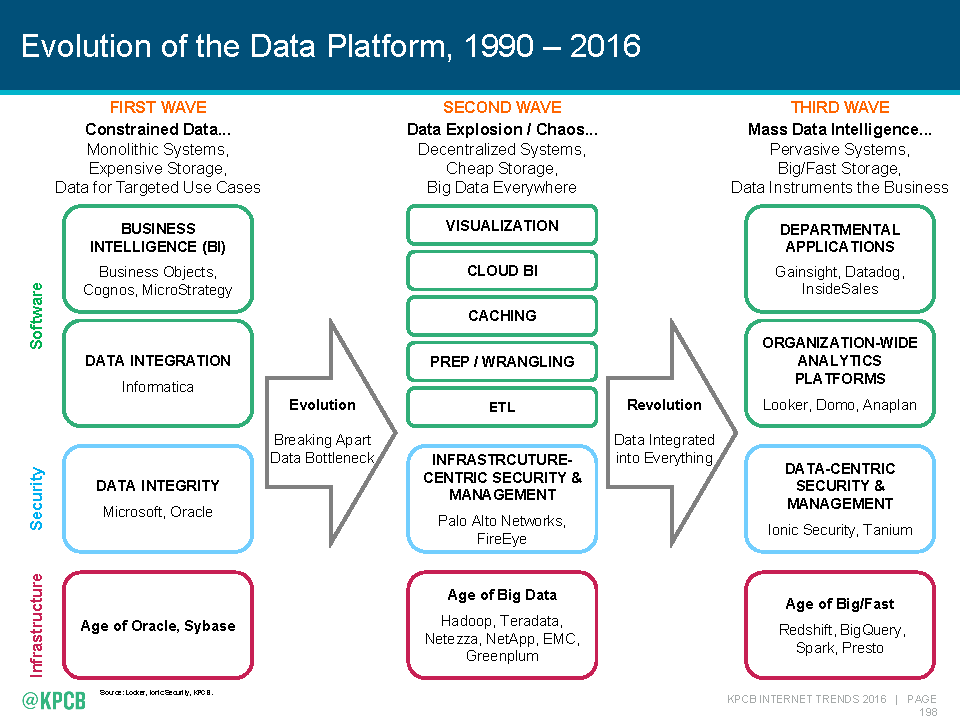
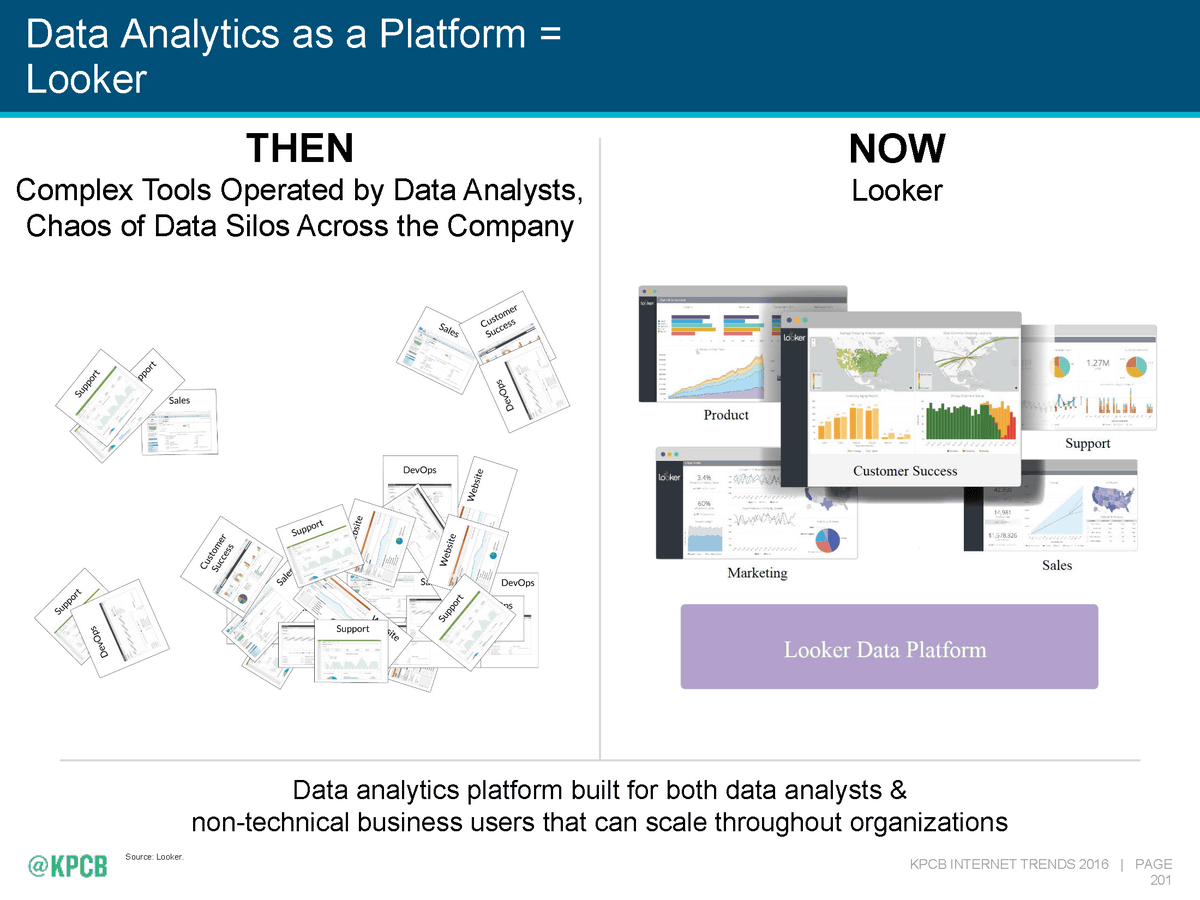
Data analysis is a complex tool that requires expert knowledge as in the past to make data easy to understand by visualizationLooker"Software is changing so that it can be used.
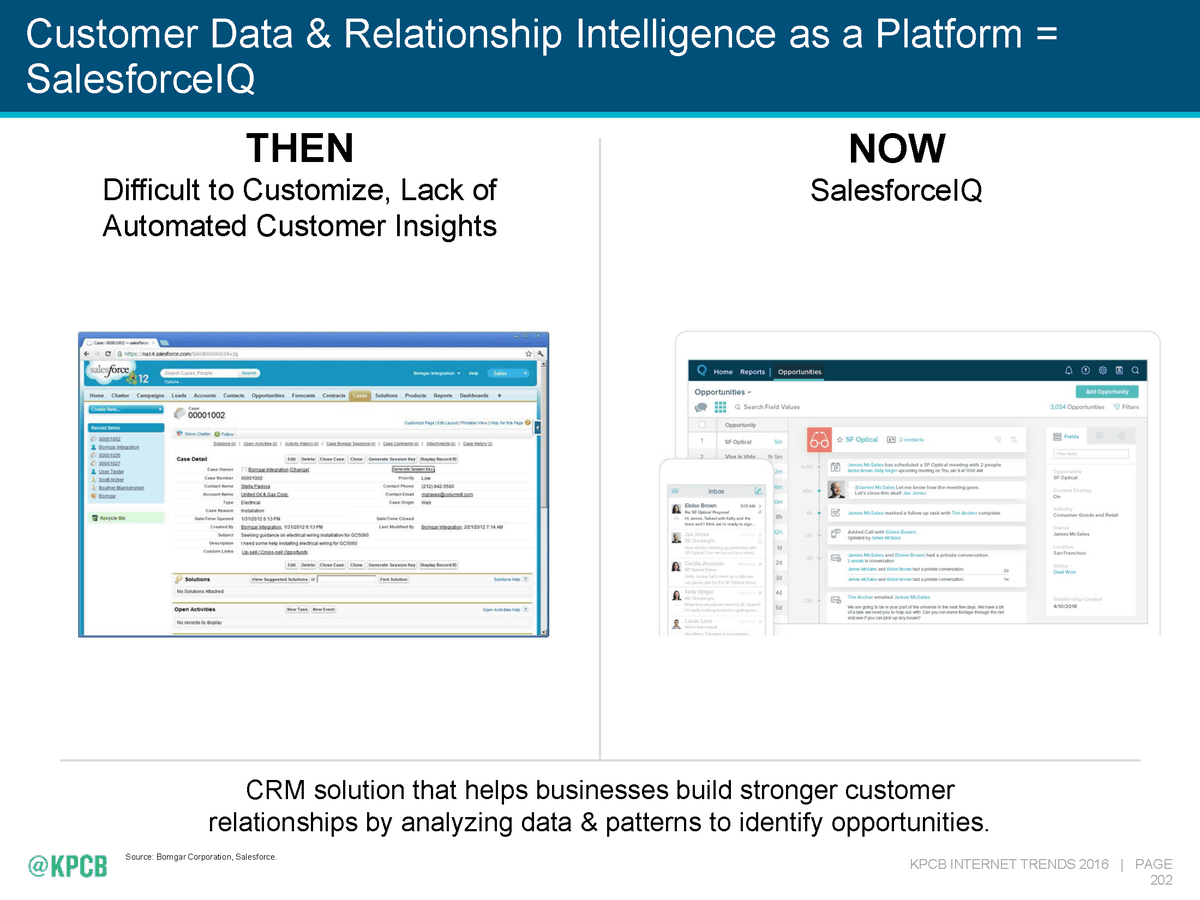
Customer data and relationship intelligence,SalesforceIQManage and manage
When dropping data into the map,MapboxTools are utilized.

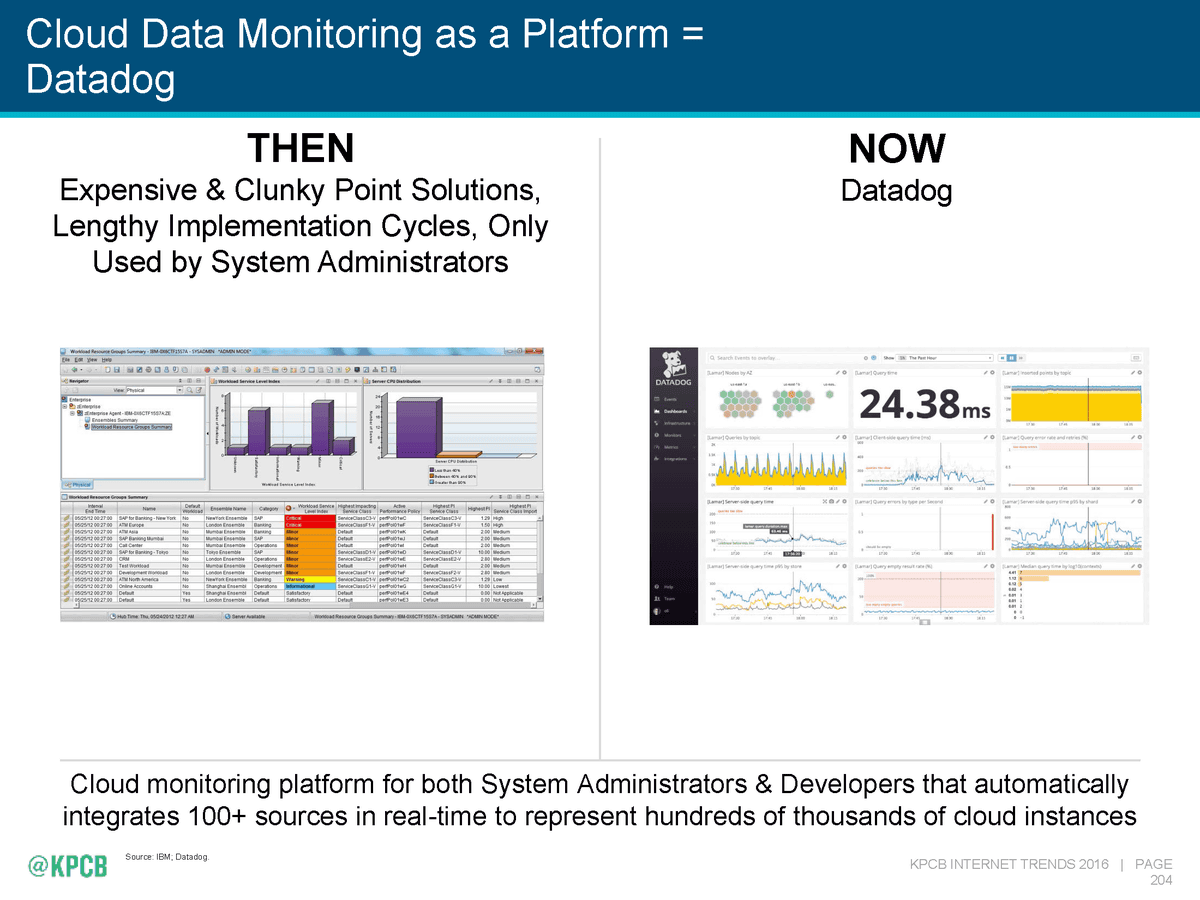
For monitoring cloud data, "Datadog"
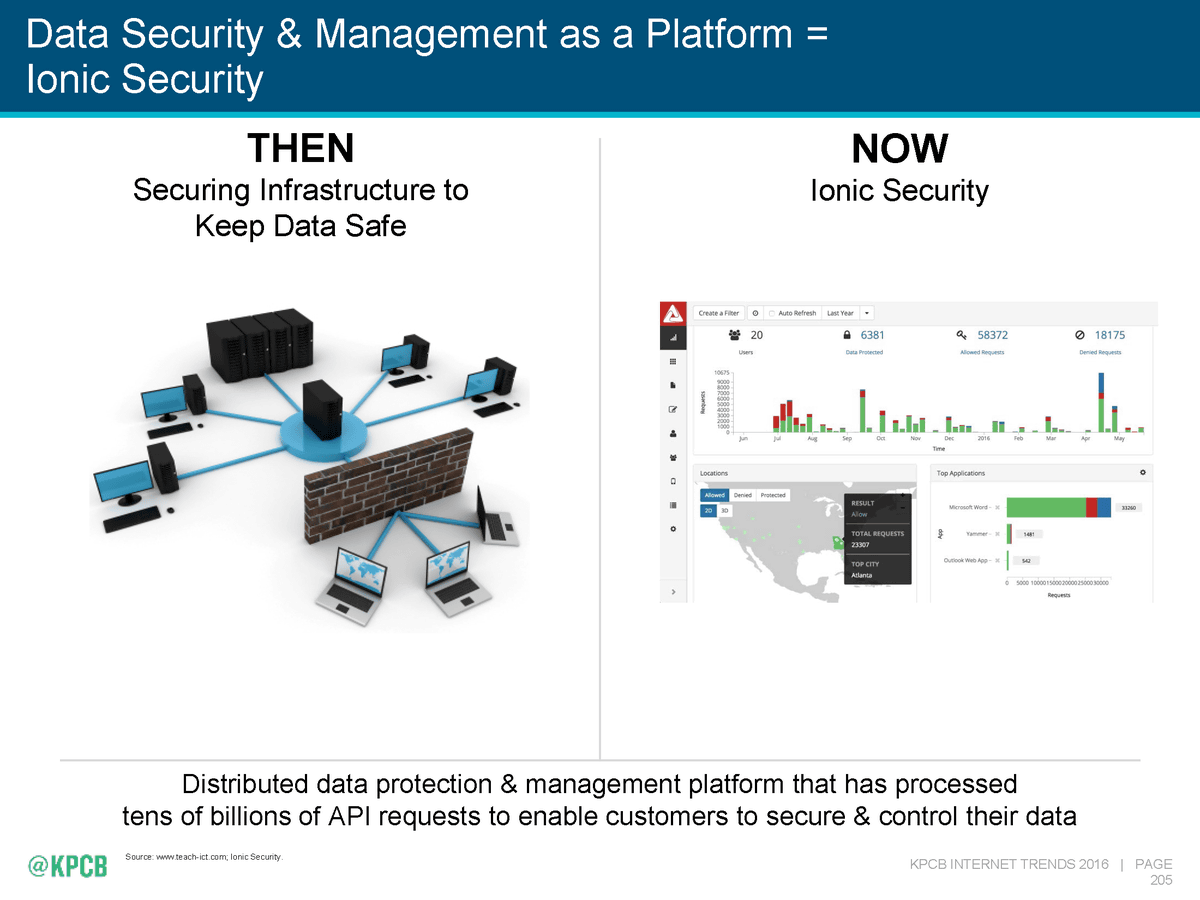
For security management of dataIONIC SECURITYIt is possible to use professional tools such as.
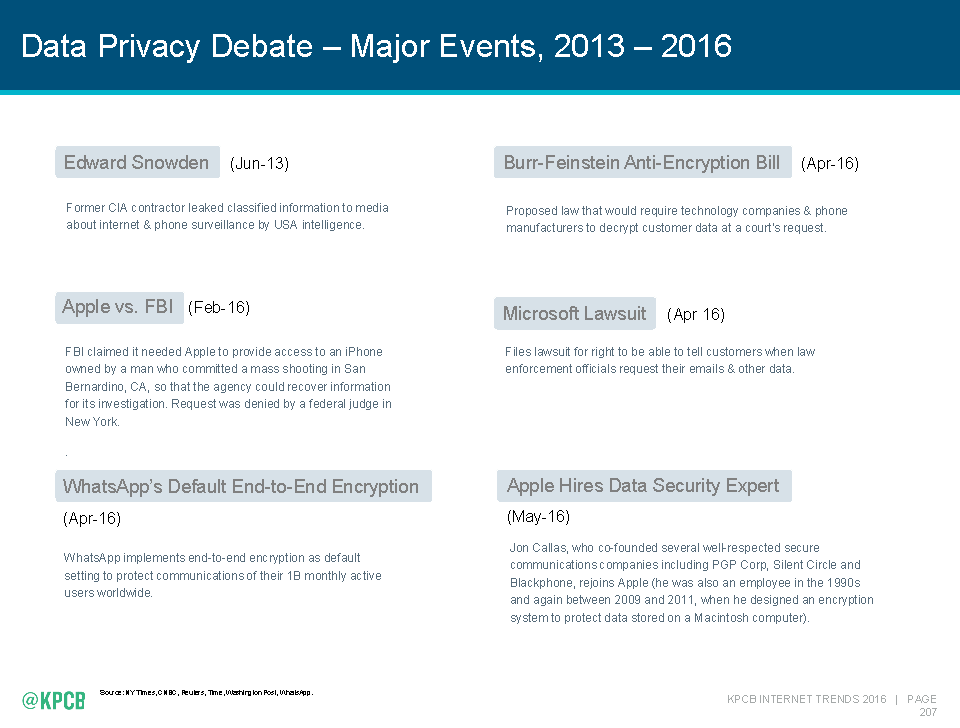
The opportunities for data privacy discussions to take place in recent years have increased.Whether to give priority to personal privacy or social benefit, Problems that can be regarded as an eternal theme are now frequently asked.
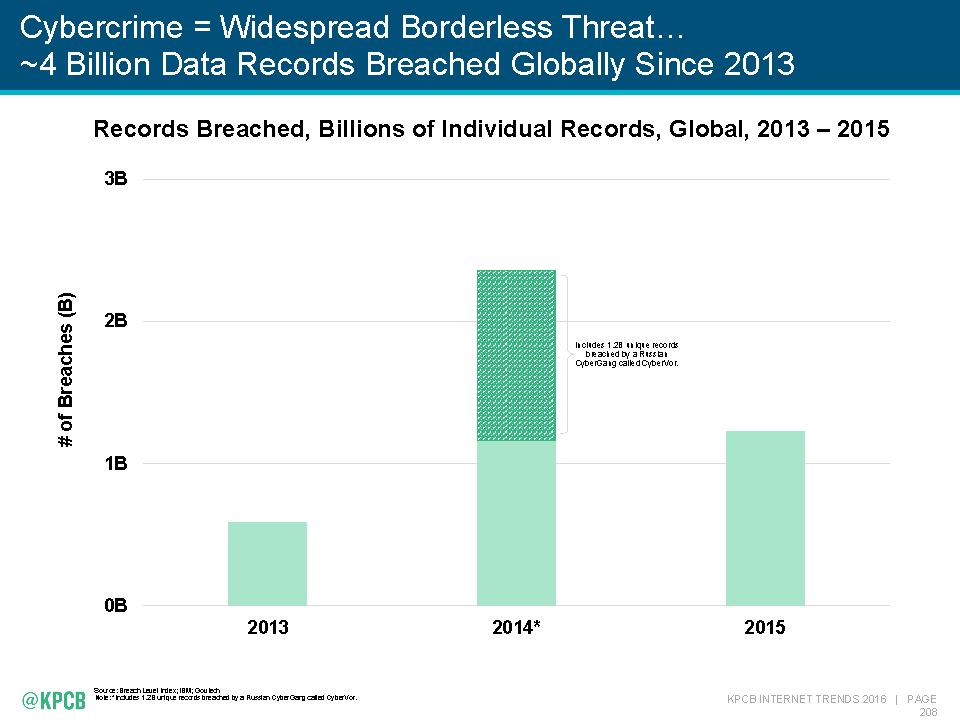
An increase in cybercrime is one of recent trends. After 2013,4 billion data records are leaked due to unauthorized access etc.It is seen.
In response to this situation, consumers are increasingly interested in data privacy, and in a survey also 96% of people show some interest.
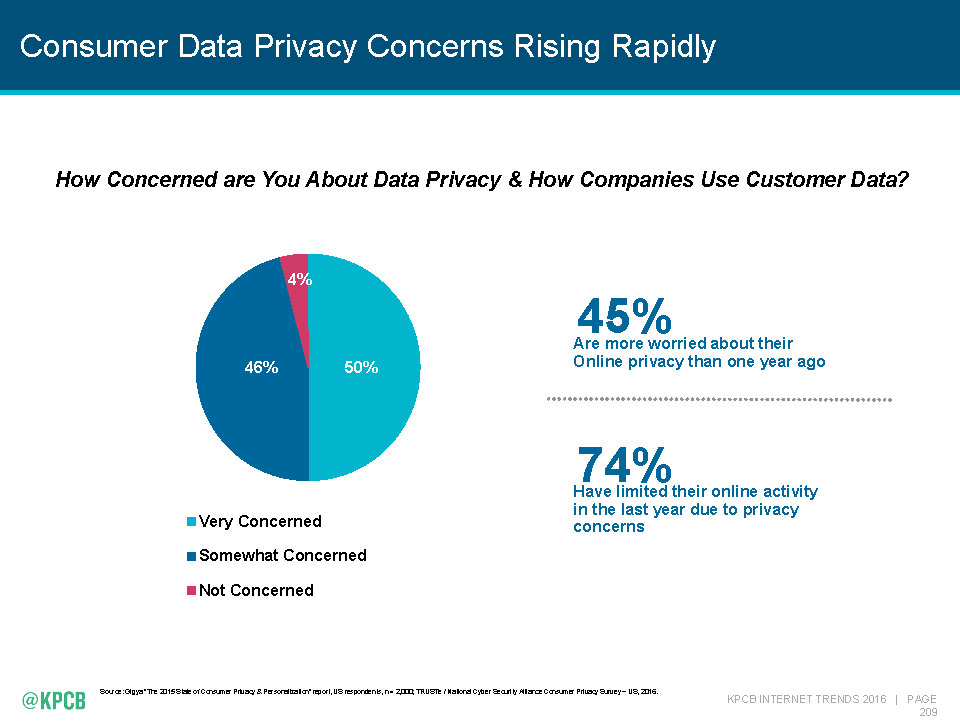
Consumers are especially interested in the question of whether "data is being sold", "where is the data", "how can I identify my individual" Are they kept stored? "

Regarding privacy, it is also important to point out who is acquiring that information. Amazon's speech recognition device "Amazon Echo" monitors all the conversation in the surroundings, and the fact that the contents entered by the smartphone is also transmitted to the cloud for the reason of quality improvement and there is also the actual state that it is utilized There is.
Related Posts:


in Note, Posted by darkhorse_log