Which is more fattening and thinner?

ByPurple flow
Researchers at the Imperial College London in the UK investigated and analyzed about 20 million male and female Body Mass Index (BMI) data in 186 countries worldwide, and found that those who are considered obese at BMI 30 or higher It turned out that the number exceeds the number of people who are BIM 18.5 or less and are considered to be thin type.
Images in Trends in adult body-mass index in 200 countries from 1975 to 2014: a pooled analysis of 1698 population-based measurement studies with 19 · 2 million participants - The Lancet
http://www.thelancet.com/action/showFullTextImages?pii=S0140-6736%2816%2930054-X
The World May Have Too Much Food - Bloomberg
http://www.bloomberg.com/news/articles/2016-03-31/the-world-may-have-too-much-food
More obese people in the world than underweight, says study - BBC News
http://www.bbc.com/news/health-35933691
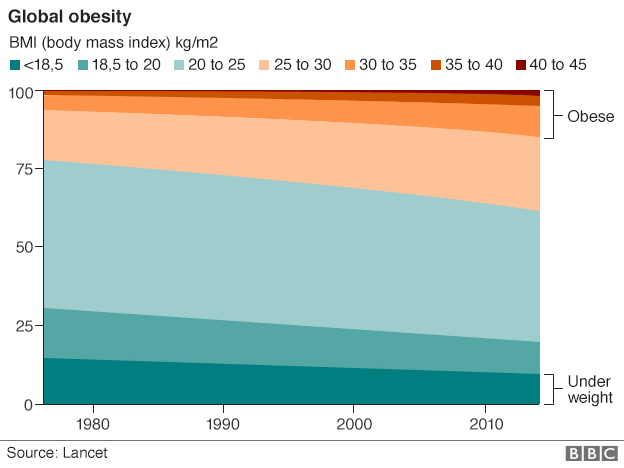
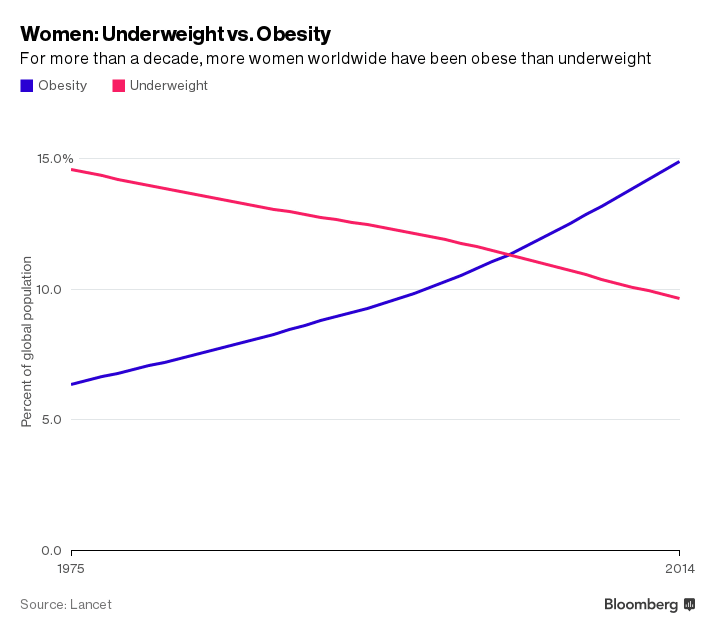
The graph below shows the trends in the percentage of each BMI band from 1975 to 2014. People with BMI less than or equal to 18.5 (Underweight), which is considered lean, have gradually declined since 1975, whereas people with BMI 30 or more (Obese) have more than doubled since 1975 . In concrete figures, people who have BMI 30 or more have increased from 105 million in 1975 to 641 million in 2014.
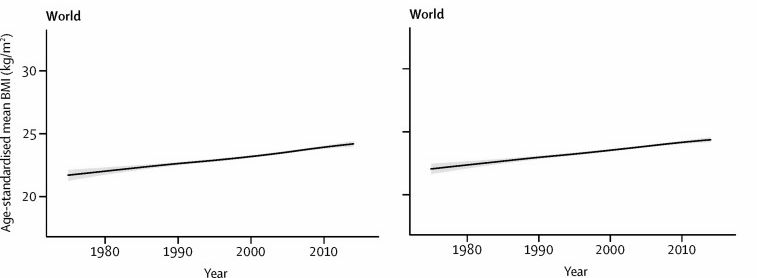
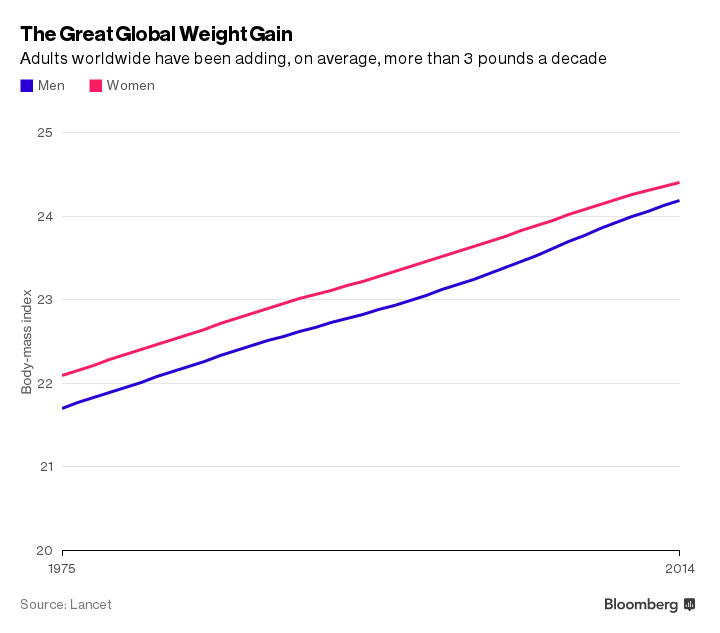
Looking at the trend of the average BMI in the world, you can see that both male (left) women (right) are rising up to around 25.
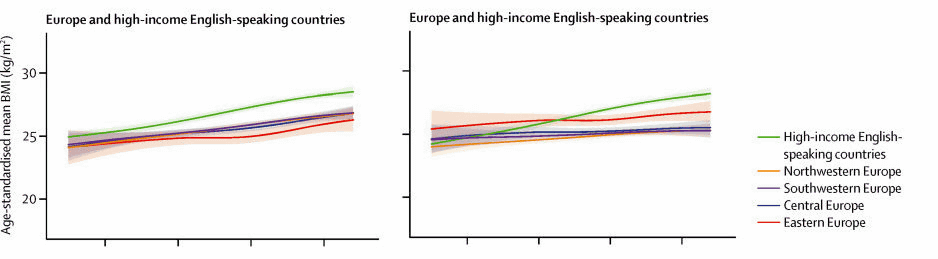
The graph below shows the change in average BMI in European countries and English-speaking countries. Both the man on the left and the woman on the right have a green "high income English speaking country" that includes the United States and Canada is more prominent than the other regions.
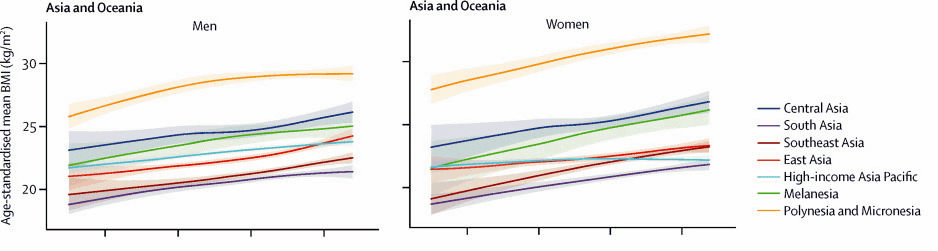
The average BMI change in the Asia-Oceania region is like this. Orange "Polynesia, Micronesia Region" is prominent, but the light blue "high income Asia Pacific countries" including Japan is the third from the bottom, the second from the bottom and the second from the bottom, worldwide It seems that it keeps considerably slim figure even if it sees.
Looking at the trend of BMI in the world by gender, it is a result that both pink women and blue men are rising.
The proportion of female obesity (BMI 30 or more) and lean type (BMI 18.5 or less) as a whole is 15% in lean form and 6% in obesity in 1975, but in 2014 the lean shape is 9.5 The obesity was 15%, the obesity greatly exceeded the thin form.
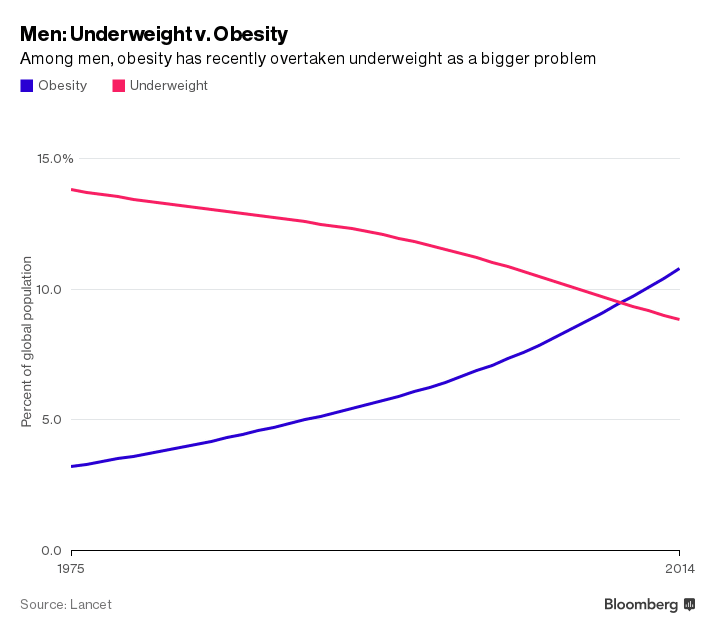
In the case of men, the obesity is 11% and the thin shape is 8% in 2014, and the difference between obesity and lean shape is not as open as women are.
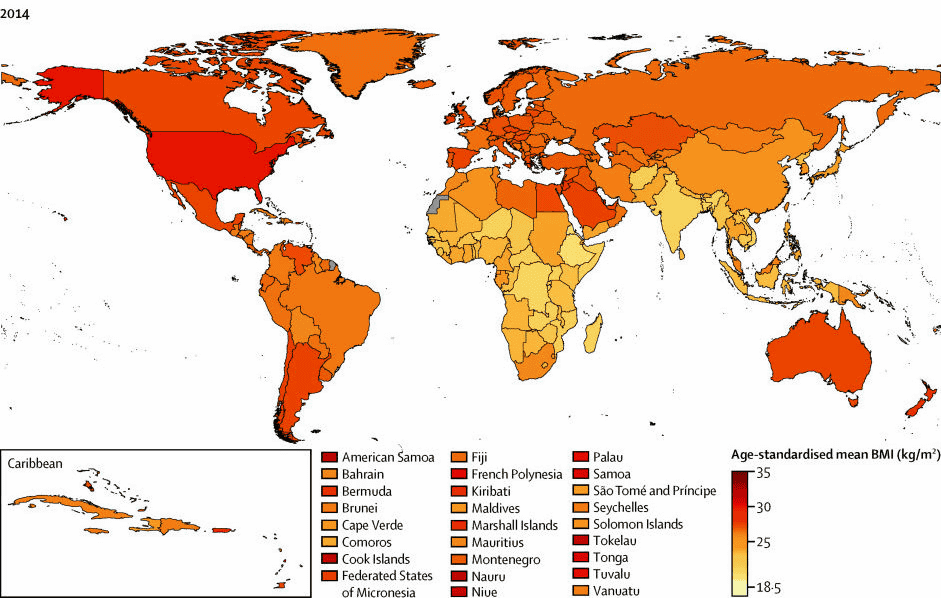
This is a diagram showing the world's average BMI in 1975 for each country. Most ornamental countries with BMI 25 are mostly, and other countries are less than 25 ... ...
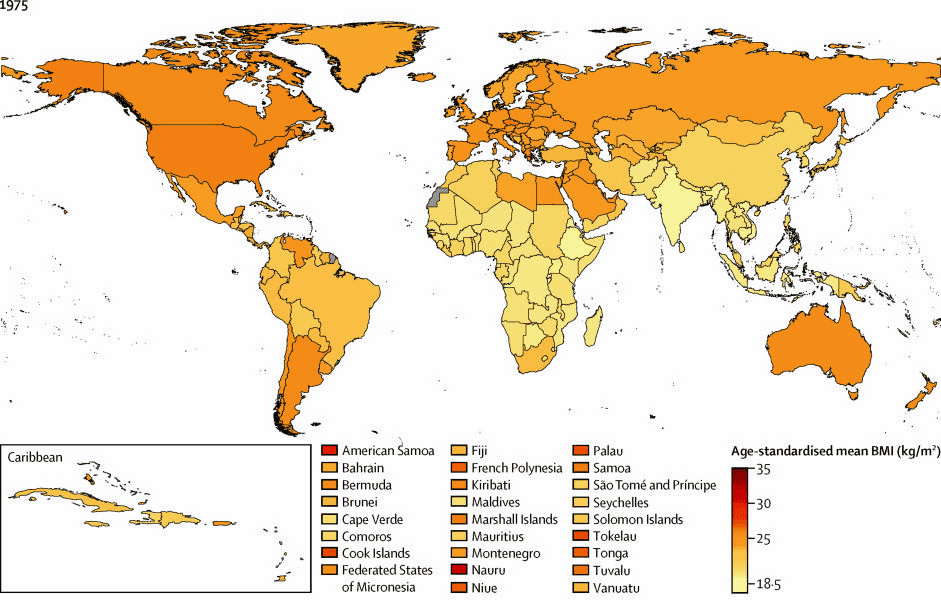
As you can see in the year 2014 the color of the map gets darker overall, and more than 30 countries are increasing from the second half of BMI 20. According to the survey, the majority of obesity is China and the United States.
According to the survey results, Professor Magid Ezuati at Imperial College London said, "Severe obesity is prevalent.In spite of the fact that low body weight was more than twice that of obesity, over 40 years obesity is lower than low body weight We are hoping that the result of this time will be responsibility of the government from individual responsibility to obesity and take some responses. "
Related Posts:


in Note, Posted by darkhorse_log