When comparing the evolution of 10 years of Intel CPU thoroughly by numerical value
Intel, the world's largest semiconductor maker, has acquired an overwhelming share of over 80% for PC CPUs, and the evolution of Intel's technology is not an exaggeration to say that CPU evolution. To comprehend the performance of Intel CPU thoroughly in order to know the evolution of such CPU for the most recent 10 years it becomes like this.
Then and Now: Almost 10 Years of Intel CPUs Compared - TechSpot
http://www.techspot.com/article/1039-ten-years-intel-cpu-compared/
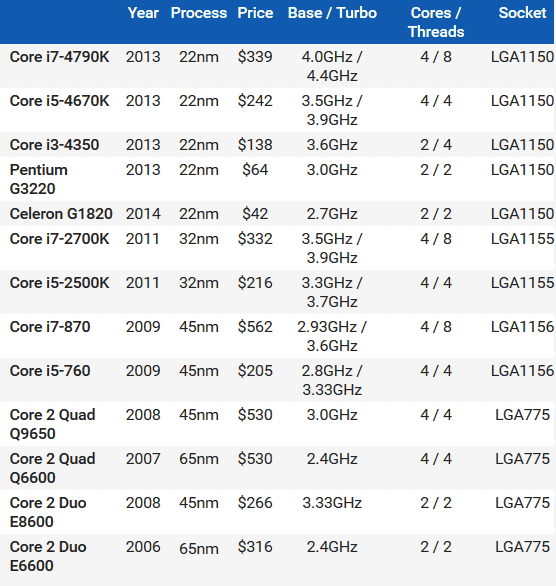
TechSpotIn order to thoroughly compare the performance of the Intel CPU in the last 10 years, in total 13 types of "Core 2 Duo E 6600" released in 2006 to "Core i 7 - 4790 K" of the 4th generation Intel Core processor I thoroughly compared the CPU. In the previous modelSandy BridgeThird generation Intel Core processor which did not have significant performance improvement from "Ivy BridgeSeries and the 5th generation Intel Core processor that was released soonBroadwellThe series is excluded.
The parts configuration other than the CPU used to measure the benchmark is as follows.
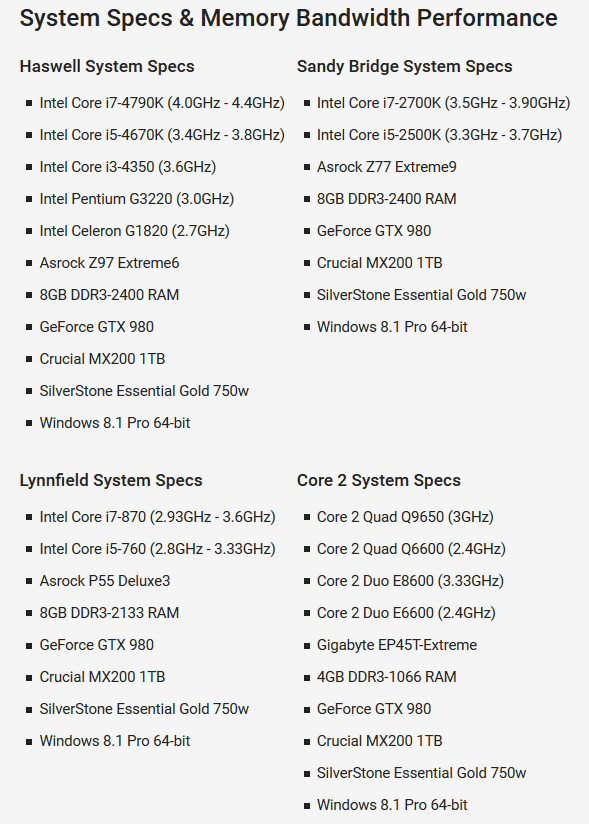
◆ Benchmark software
· Sandra 2015
SiSoftware Sandra 2015Comparing the memory bandwidth with this is like this. The larger the graph value, the faster the data transfer rate. In addition, some CPUs manufactured by AMD are listed as comparison targets.
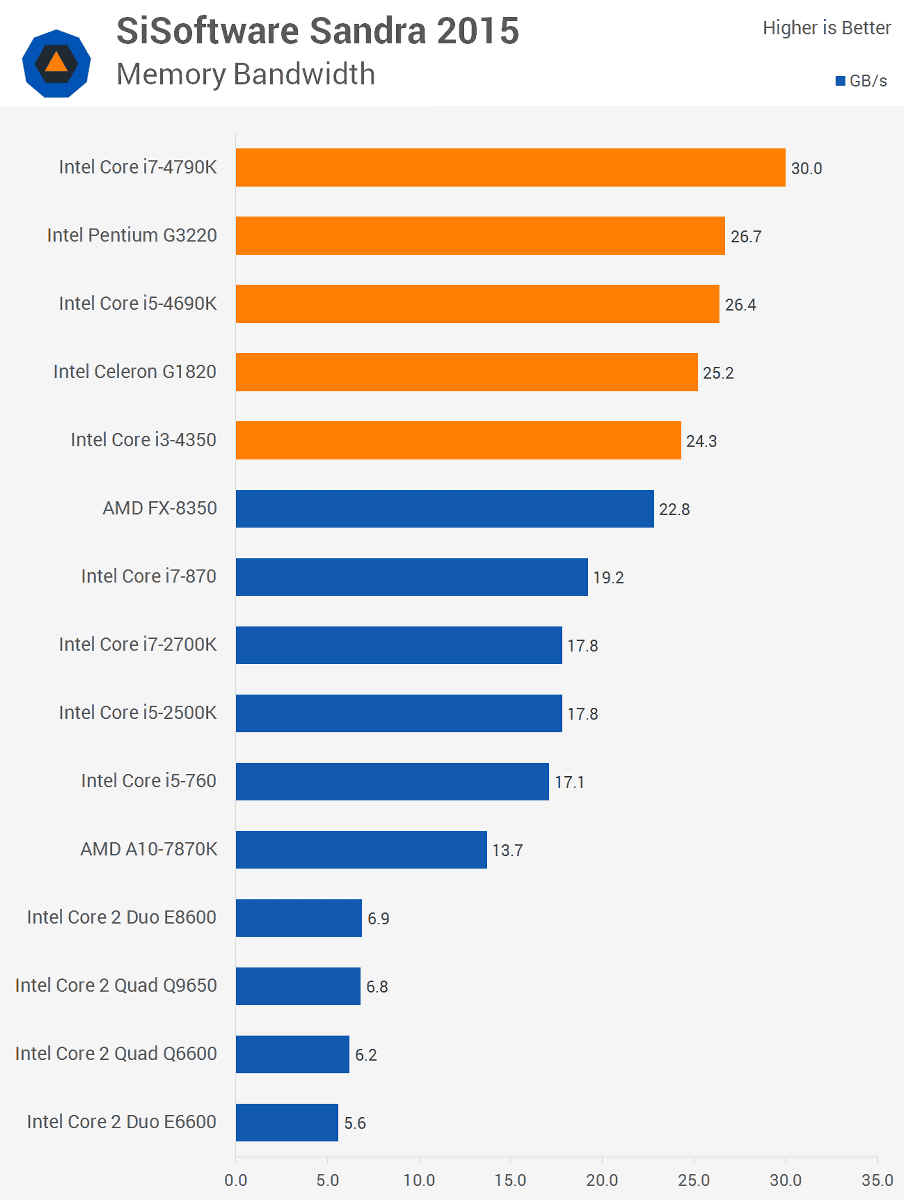
From the graph above, you can see that the memory transfer speed has dramatically improved since the Core i series, whereas it was struggling to exceed 7 GB / s in the Core 2 era.
· Cinebench
Benchmark softwareCinebenchIt is like this when comparing CPU performance using. In the graph, the upper row shows multithreading performance and the lower row shows single thread performance, and the larger the number, the higher the performance.
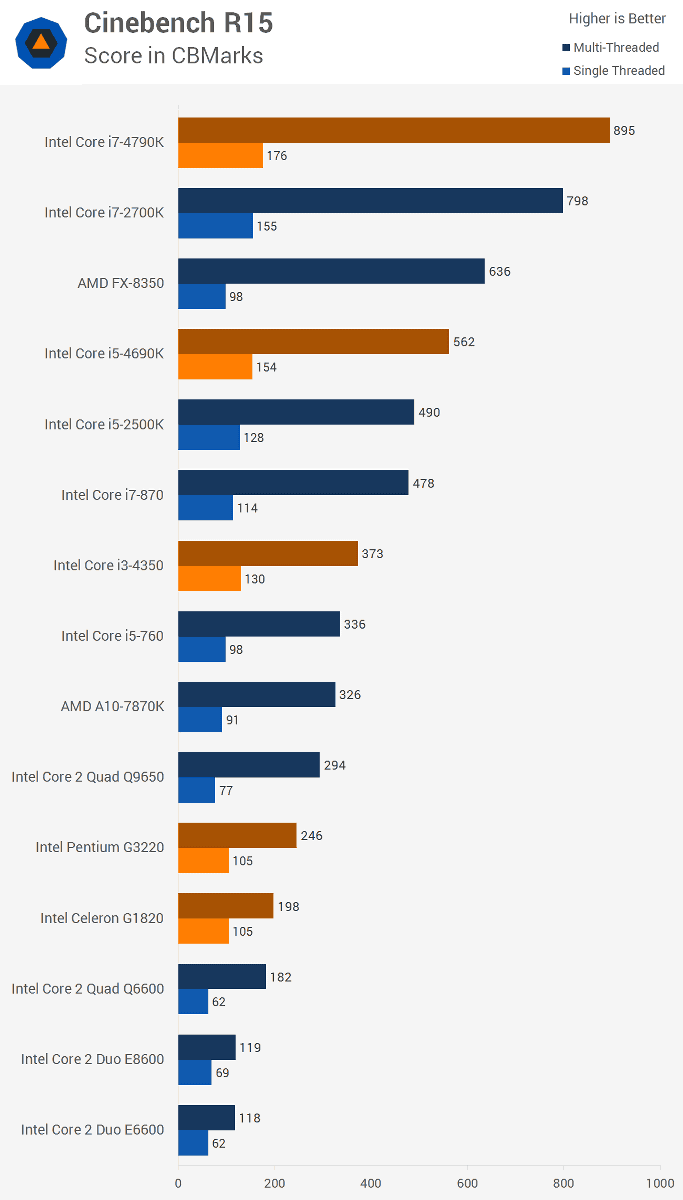
Comparing Core i7-4790K and Core 2 Quad Q 9650, single thread performance is about twice as fast, while multithread performance is about three times faster, as is clear from the single thread performance It can be seen that multithreading performance is improved more than that.
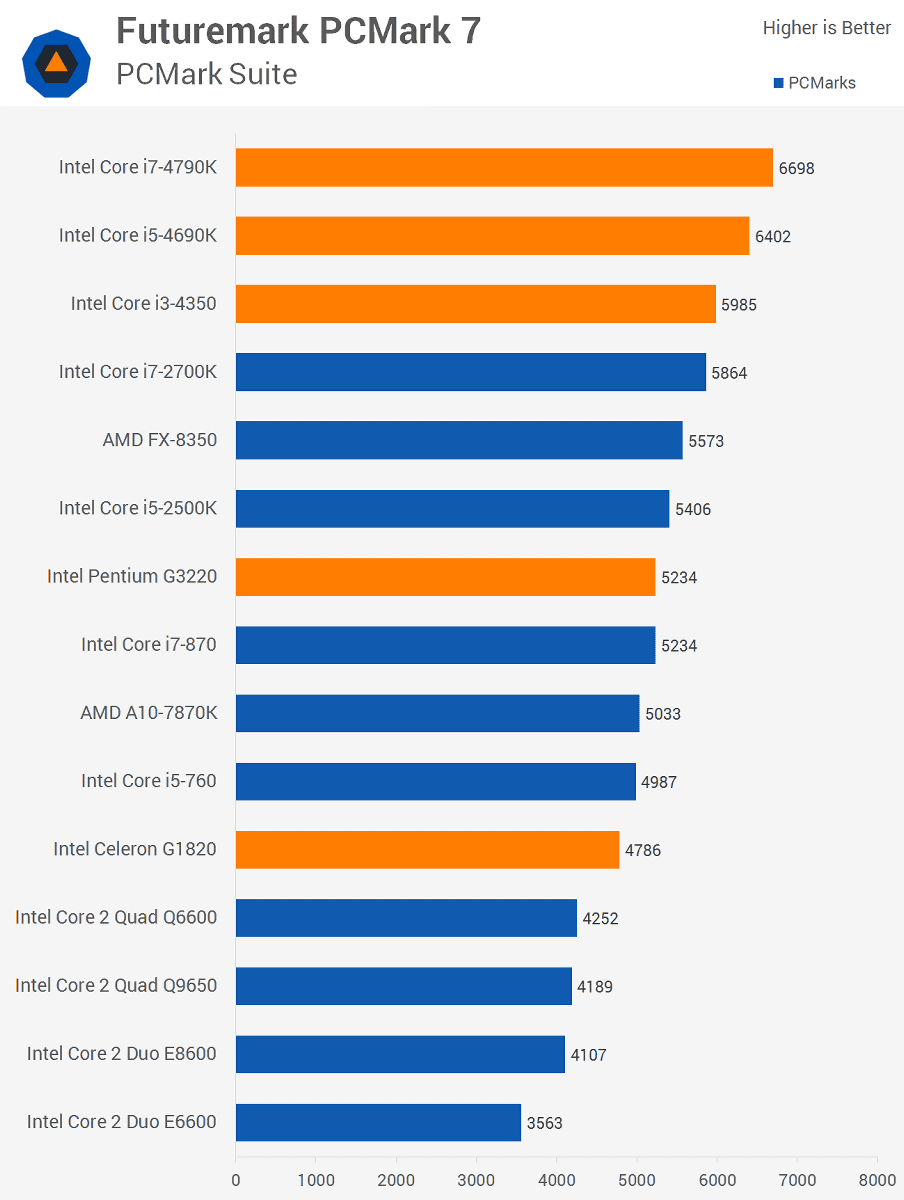
· PCMark
Benchmark softwarePCMark 7Performance comparison using. The performance difference between Core 2 Duo E 6600 10 years ago and the latest Core i 7 - 4790 K is small because the performance of the GPU · GeForce GTX 980, SSD · MX 200, etc. influences it.
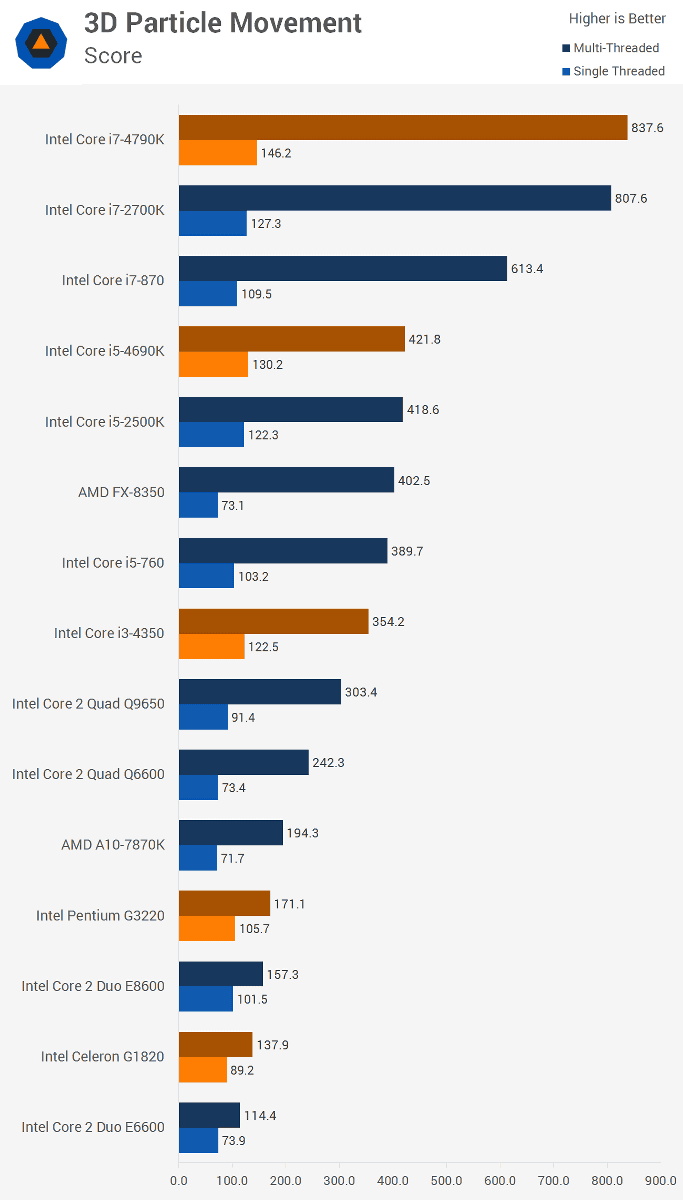
· 3D Particle Movement
3D Particle MovementBenchmark by. The results are almost the same in Core i 5 - 4690 K and Core i 5 - 2500 K, and surprisingly Core i 7 - 870 is in a good fight.
◆ Application execution speed
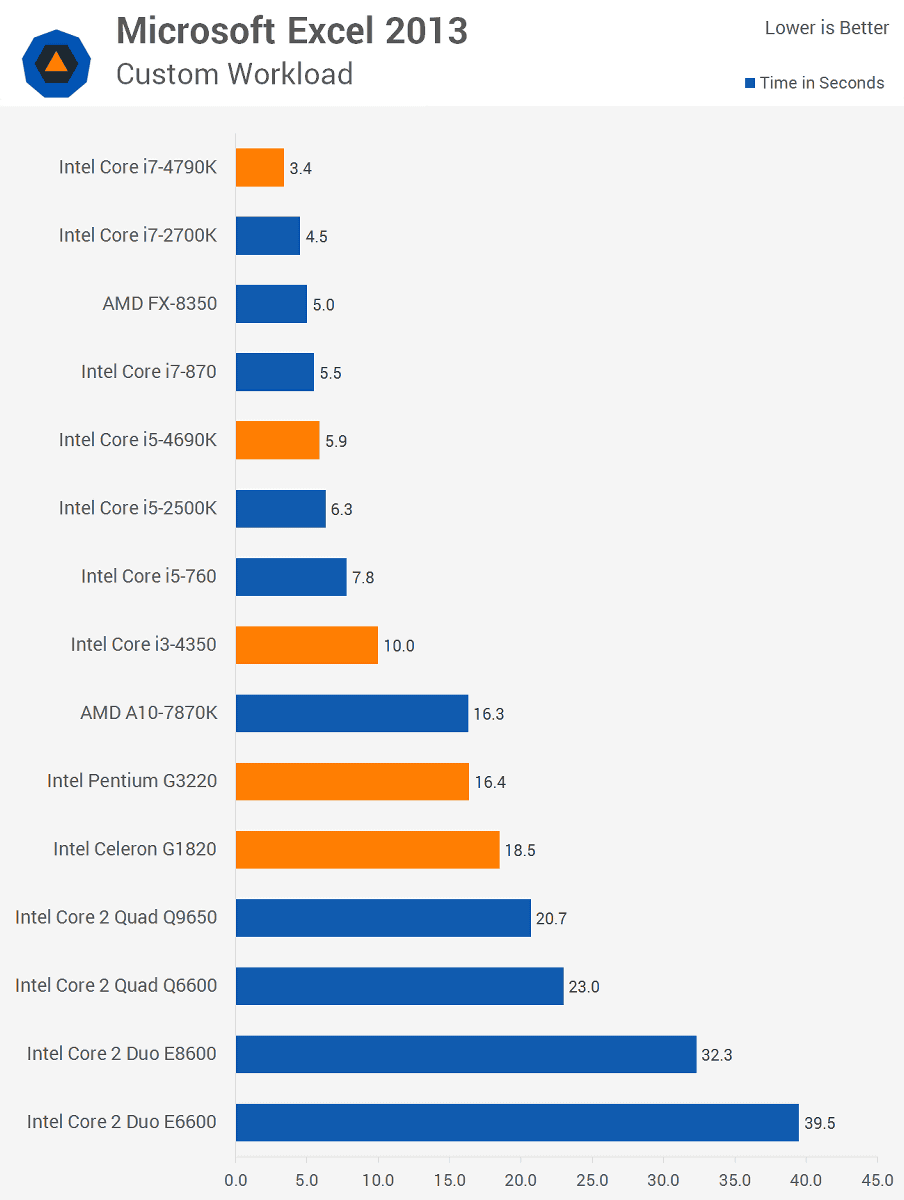
· Excel 2013
The graph which measured the workload in Excel 2013 is as follows. The smaller the number in the graph, the faster the processing is shown. By evolving from Core 2 to the Core i series, the processing speed of Excel has improved dramatically, even the high-end model Core 2 Quad Q 9650 at the time of release did not reach the low-end model Celeron G 1820 as a result of the shock .
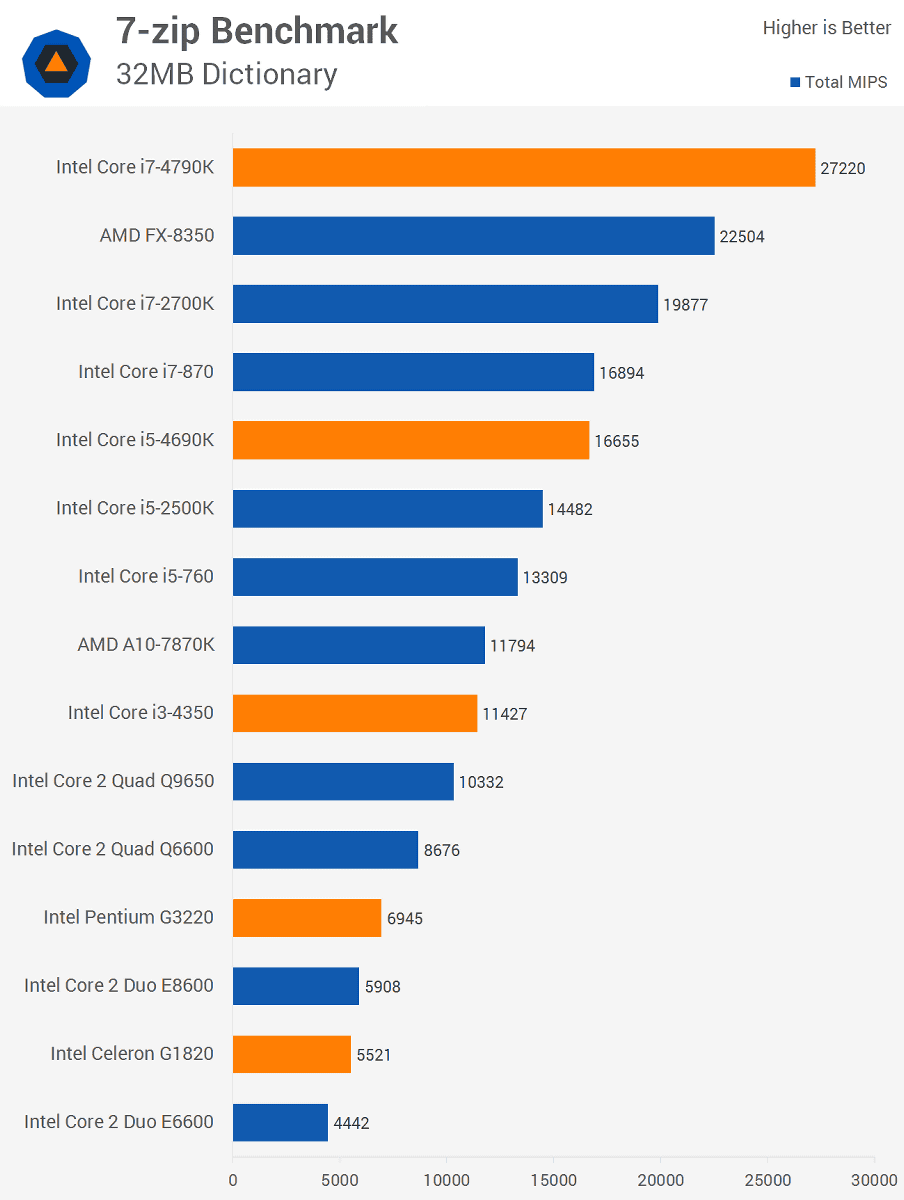
· 7-zip Benchmark
Measure the speed of file compression / expansion7-zip BenchmarkPerformance comparison by. Core i 7 - 4790 K significant improvement in performance is conspicuous.
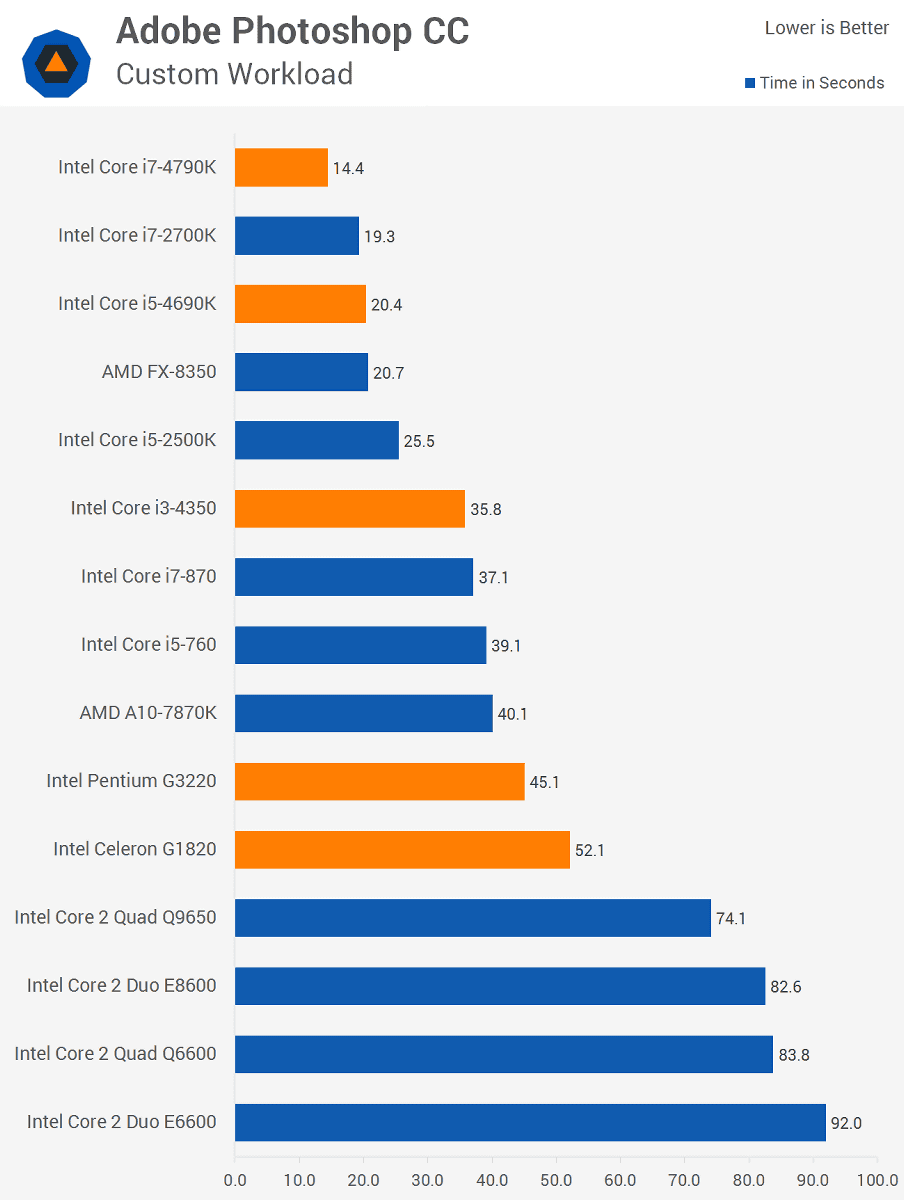
· Photoshop CC
When measuring the workload of Adobe Photoshop CC, it looks like this. The smaller the number in the graph, the faster the processing is shown. From the results that Core 2 Quad Q 9650 is about 60% performance of Celeron G 1820 and the good score of Core i 3 - 4350, it is clear that if you use Photoshop the CPU is better.
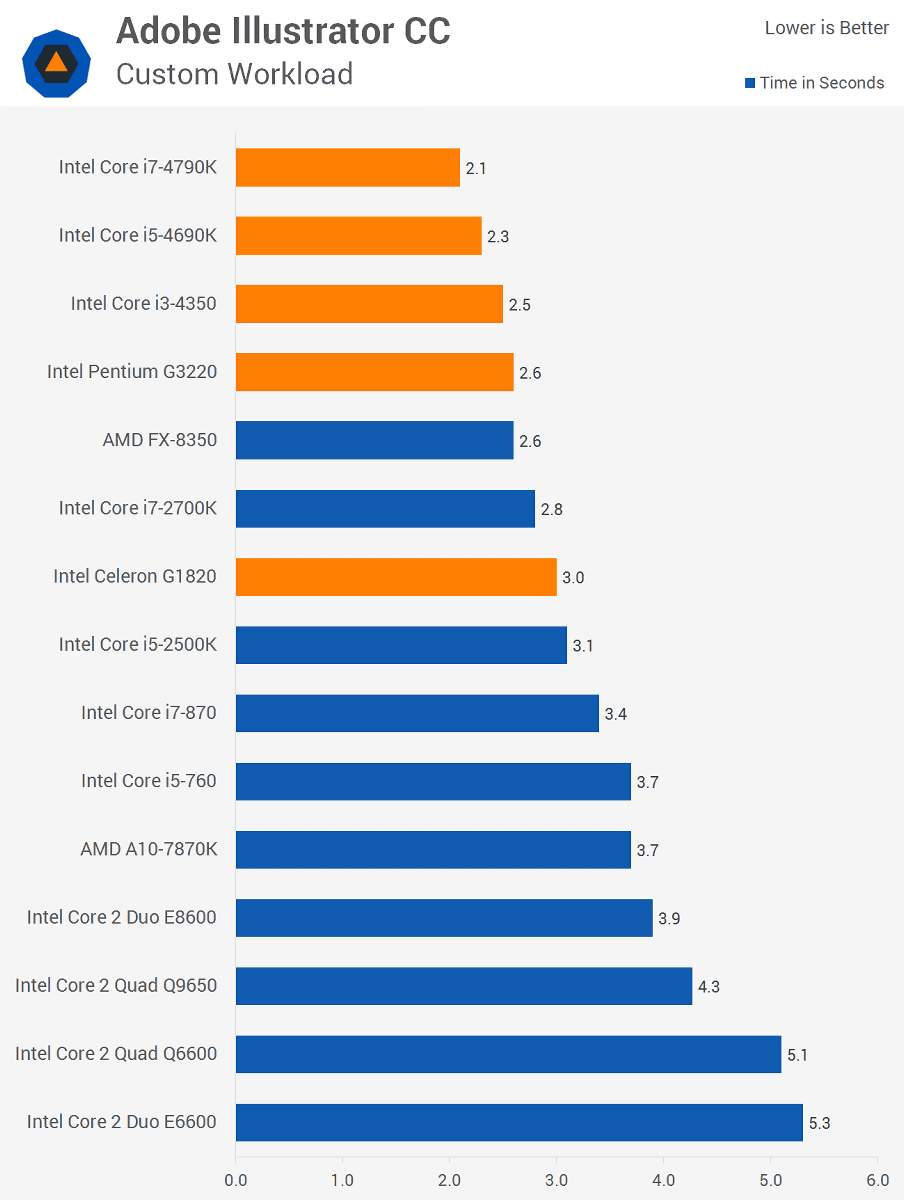
· Illustrator CC
When measuring the workload of Adobe Illustrator CC, it looks like this. The smaller the number in the graph, the faster the processing is shown. Performance in Illustrator is almost in descending order of generations, since it is mostly single threaded.
◆ Encoding performance
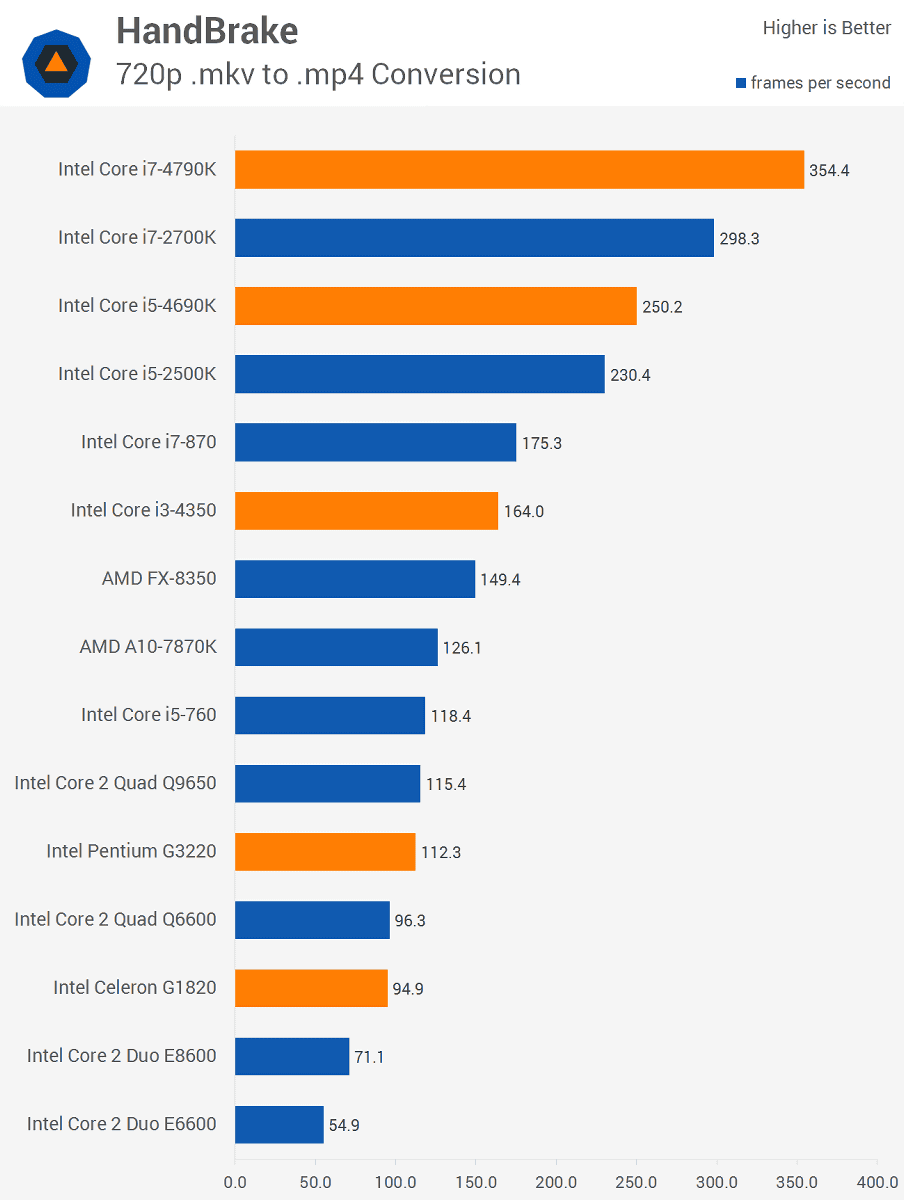
· HandBrake
HandBrakeWhen comparing the speed of 720p MKV format movie data encoded in MP4 format, the following graph shows. The performance of multi-threading operation has a big influence while also mentioning the newness of generations.
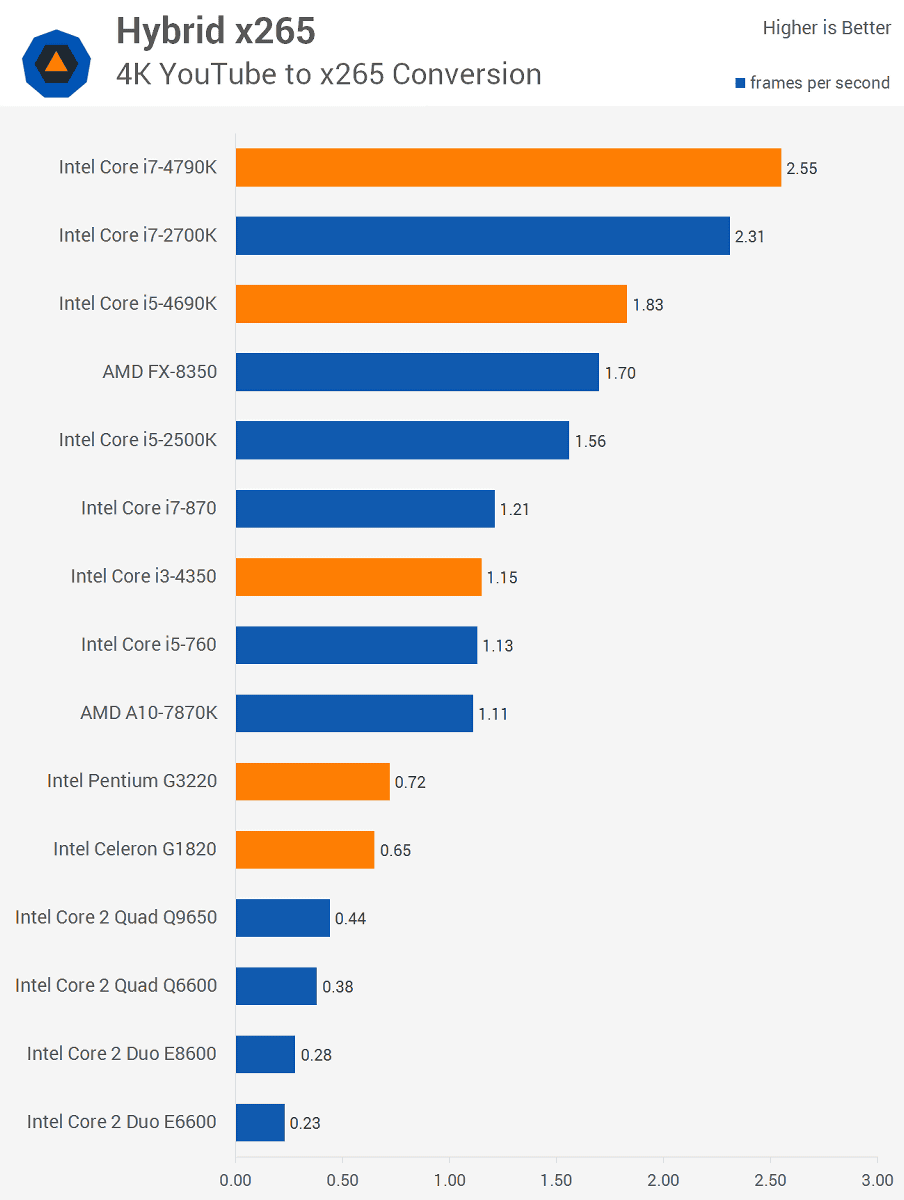
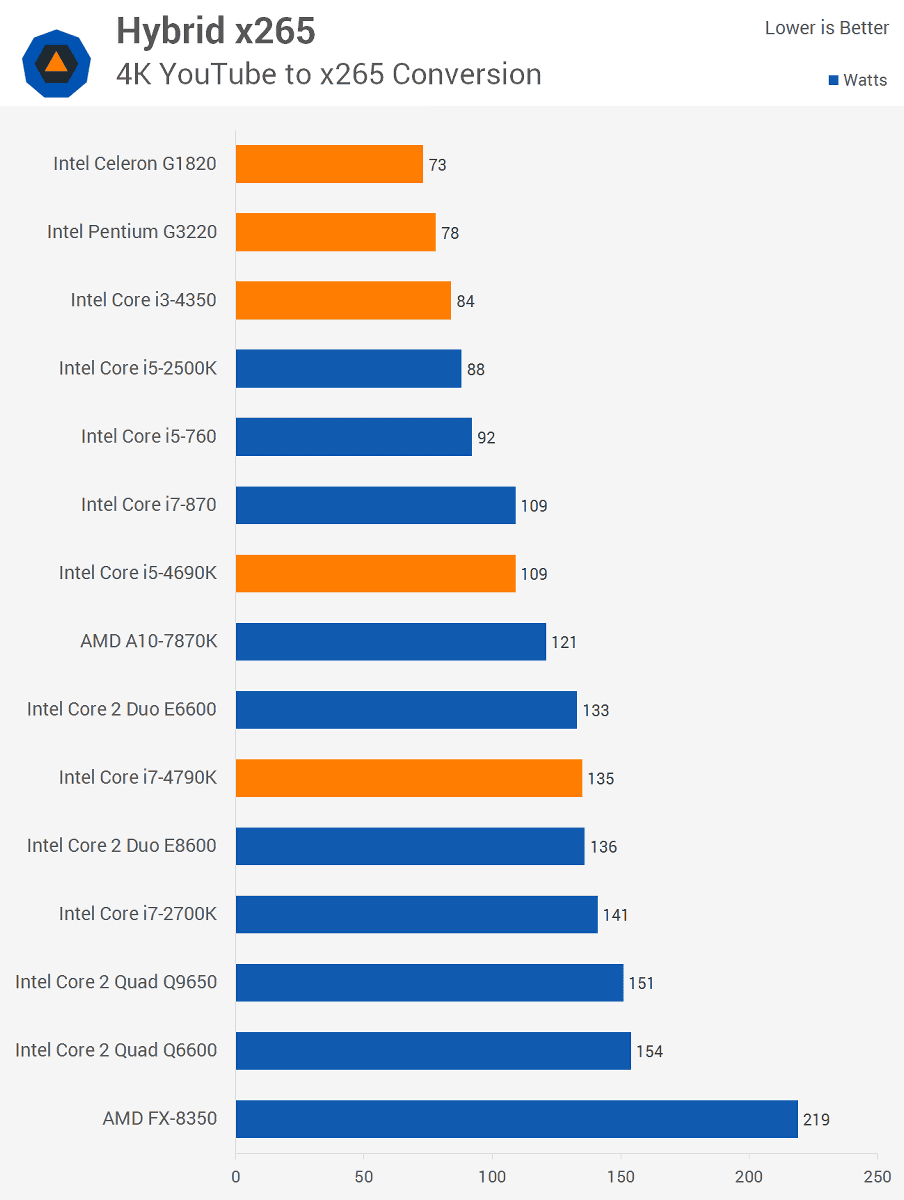
· Hybrid x 265
Hybrid x 265Using 4K quality YouTube movie encoded with x265 like this. It was Core 2 Quad Q 9650 which exceeded Celeron G 1820 in HandBrake, but in Hybrid x 265 we are dusting.
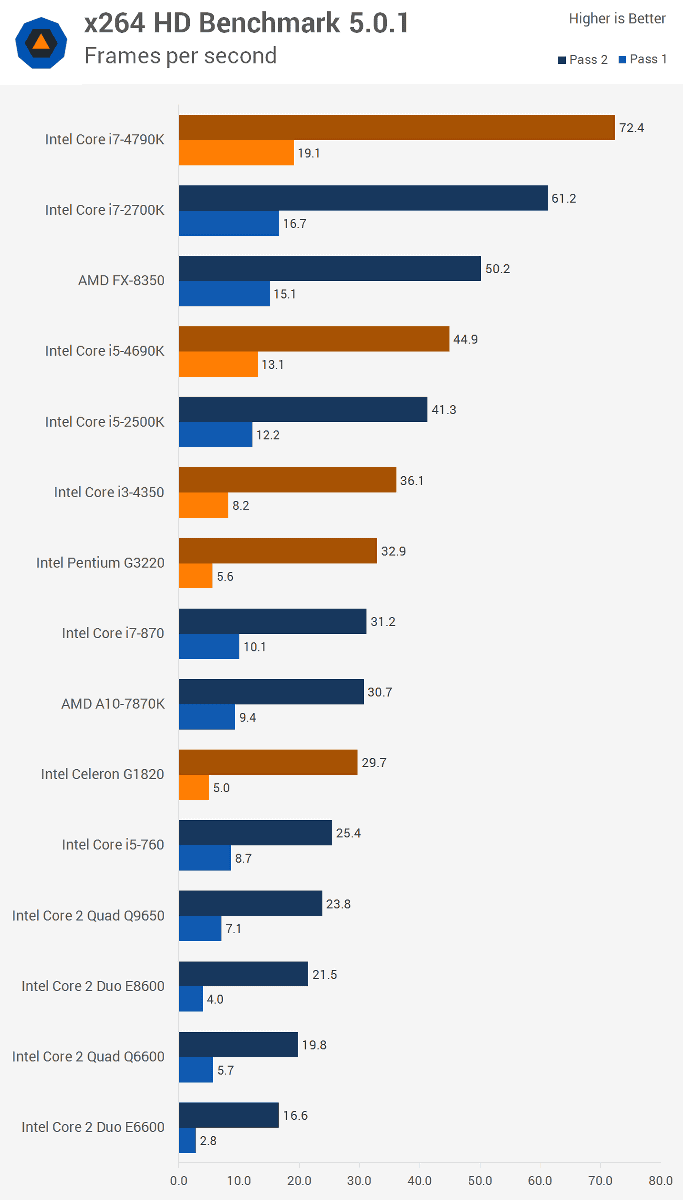
· X264 HD Benchmark 5.0.1
X264 HD Benchmark 5.0.1Encoding performance benchmark by. The upper graph shows the performance at the time of 2 passes and the lower chart shows the performance at the time of 1 pass. As you can see in comparison between the Pentium G3220 and Core i7-870 and Core i 5-760 and Celeron G 1820, even though the generation's new CPU is inferior in 1-pass performance, it can happen that the performance in 2 passes will reverse.
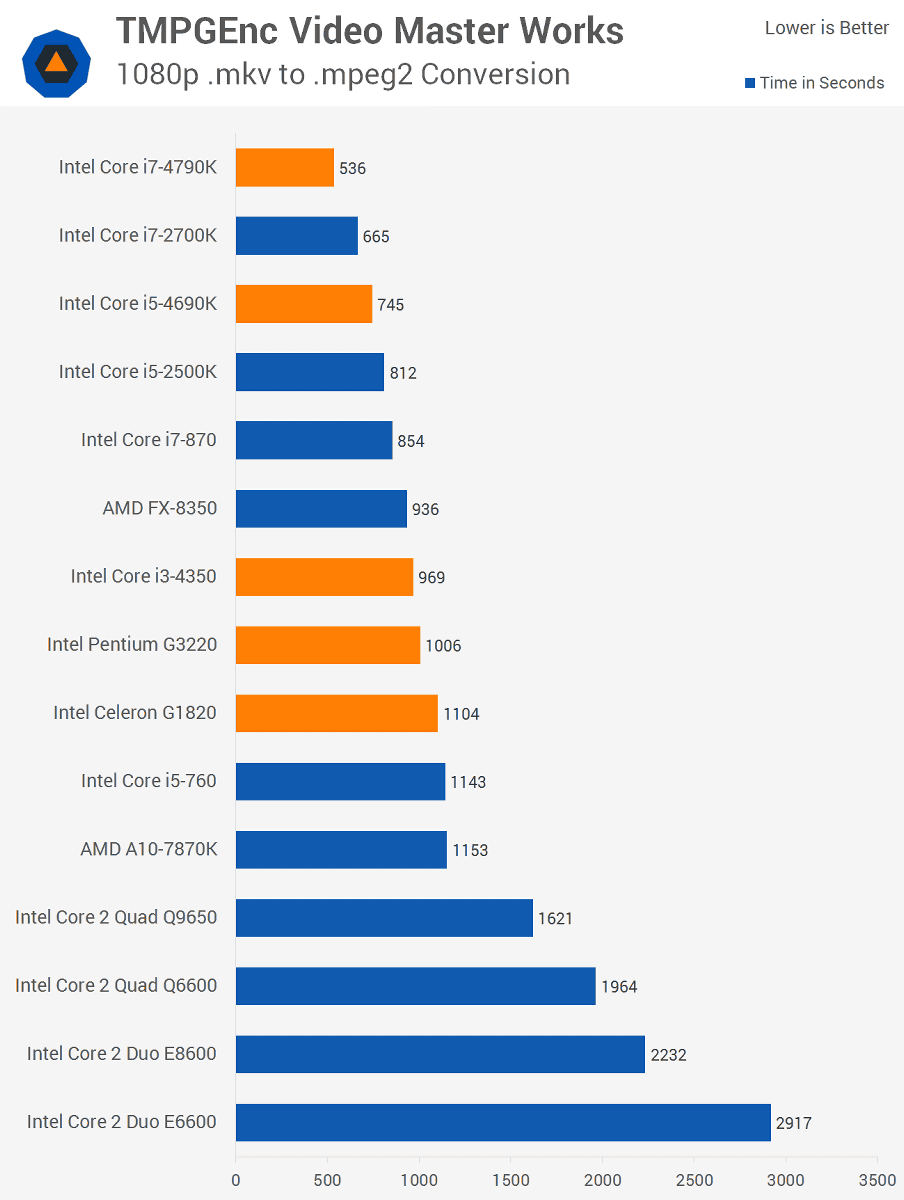
· TMPGEnc Video Maser Works
TMPGEnc Video Maser WorksThe time required to convert MKV format 1080p movie data to MPEG 2 format is like this. The cheap low-end model Celeron G1820 wins such as high-end model Core 2 Quad Q 9650 at the time of release and Core i 5-760 of the price range of the same middle range as well.
◆ Game Performance
Measure the game performance with the Geforce GTX 980 on the graphic board as follows.
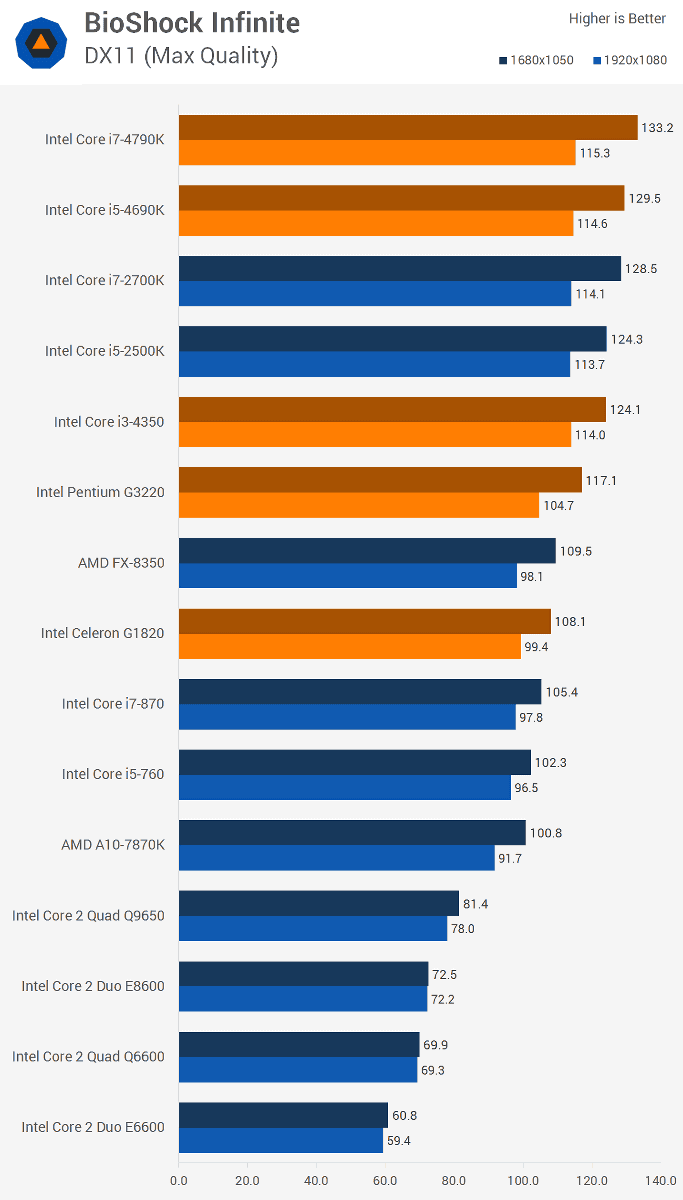
· Bioshock Infinite
Bioshock InfiniteThe frame rate at this is like this. The upper graph shows 1680 × 1050 resolution and the lower shows 1920 × 1080 resolution. It is obvious that the frame rate of the Intel Core 2 generation CPU is sluggish and it is not possible to successfully draw out the performance of the GTX 980.
· Metro Redux
Metro ReduxThen, the CPU performance is more affected by the frame rate.

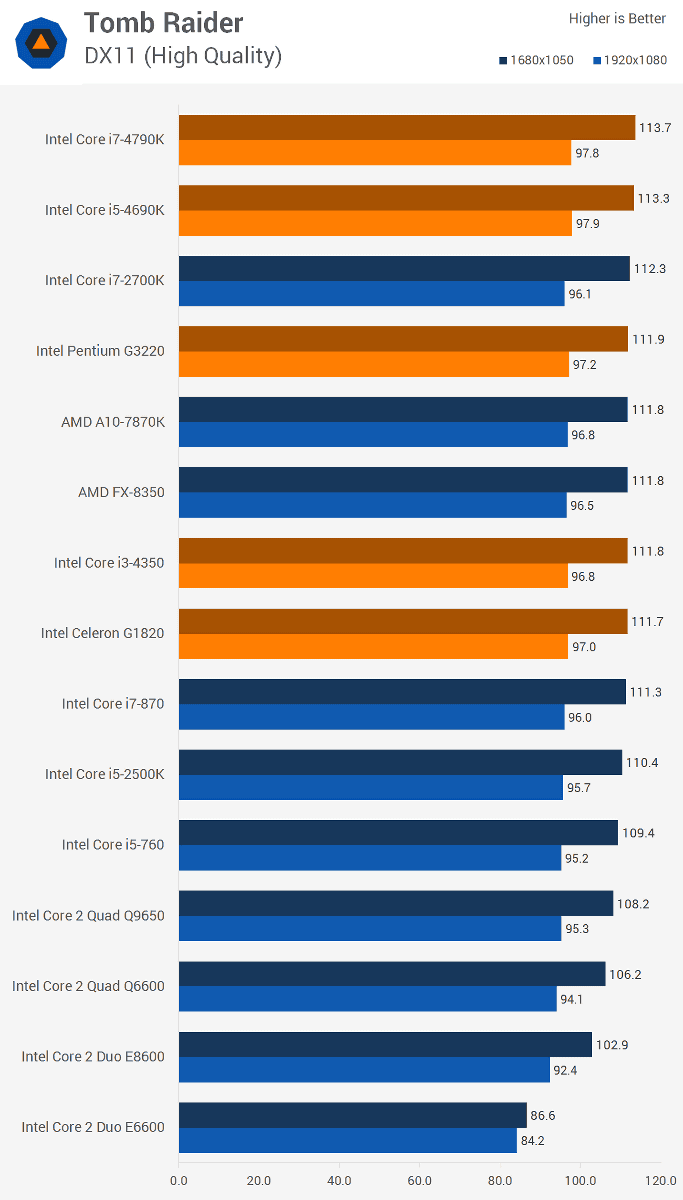
·tomb Raider
On the other hand,tomb RaiderIs a game that does not depend so much on the CPU, so Core 2 Duo E 6600 which is a 10-year-old die-dropping model has a frame rate exceeding 80 fps and it is possible to play comfortably.
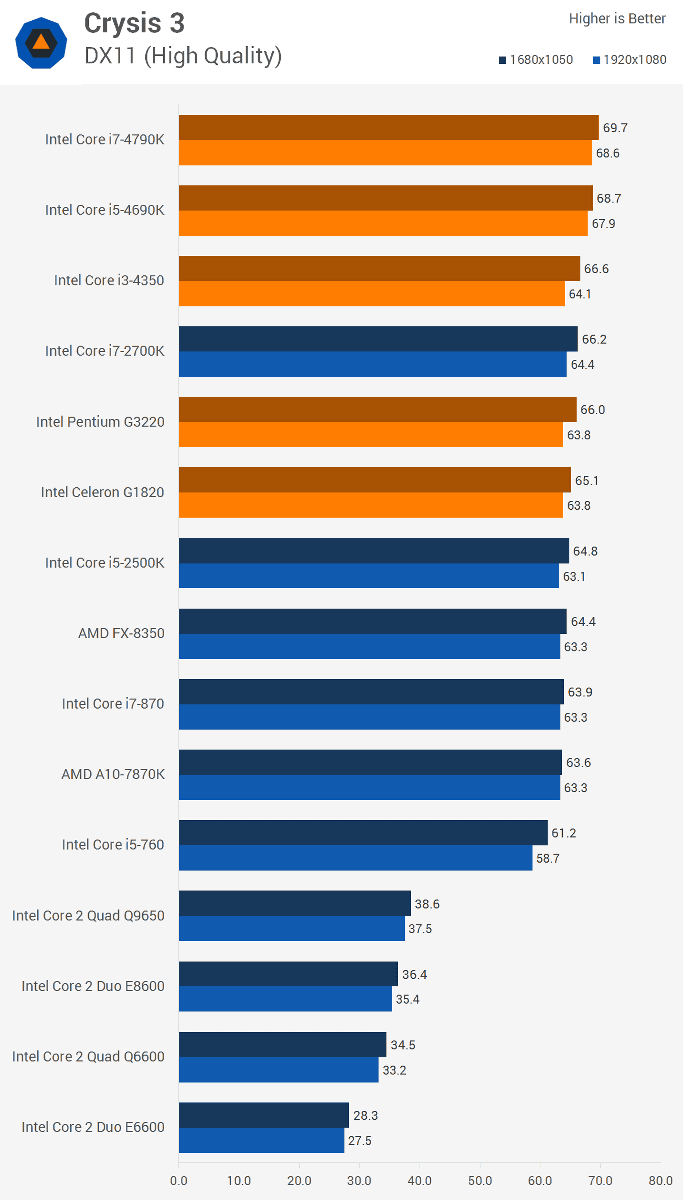
· Crisis 3
Crisis 3In case of Core i series and Core 2 series, there seems to be an absolute wall which can not be exceeded.
◆ Power consumption
The performance of the CPU is not only spoken by high-speed processing capability, but also the power consumption during processing is important. Of course, the smaller the power consumption, the higher the performance.
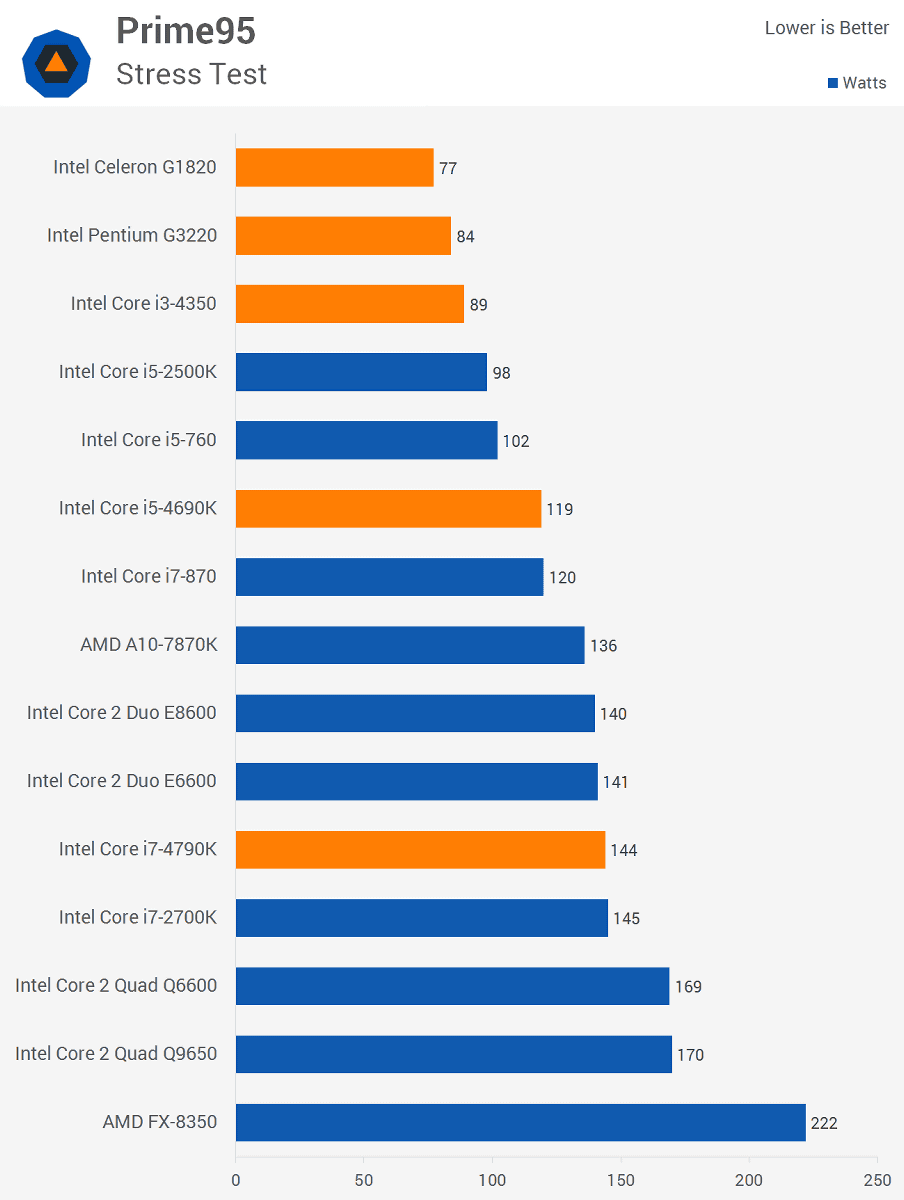
· Prime 95
Standard software used to load CPUPrime 95The power consumption of the whole system when running is like this. Power saving has been achieved every generation, and Core i7-4790K is the power consumption of Core 2 Duo E 6600 which is the middle range CPU at that time.
The power consumption tendency of the whole system shows almost the same tendency when executing movie encoding and running other benchmark software.
Ten years ago the retail price of the middle range CPU "Core 2 Duo E6600" was $ 316 (about 36,000 yen at the time), but the high end model "Core i7-4790K" released in 2014 Is about 339 dollars (about 35,000 yen at the time of the time), the CPU tends to be low price as the performance becomes higher. The 6 th generation Intel Core processor finally released on August 5, 2015 "Skylake"It is important to know how performance improvement is fulfilled.
Related Posts:


in Hardware, Posted by darkhorse_log