"GANTTplanner" to create a Gantt chart from Google Calendar for free
By using a line like a bar chart extending in the horizontal direction, we can refer to the table that makes it easier for the progress of work and production control.Gantt chart"However, it is a Gantt chart of the schedule registered in Google Calendar, and task management at a glance is"GANTTplanner"is.
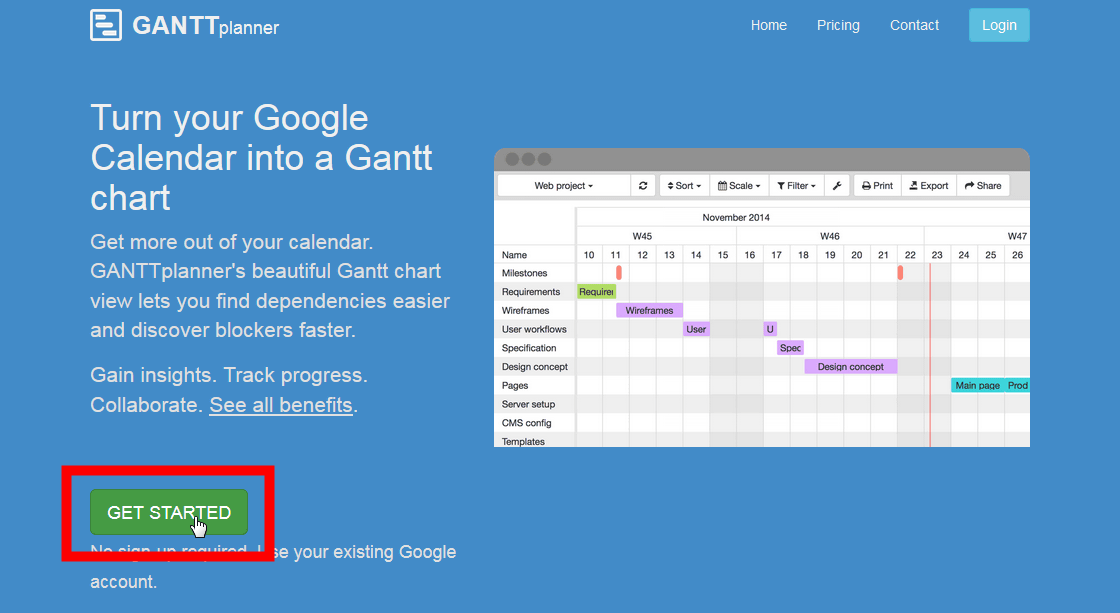
GANTTplanner: Turn your Google Calendar into a Gantt chart
https://www.ganttplanner.com/
Click "GET STARTED" to create a Gantt chart from Google Calendar.
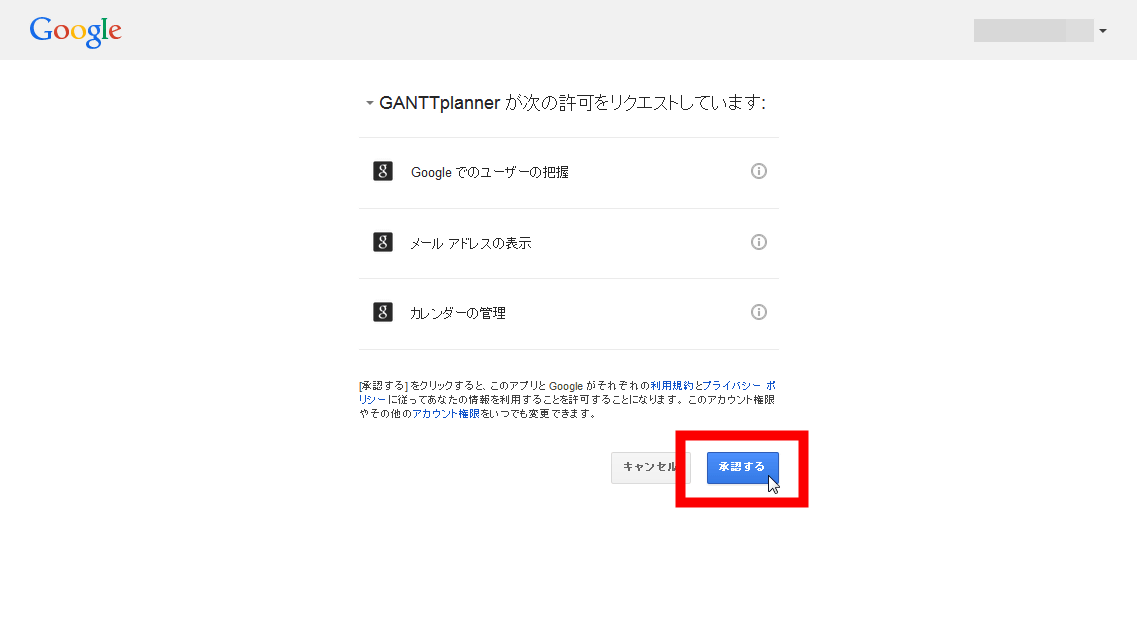
Since GANTTplanner imports information on Google Calendar, you will be asked to sign in with your Google Account. Log in with the account you want to create a Gantt chart from the Google calendar information and click "Approve".
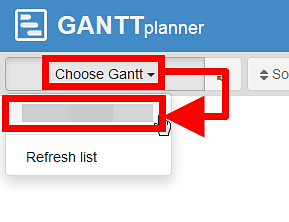
The top page of GANTTplanner has opened.

To import events from Google Calendar Click "Choose Gantt" and select the Google Account you signed in to.
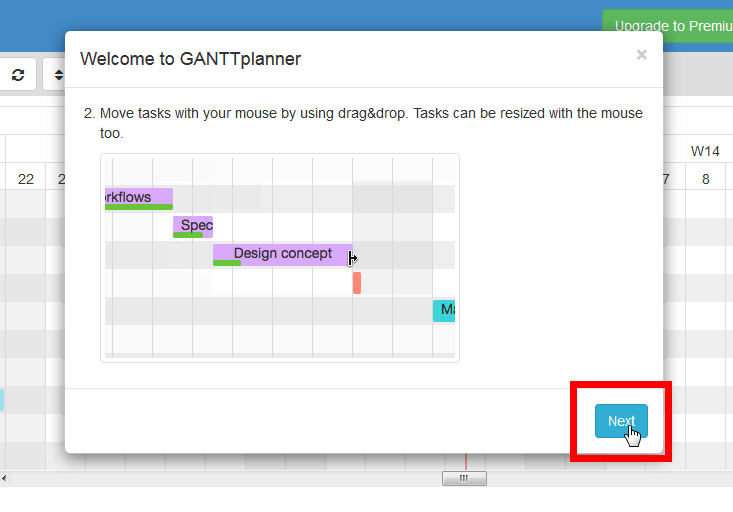
As the tutorial begins, click "Next" to proceed.
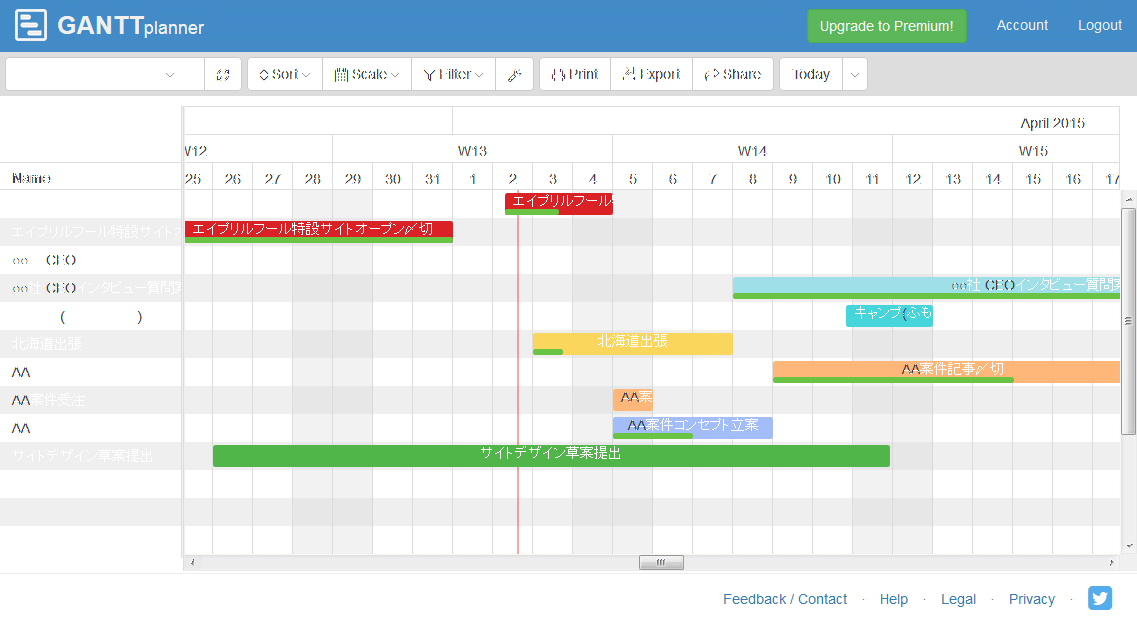
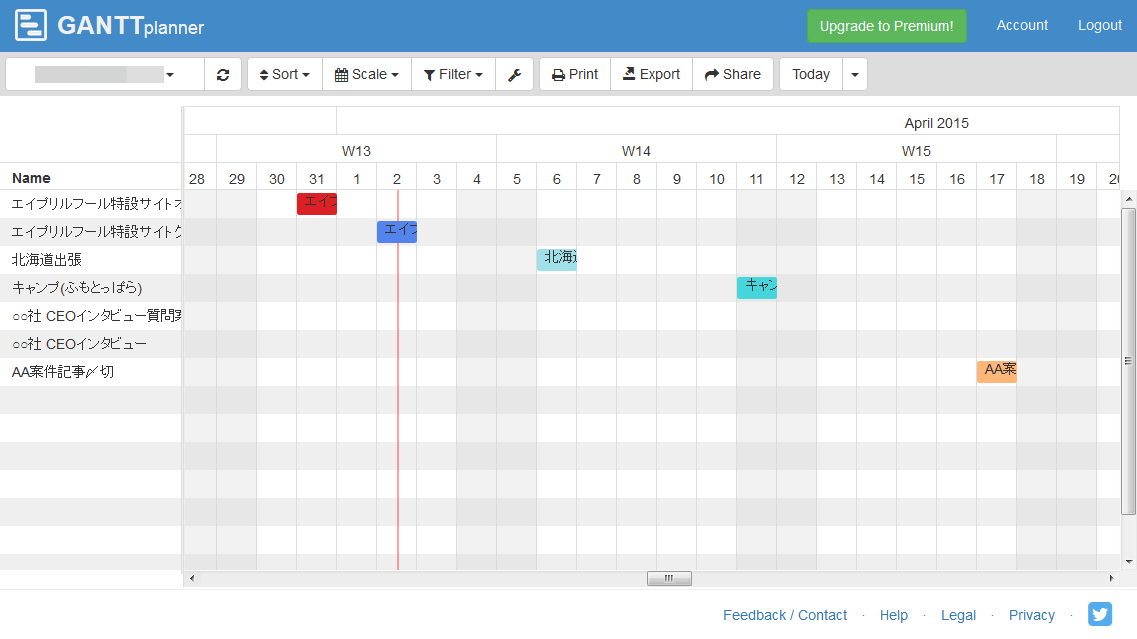
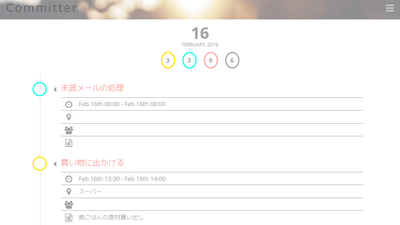
When the tutorial is over, the calendar of the selected Google Account will be synchronized and the task will be reflected in GANTTplanner. In the chart, the date is displayed in the "row" portion, the schedule (task) is displayed in the "column" portion, and when each task is done, it is displayed in a colorful line such as red or blue.
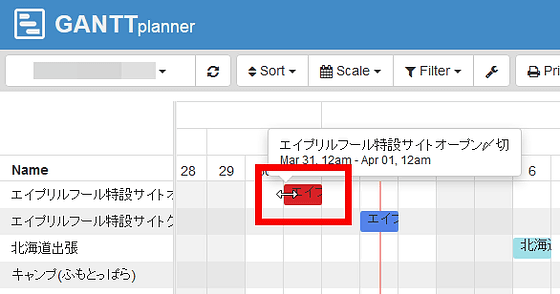
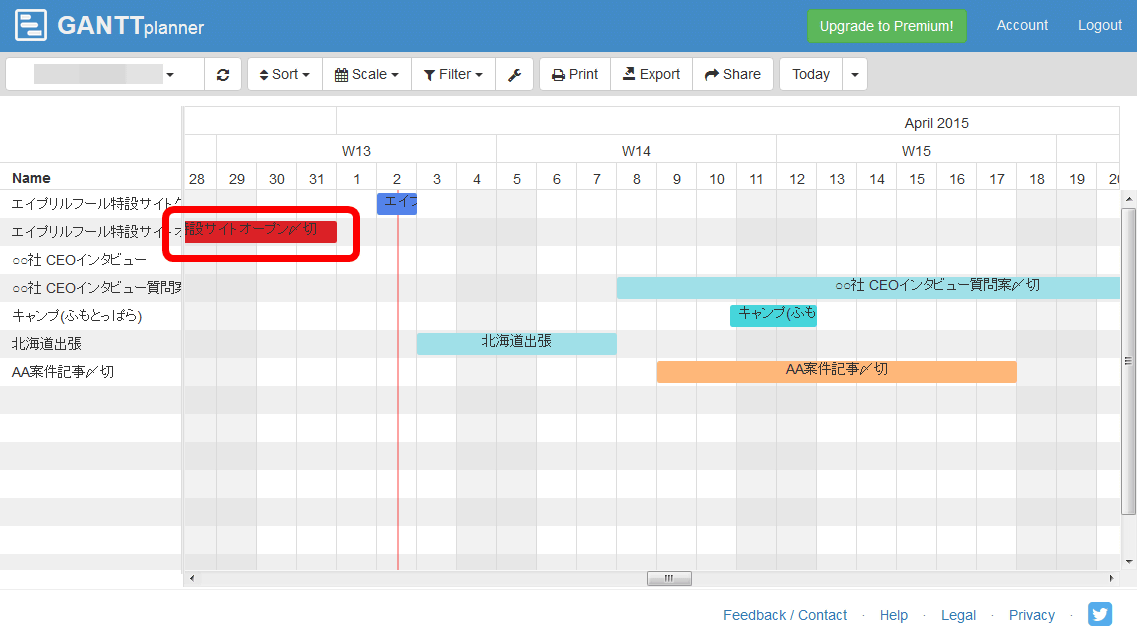
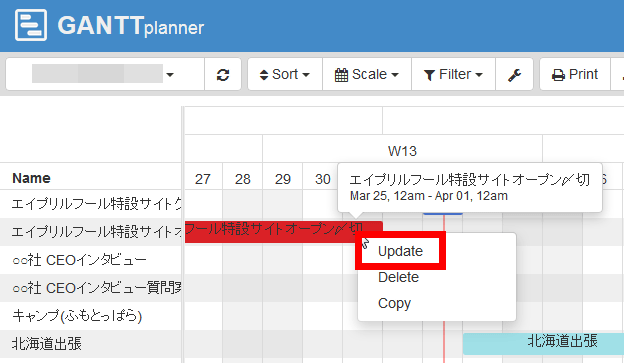
When you hover the cursor on the task, the task name and the scheduled time are displayed. To lengthen the scheduled time of the task Drag the task and extend it horizontally according to the schedule OK.
The task period such as "from work start to deadline" of the task that was registered by this can be understood at a glance.
In addition, right-clicking the task displays the choices, so click "Update".
The task details change screen is displayed. It is also possible to set the value of "Progress (%)" according to the task progress ... ...
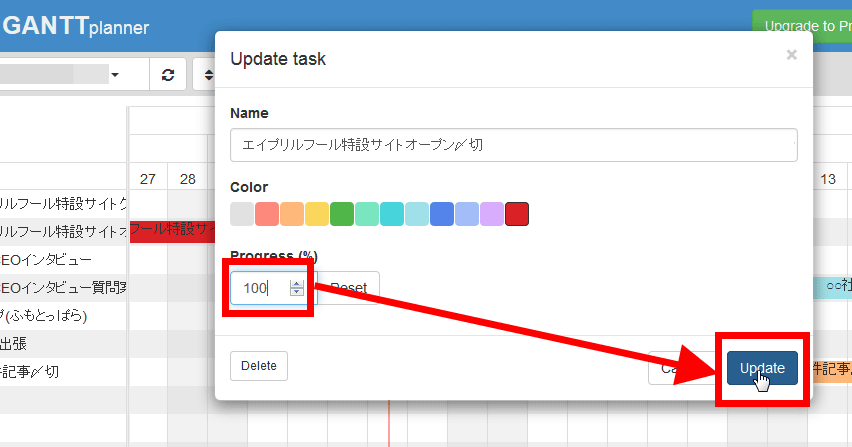
The progress was displayed with a green bar on the bottom of each task. The progress of each task can be confirmed at a glance.

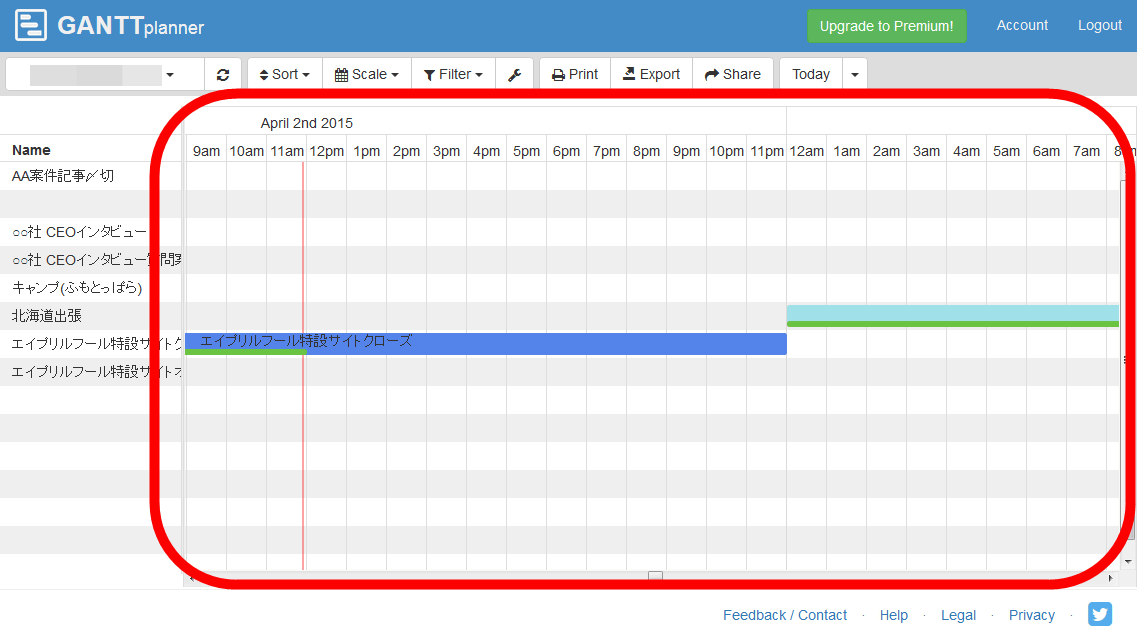
Furthermore, you can change from "Scale" to "Hour / Day / Week / Month / Quarter / Year" to change the display period of the chart. Try changing it to "Hour" ......
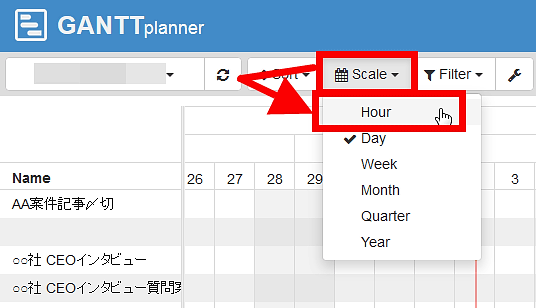
Tasks can be confirmed in 1 hour increments.
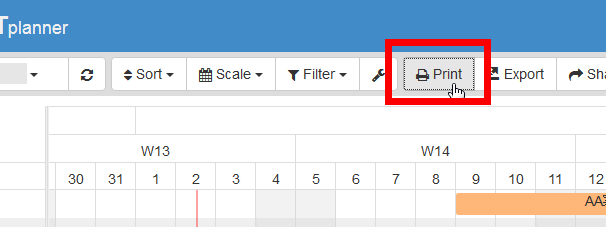
To print the created chart, click "Print".
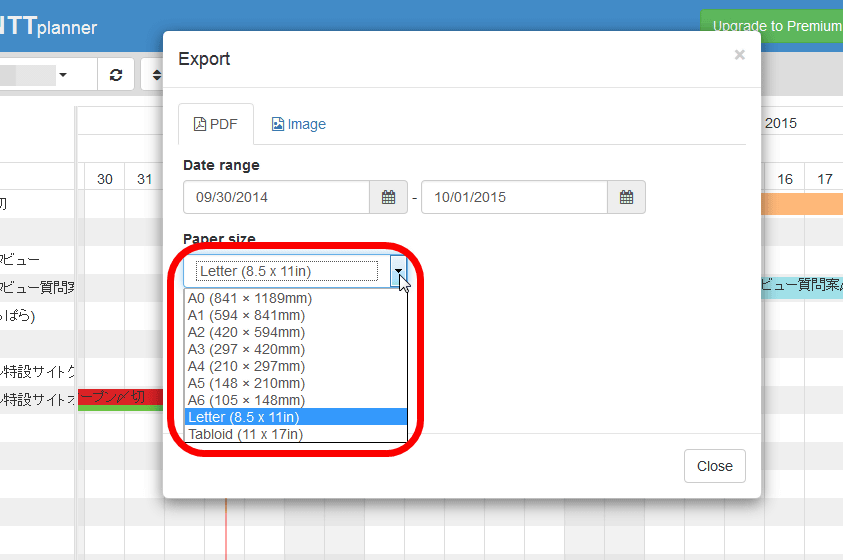
You can select the date range and print in PDF format. The size you can choose is A0 to A6, letter size (21.59 cm × 27.94 cm), tabloid size (21.59 cm × 43.18 cm).
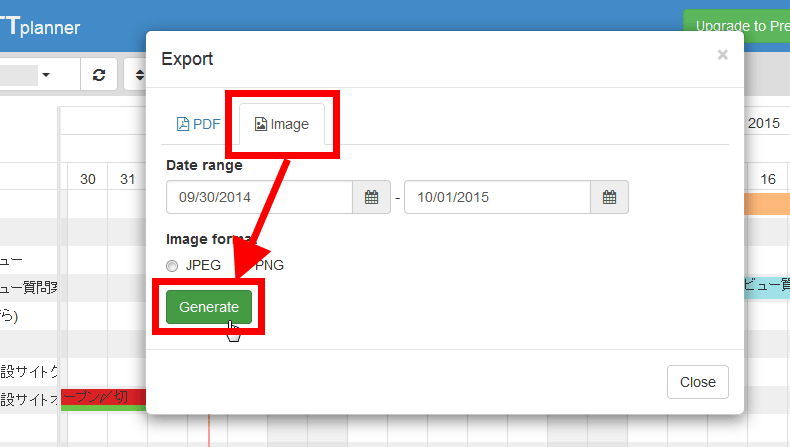
Also, to export as data, click "Image", specify the date range in the same way and click "Generate" OK. You can download Gantt chart created in JPEG · PNG format.
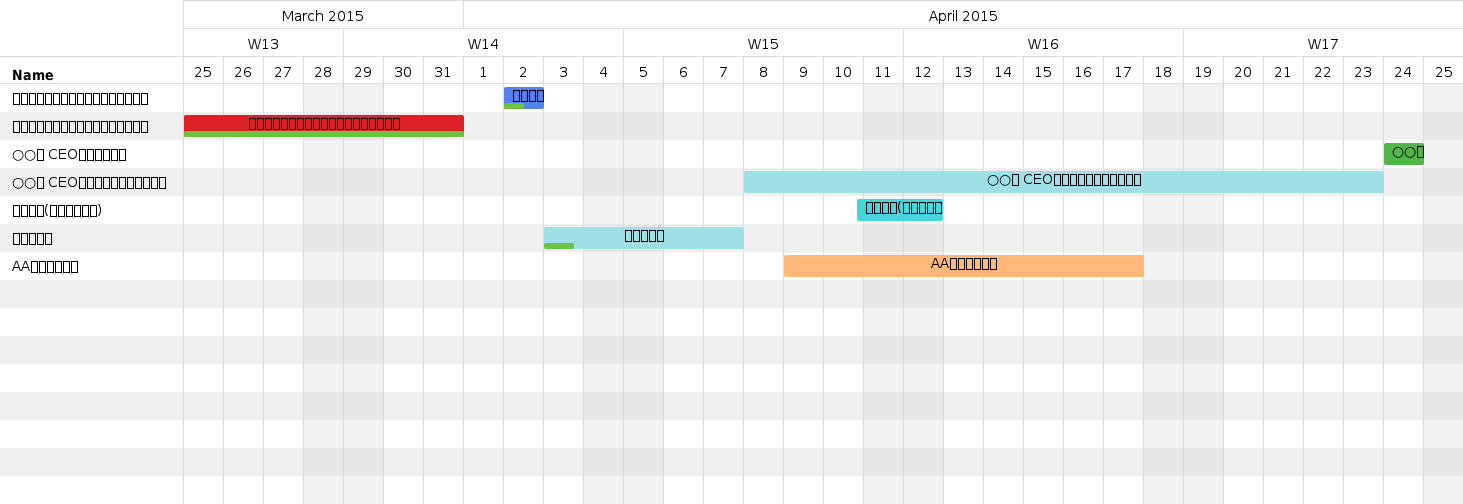
The files downloaded below. In both JPEG and PNG Japanese of the task name garbled and it appears that only English tasks can be output.
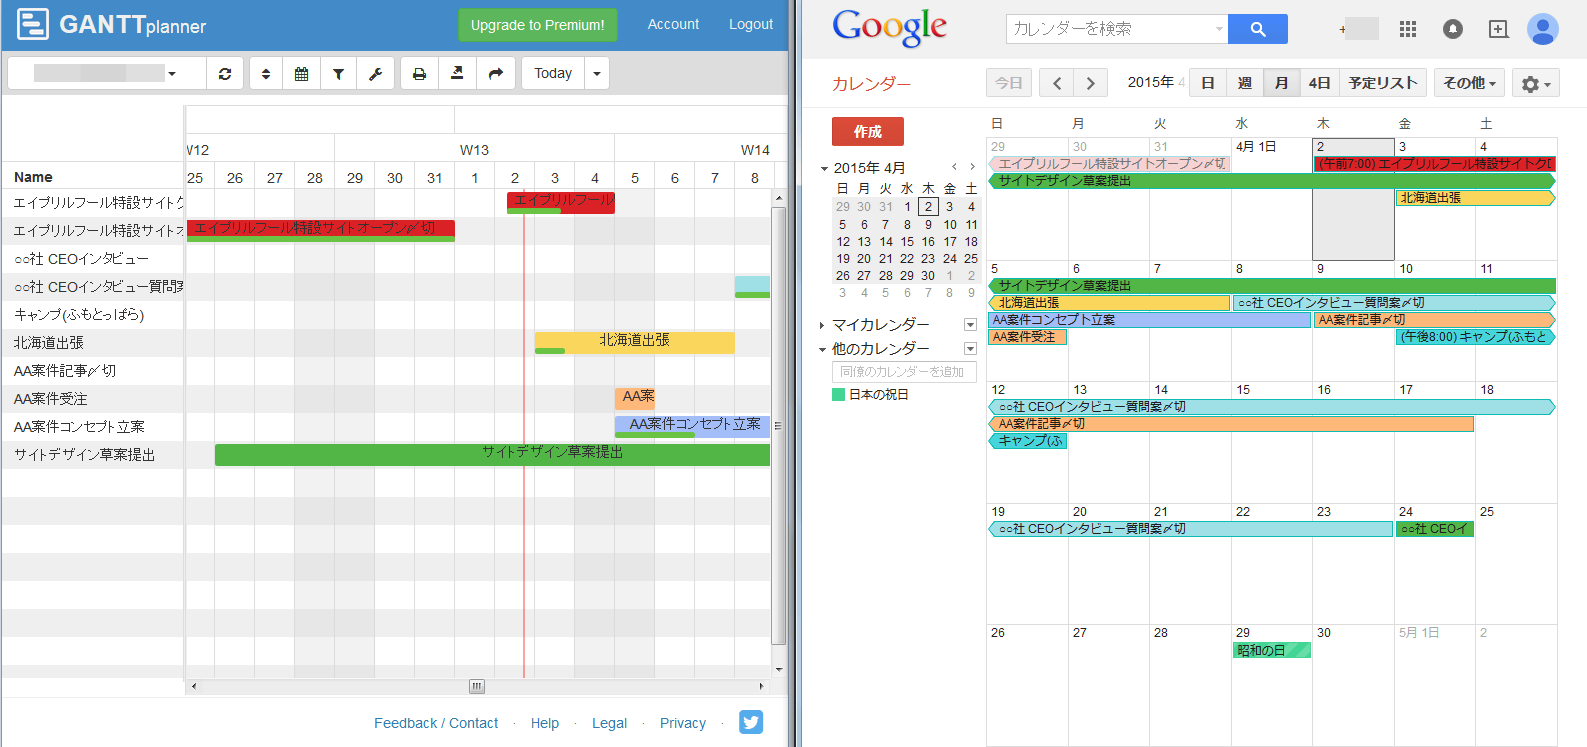
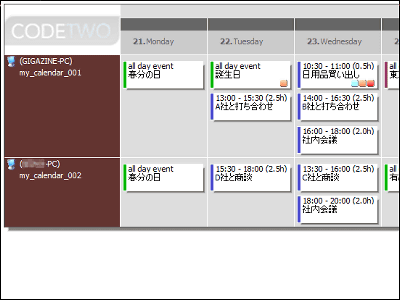
Furthermore, in order to compare how much it makes it easier to see by making a Gantt chart, I tried GANTTplanner and Google Calendar side by side. If you make Google Calendar like a Gantt chart, you can only distinguish tasks by task name and color, but since GANTTplanner has the task name written on the left end, the task period of each task can be known at a glance, It can be confirmed with, so it seems very useful in project management etc.
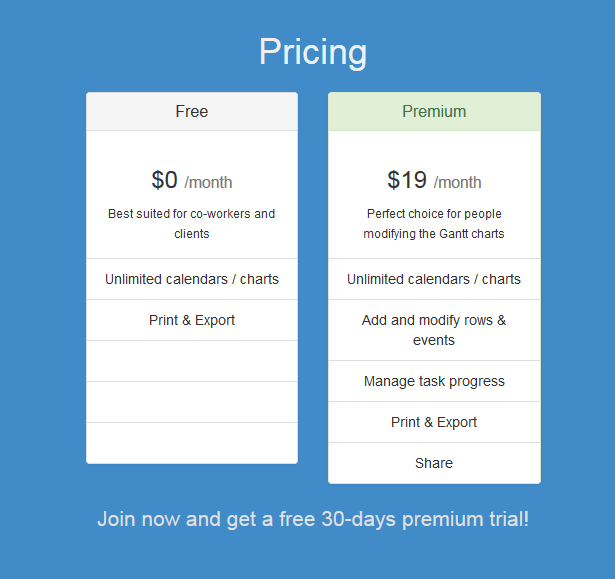
Up to the above is a function that can be used for free, but there is also a toll plan of $ 19 per month (about 2200 yen). In the free plan, you can not register the task directly to GANTTplanner or delete the registered task on the GANTTplanner just by synchronizing the schedule registered in Google Calendar, but when shifting to the pay plan, you can directly perform tasks on GANTTplanner You can use functions that can register / change, task progress management function, sharing function, and so on. Because we are implementing a free trial for only 30 days now, please try it if you are interested.
Related Posts:

in Web Service, Review, Posted by darkhorse_log