It will be like this if you make the Wi-Fi and wireless LAN radio that should not be seen visible through the LED light thoroughly
With the LED light whose color changes to red, green and blue in response to the radio wave intensity of Wi-Fi and wireless LAN, 2D is not satisfied with the flying radio waves, and the strong man appears by making full use of 3D It was. For visualization, it is a must-see for the first time to write up even woodworking milling machines and self-made tools.
- Now, I can see wifi signals. - Album on Imgur
https://imgur.com/gallery/jdNA6
You can see how the Wi-Fi signal is thoroughly visualized from the following movie.
High Res Wifi Signal Mapping - YouTube
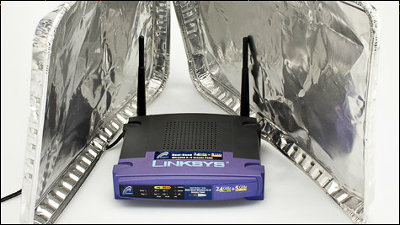
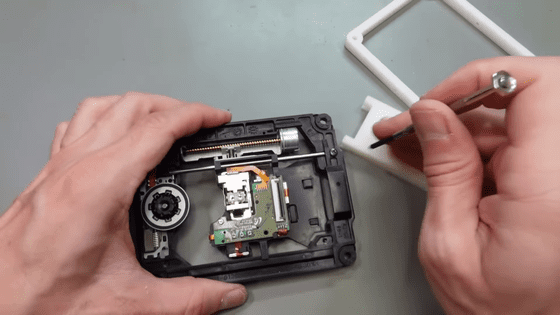
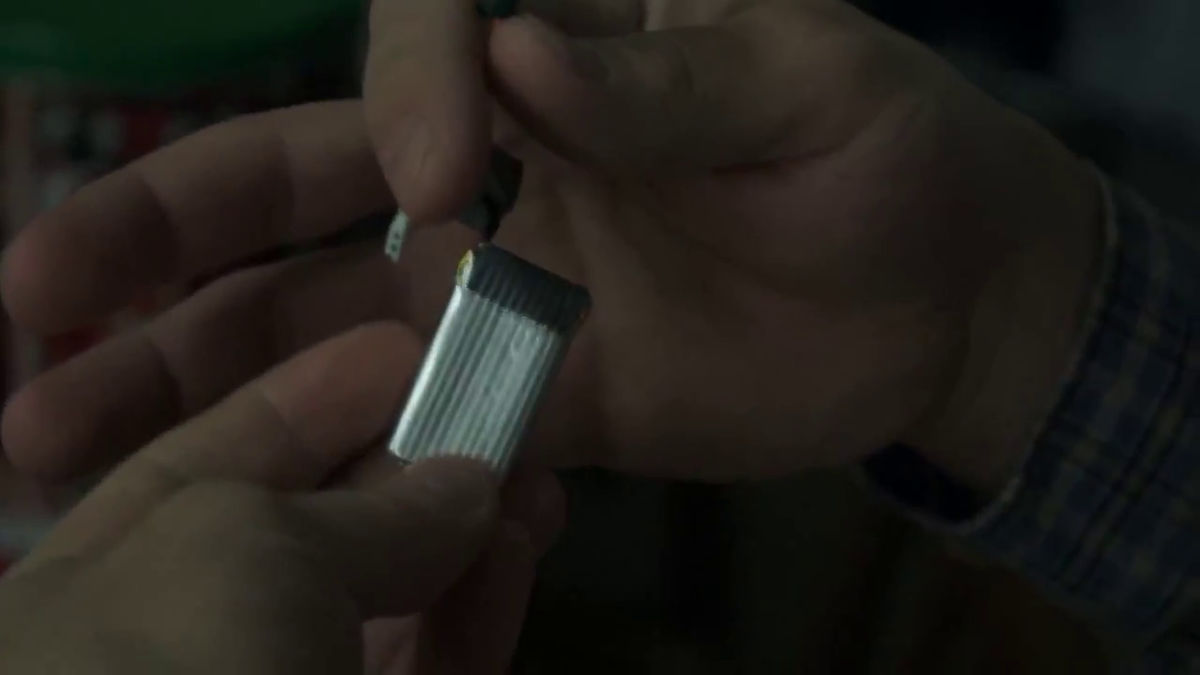
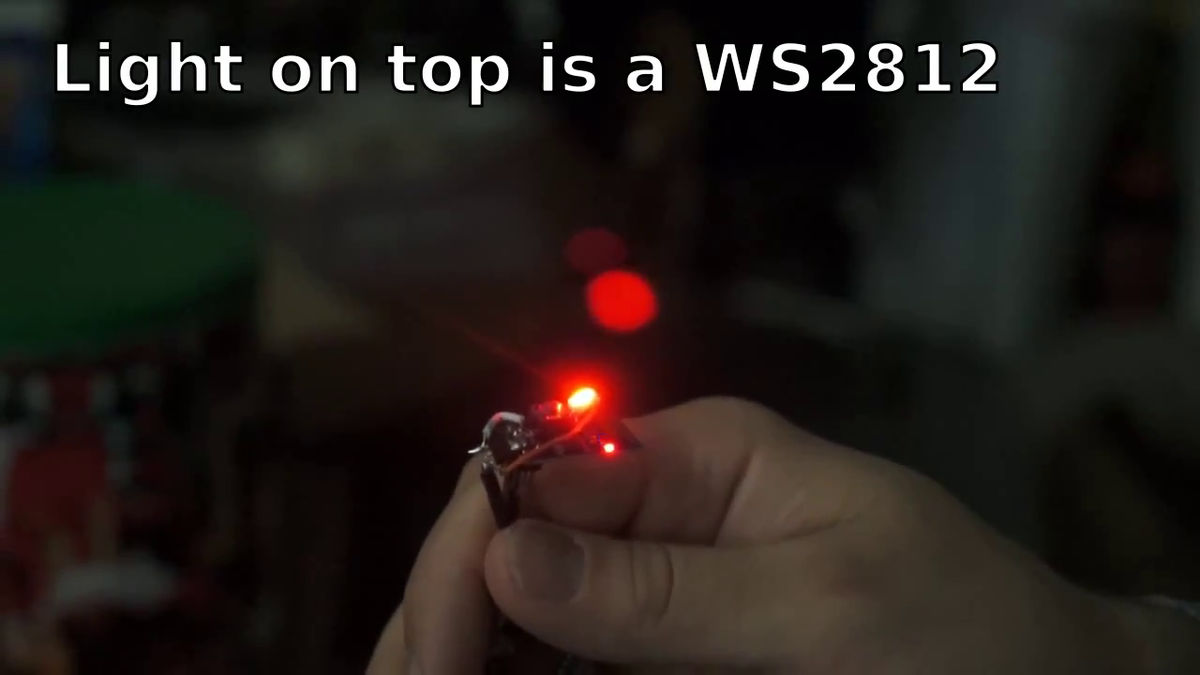
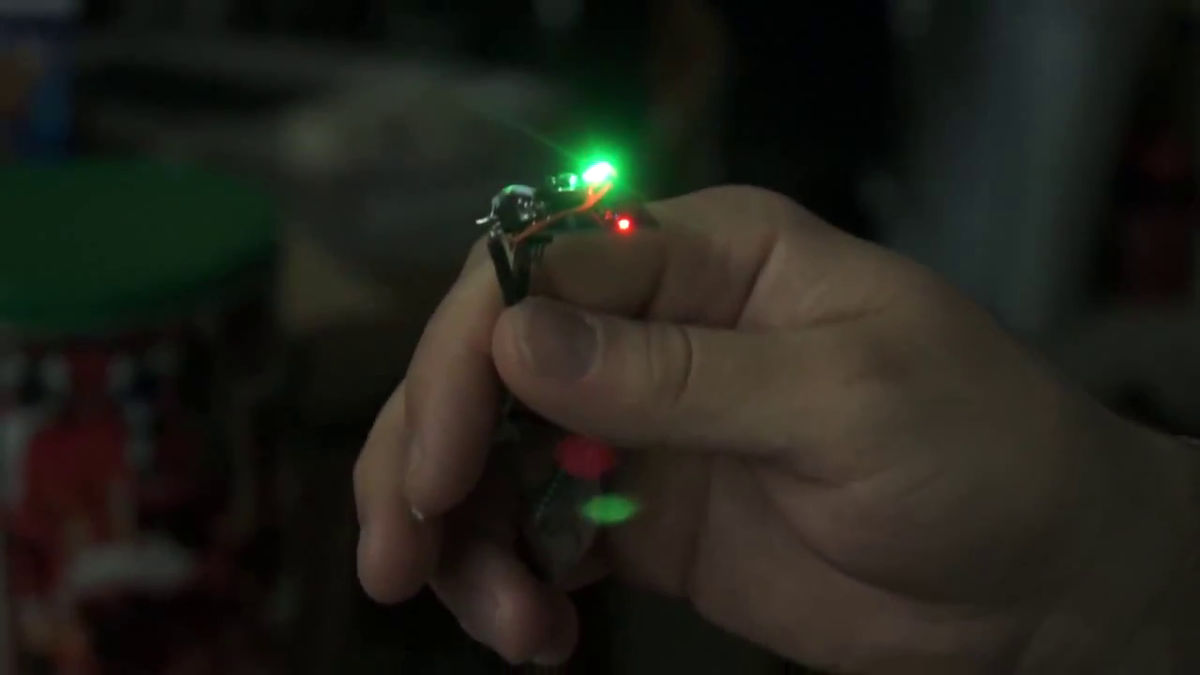
This is an LED light that changes color according to the radio wave intensity of Wi - Fi or wireless LAN.ESP 8266·WS 2812 LED·Hubsan battery packIt is usually a combination with a PC and used to check the Internet connection status.
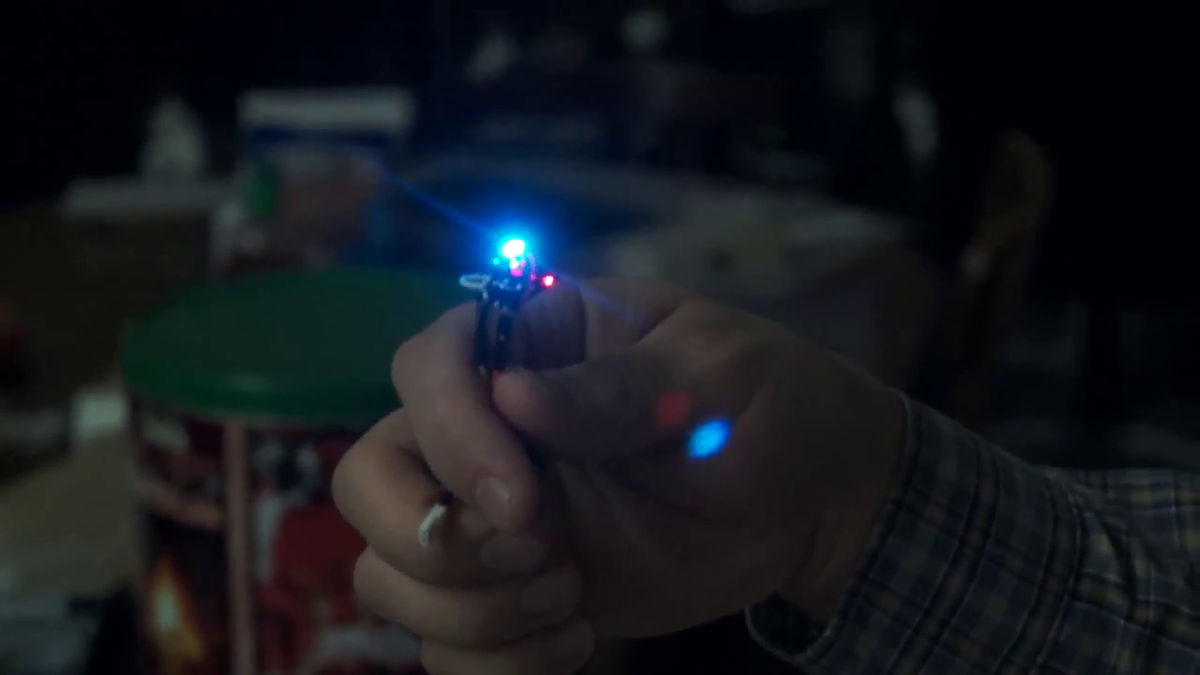
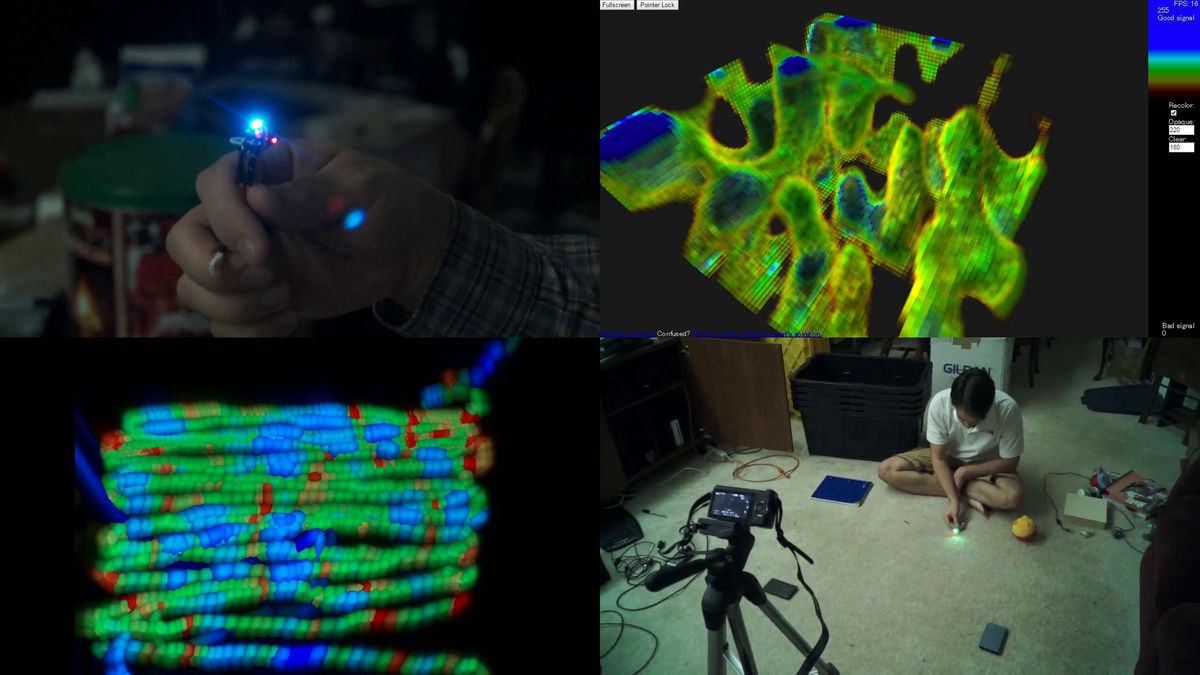
When you move the hand with the light, the color of light changes to red, green, and blue one by one according to the radio field strength.
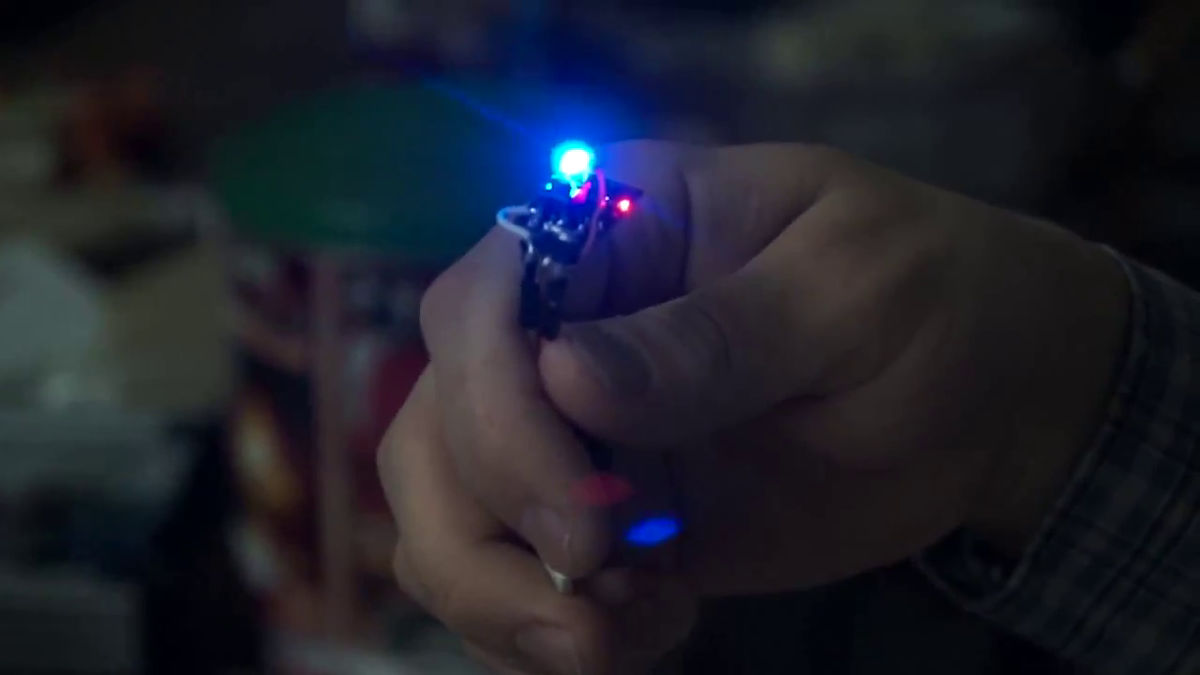
Initially I thought that the LED light shone randomly in response to radio waves. However, when you move it up and down in the same place, it seems that you noticed that it is not random as the light changes with the same pattern.
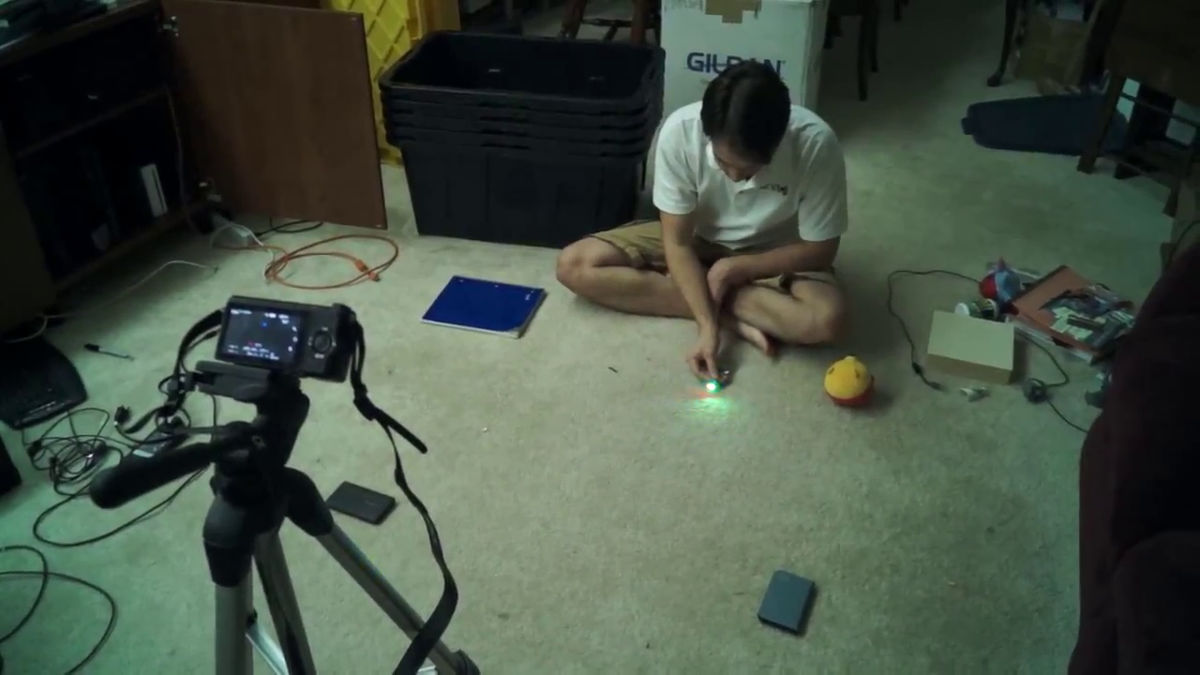
Developers who were shocked by the high precision that the light shifts greatly just by moving a few centimeters makes an accurate radio intensity map of their room. Set the ISO of the camera to the lowest possible value, and take a long exposure shot at 60 fps using a lens with a large aperture, in a place where you want to check the radio field intensity, slowly moving the light held in your hand.
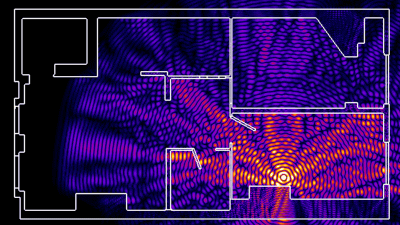
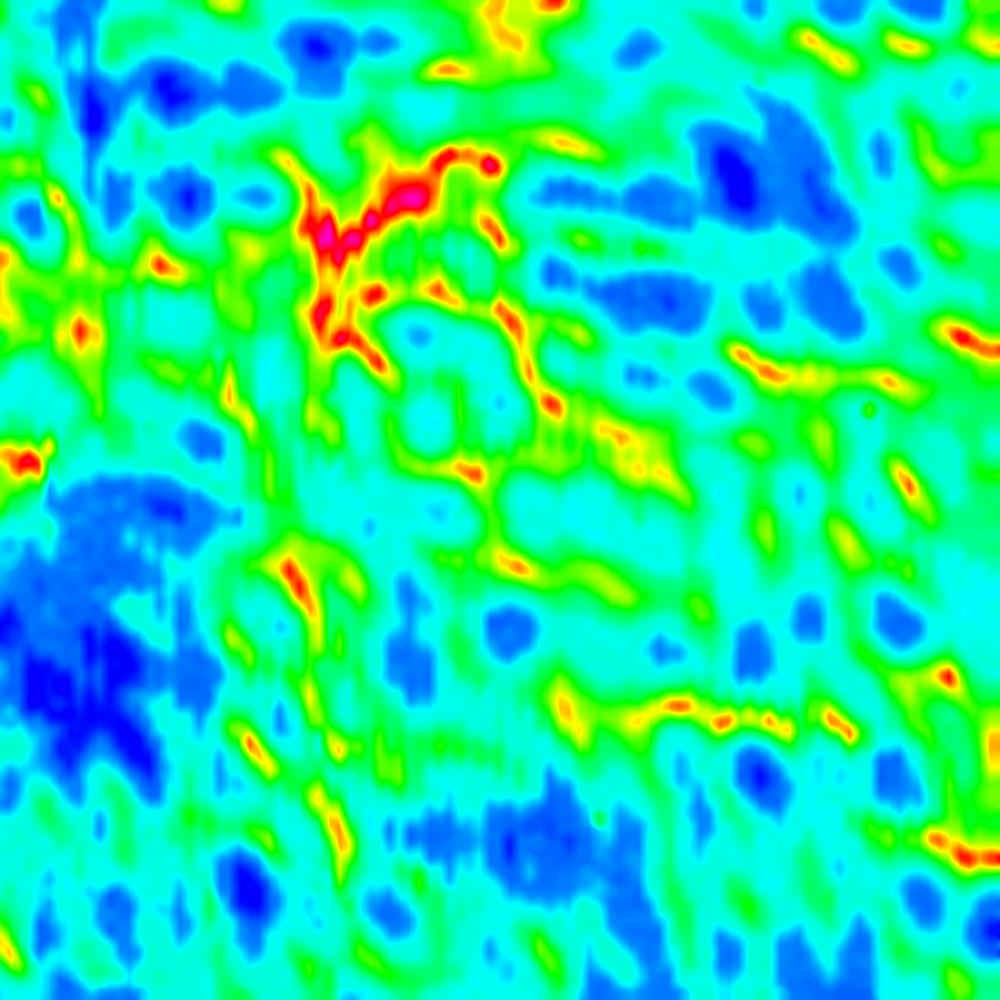
The captured video fileVery long time exposure toolAs a result of scanning, the following two-dimensional radio wave strength map was completed. The blue part shows the part where the radio field intensity is strong. Red and green areas are weak parts of radio waves.
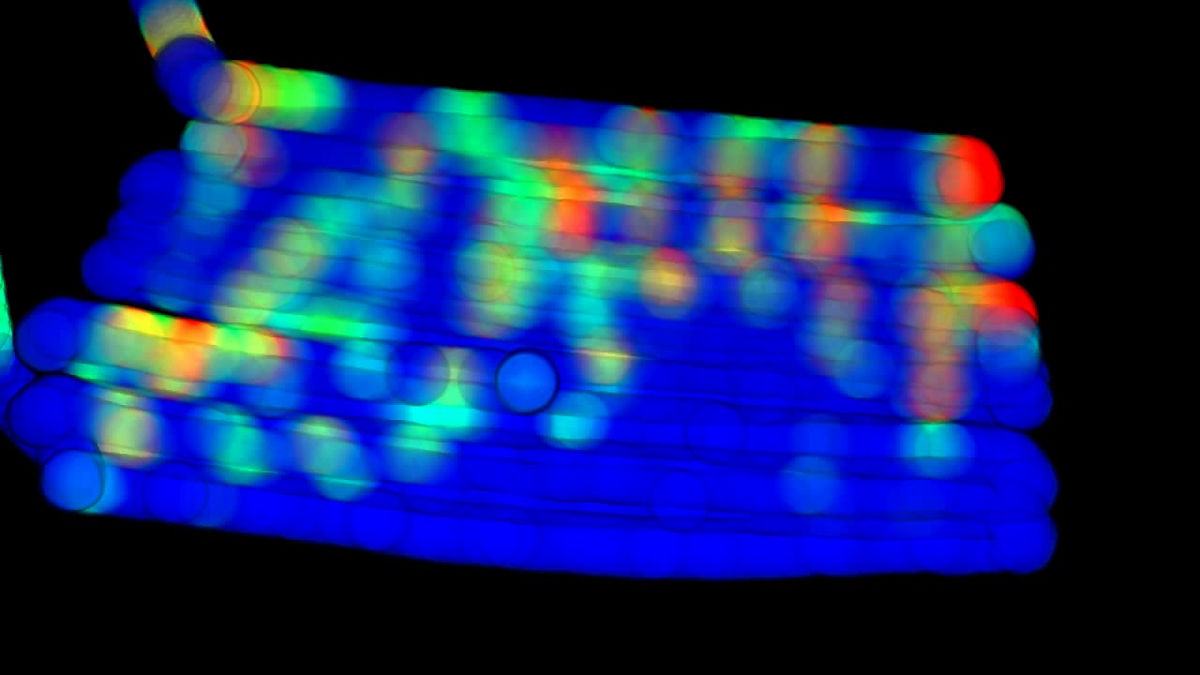
I verified it with a camera with lower performance in another place, and succeeded in creating a radio wave strength map as well. This proved that the light change of the LED light is not random.
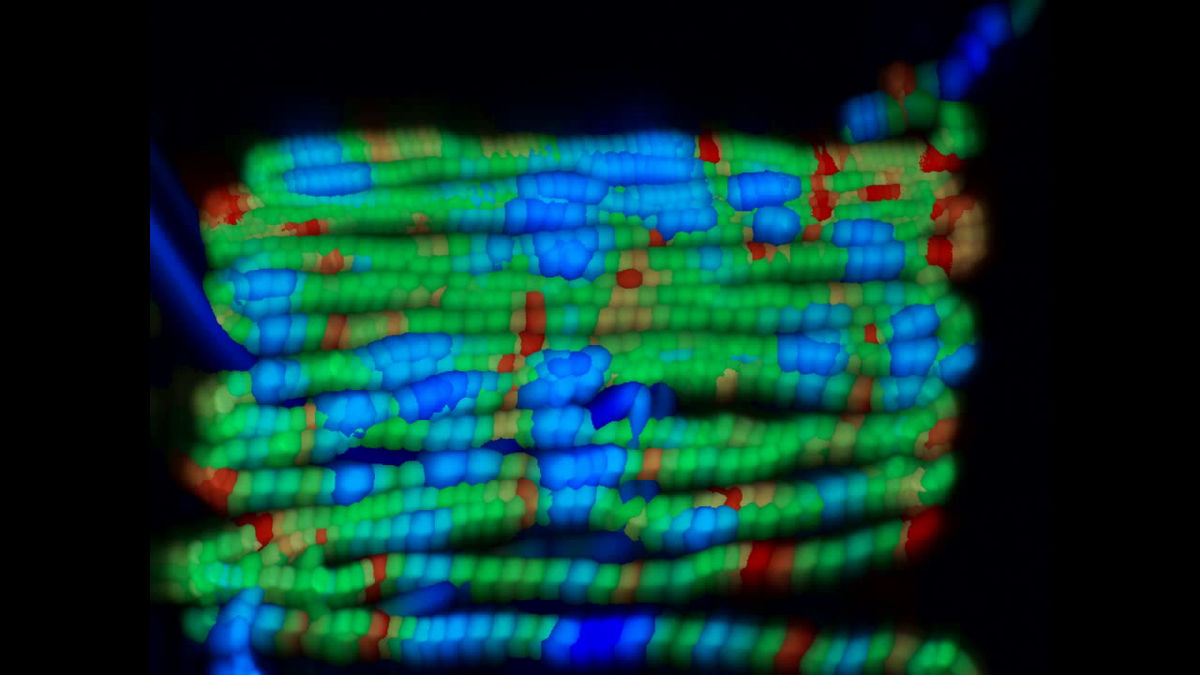
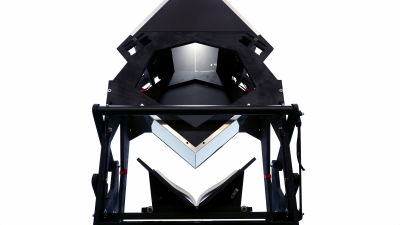
"Is it impossible to create a more accurate radio wave intensity map?", The LED light was installed on a CNC milling machine for woodworking. Recorded how to move slowly and zigzag by machine control.
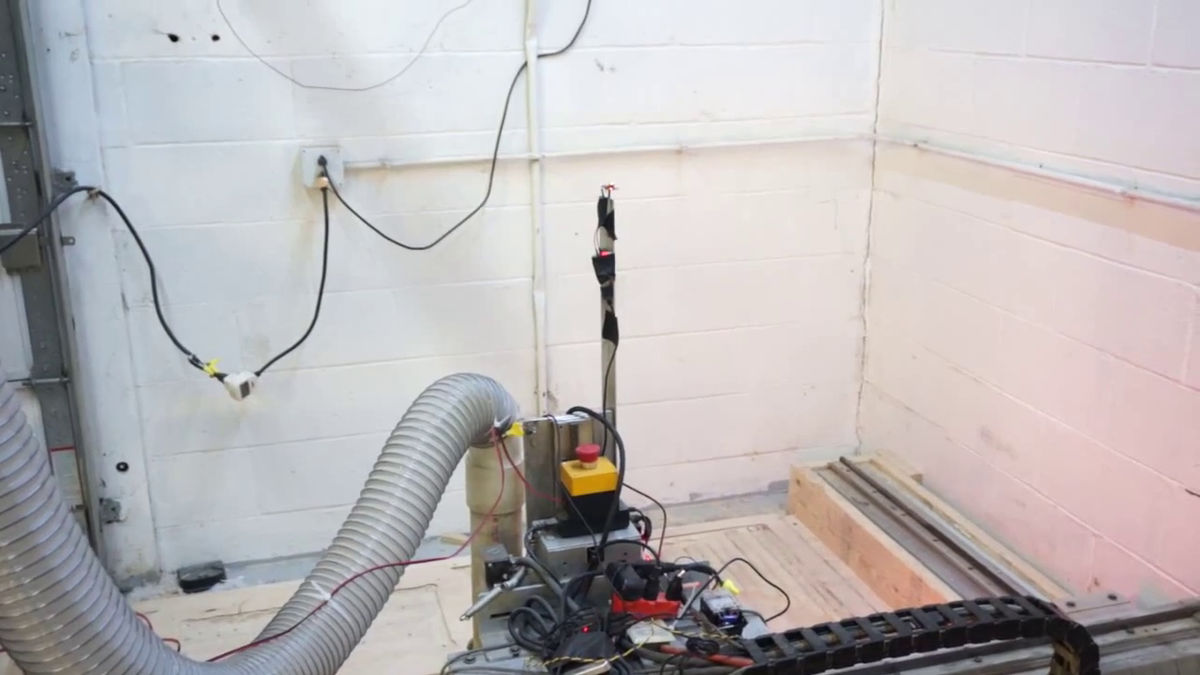
The result of synthesizing the locus drawn by the milling machine into 1 square meter by 1 cm each row is as follows. It became possible to display the radio field strength quite accurately.
However, since it was not satisfied with the accuracy in the two-dimensional map, we started to create a three-dimensional map.
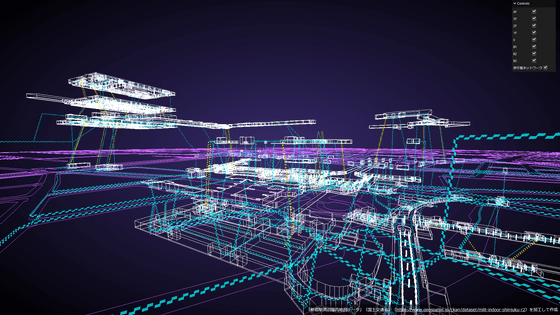
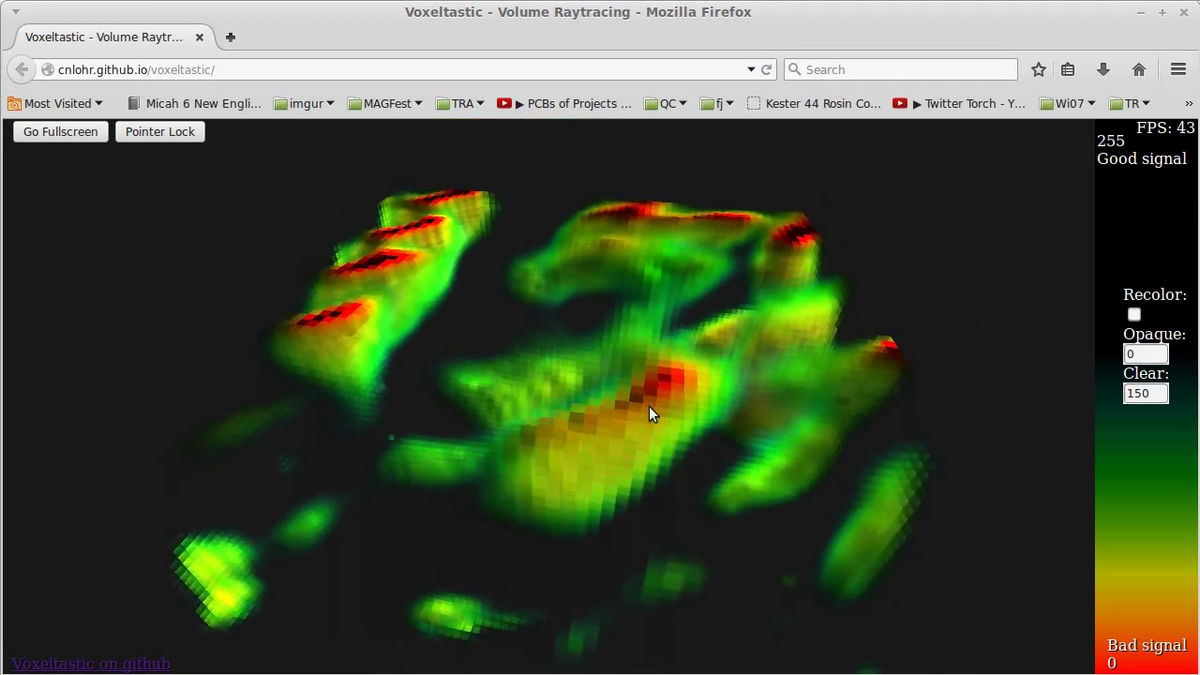
Set the Z axis for each frame from the shooting data and set the X and Y axes to the milling table. It is said that each data was captured as a 3D map of 360 mm × 360 mm × 180 mm, and even tools up to display with the browser by WebGL were created.
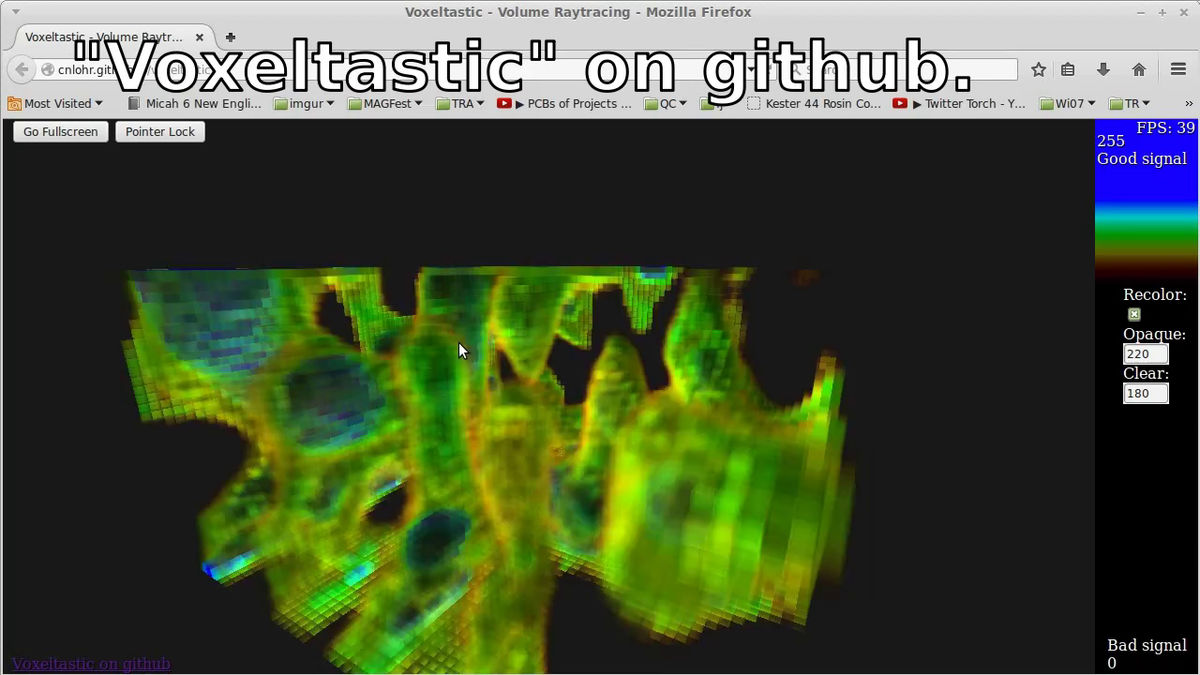
Although it is possible to change the color, it is hard to understand if it is set to red, so it is recommended that blue or purple is recommended. By dragging with the cursor, you can move the 3D map grin gully, so that the strength of the radio waves and the shape of the radio waves for each place became apparent by appearance like Minecraft. When you open the following page, you can see while actually moving the wave strength map in 3D. Because we are using WebGL, depending on the environment it will be quite heavy so be careful.
http://cnlohr.github.io/voxeltastic/
Related Posts: