"Developer Economics Q3 2014" report that reveals the terrible facts about the application business such as "2% of the whole in earning a lot of money in the smartphone application development" is released

ByKārlis Dambrāns
Do a variety of surveys centering on the world's application marketDeveloper EconomicsRegular report by "Developer Economics Q3 2014"Has been released. According to this report, developers' applications that earn a lot of money in smartphone application development have killed more than half the revenue of the entire market, and about half of developers have yet to earn 10,000 yen in a month , The reality of the smartphone application development business is revealed.
Developer Economics Q3 2014: State of the Developer Nation | Developer Economics
http://www.developereconomics.com/reports/developer-economics-q3-2014/

Developer Economics is a company conducting various surveys mainly on the application market. Regularly published reports are conducting investigations in collaboration with companies that have great influence in the IT market such as Intel, Microsoft, Mozilla, Nokia, etc. In the report "Developer Economics Q3 2014" released this time In cooperation with each company, we conducted a survey targeting 10,000 application developers, and various interesting data were derived based on it.
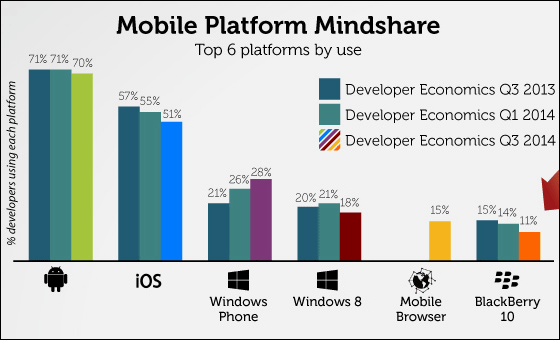
The graph showing the percentage of platforms used by developers of mobile applications is as follows. The most application developers are working on development 70% of Android, 51% of iOS at the next point, followed by Windows Phone (28%), Windows 8 (18%),Mobile browser(15%) and BlackBerry 10 (11%), while iOS is gradually lowering its market share, Windows Phone gradually increases its market share and acquires a 28% share in the latest survey You can see that it succeeded.

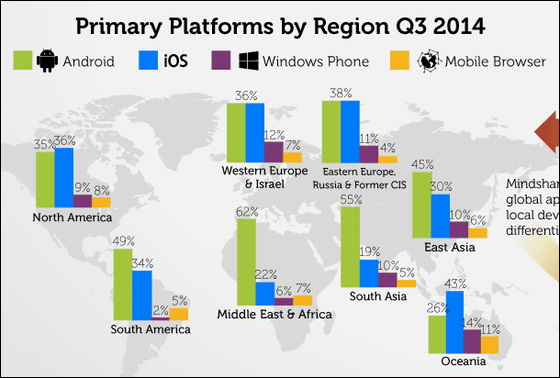
The difference in the share of major platforms by region is like this. In regions with many industrialized countries such as North America, Europe and Oceania, the share of iOS and Android is about the same or greater than the share of iOS, but Android is overwhelming in regions with many developing countries such as South America, Africa and Asia It boasts a share.

About this, Developer Economics says, "The battle for market share in the mobile platform has been successful in that iOS succeeds in obtaining the share of the majority of high-end devices, but almost all of the other shares are almost taken over by Android There is a state that it is in a state. "
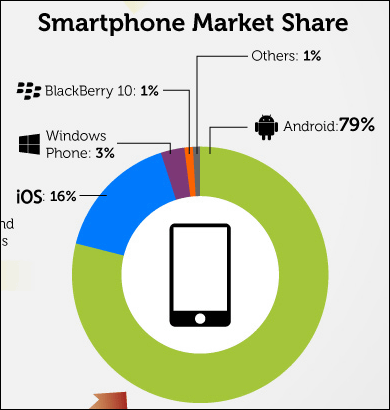
And this is a graph showing the actual mobile platform (OS) market share. In contrast to the difference in the share of the platforms that developers are working on, in real market share, there is a big difference between iOS and Android.

The following graph shows how much revenue a developer has earned from the application in a month, and 47% of the total shows income of about 1 to 100 dollars (100 to 10,000 yen) per month I understand that it is not. It is clearly impossible for developers to continue developing app development as their core business, and it is an amazing number that it is about half of the total. On the other hand, there are only about 1.6% of the total number of application developers earning more than 10,000 dollars (about 1 million yen) in a month, to developers who earn over 500,000 dollars (about 51 million yen) .

In addition, the graph below shows the percentage of each month's revenue by developers of Android and iOS. According to the graph, 50% of iOS app developers and 64% of Android app developers have very strict figures that their monthly income is less than $ 500 (about 50,000 yen). Despite the fact that the actual market share is overwhelmingly small, many developers develop iOS apps because they "make money" than Android apps as can be seen from the graph below.

The graphs segmented by application revenue are as follows. The percentage at the top of the graph represents the percentage of the total sales of the application, for example 2% of the developers are developing applications that sell over 100,000 dollars (about 10 million yen) per month, 2% It is understood from the graph that the sales of the application made by it accounts for 54% of the total sales.

More than half of the sales of the entire application is from applications created by 2% of developers, developers who earn over 500,000 dollars (about 51 million yen) in a month are the only 1.6% of the total, About half of the people have revenues of less than 10,000 yen a month, there are few middle-tier developers who earn reasonable income in application development in the smartphone application business market.
In addition, 67% of the application developers are creating applications with the main target of general consumers, 11% targeting experts, 16% targeting enterprises to develop applications . The revenue of developers who are developing apps targeting companies is twice as much as earnings earning more than 5000 dollars (about 500,000 yen) per month compared to developers who are developing apps targeting other targets, It is also clear that the rate of earning more than $ 25,000 (about 2.54 million yen) in a month will be tripled.
The graph below shows the share of development languages used by developers, the largest number of developers is used by Android application development language, also called Java, which is 42% of the total. Furthermore, looking at the languages used by developers of Android and iOS apps, 47% of iOS application developers and 42% of Android application developers are working on application development using non-native languages I understand.

Furthermore, looking at the data on the game application, 33% of the application developers have created game applications, 40% of the downloaded applications are game applications, 57% of the game applications are 500 dollars (about 50,000 Yen), 70% of developers have released less than 4 game applications, and 80% of the revenue of the entire application market is due to the game application.

This is a graph showing the tool (blue) currently used by game application developers and the tool (light blue) used before that. According to this graph, the most widely used toolUnityHowever, you can see that the percentage of developers who develop game applications without using special tools is considerably high at 42%.

According to the survey of Developer Economics, it has been found that there is a strong correlation between the use of tools and the income from application development, and if you develop applications using many tools, Results have shown that sales will increase rapidly and it is a very important element to make application development using third party tools to make the application business successful.
The graph below shows the number of applications released so far and the amount of income from application development. The vertical axis represents the number of applications released so far, and you can see that developers who release many applications get more income from applications.

Related Posts:
in Smartphone, Posted by logu_ii


