"Stack Overflow Developer Survey 2016" which summarizes statistics of developers around the world such as "I like jobs more the more salary", "Frequently used programming language" "Development environment" "Developer history" "OS"

ByAlper Çuğunun
It is a "knowledge community" that exchanges information on computers and programmingStack OverflowThere are always many questions from all over the world, and there are also many postings to reply to it. Questions are sent to the site at a rate of one per 8 seconds, and by 2015, as many as 56,303 developers are answering the questions, Stack Overflow has asked 45 respondents to questionnaire survey We conducted a survey on what kind of users are using the service.
Stack Overflow Developer Survey 2016 Results
http://stackoverflow.com/research/developer-survey-2016
In announcing this statistic Stack Overflow says, "The survey is not perfect, although the influence is less due to the large number of samples, there are users who can not use English or who do not want to be investigated in English Because of that, biasing (bias) exists in the contents, "and announces the numerical value.
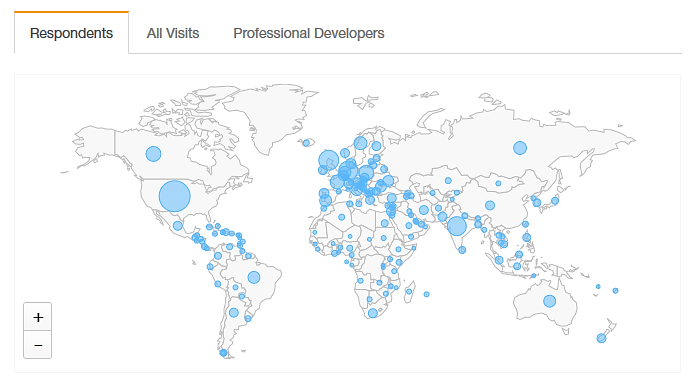
So, first of all, distribution of users using Stack Overflow. This statistic is sometimes taken with the English version of Stack Overflow, and it seems that there are still the largest users in the United States. Then it continues with European countries, India, Australia and others, and it is found that the balance is distributed with almost the same balance including Japan.
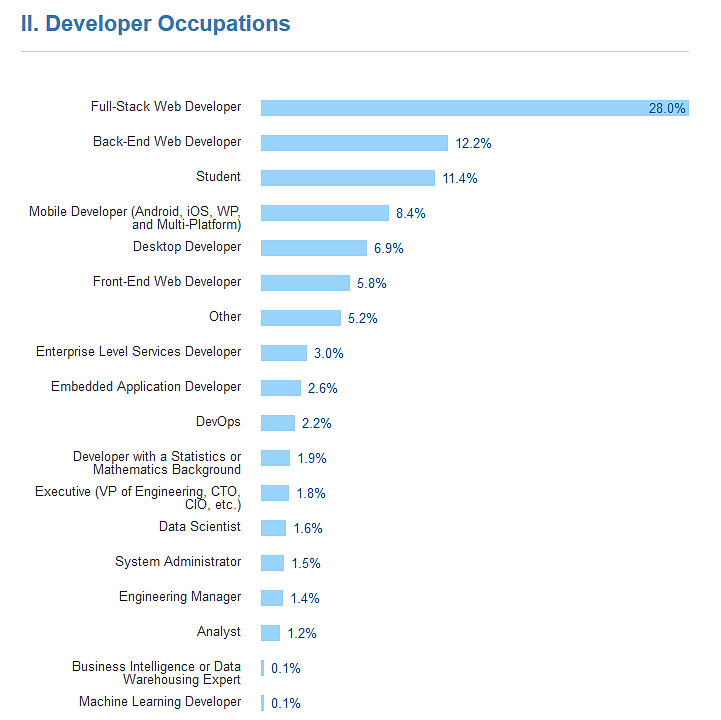
Looking at the job title of the developer, 26.0% of the web developers of the full stack (can do all stages of work) are the most frequent, followed by the back-end web developersA studentYou can see that it is ranked in.
As a result of asking languages and environments frequently used by occupation type, JavaScript is ranked first.
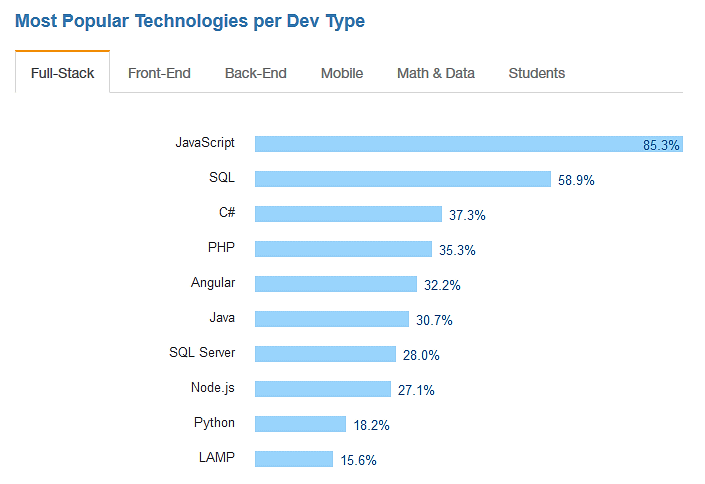
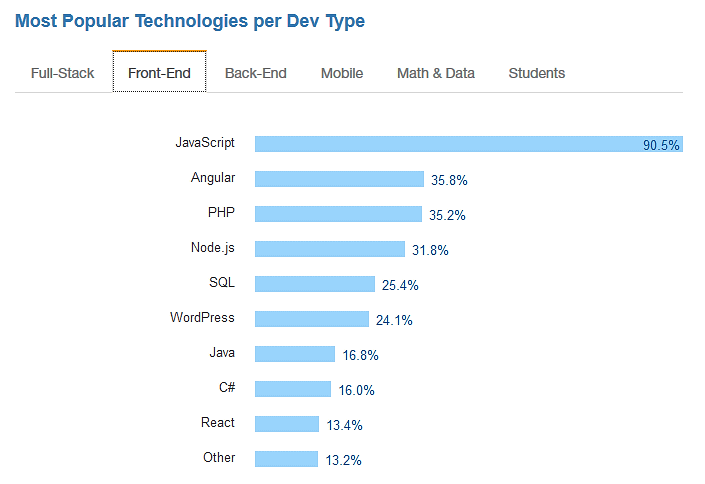
Even JavaScript on frontend people.
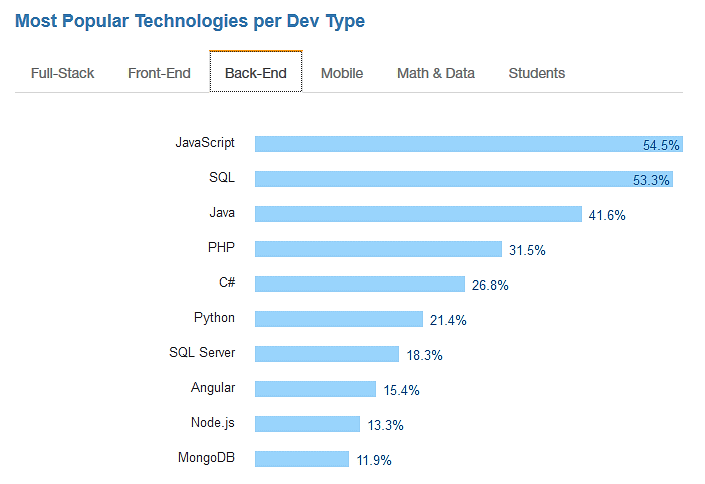
The backend is JavaScript, but SQL ranked in second
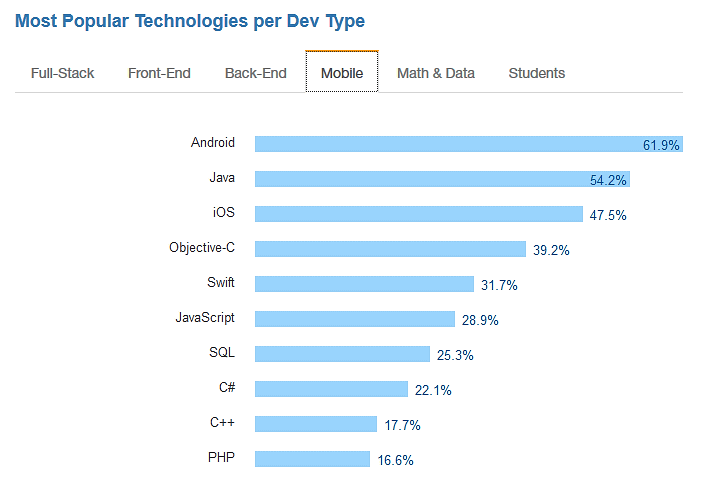
Android is ranked first in mobile, but Java and iOS are not so open.
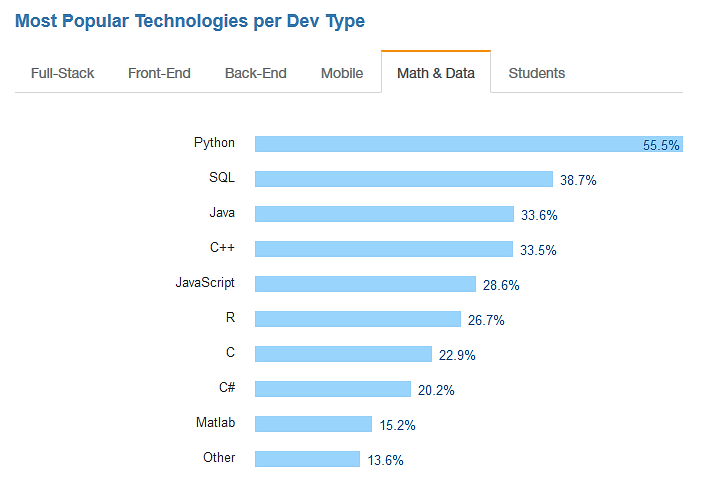
As mathematical data analysis related, Python makes a breakthrough top.
If you are a student, Java is the best place to control JavaScript.

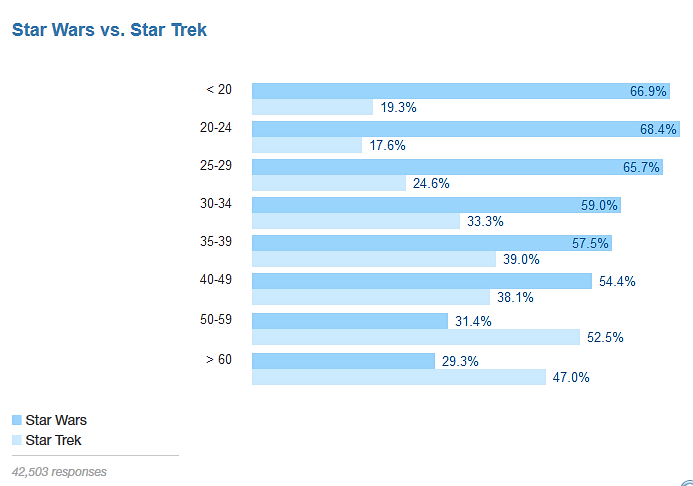
Somehow the mysterious question "Star Wars or Star Trek?" The result is that it is also interesting that it is beautifully divided such as Star Wars for the lower generation and 50th generation as the Star Trek with 50's as the border.
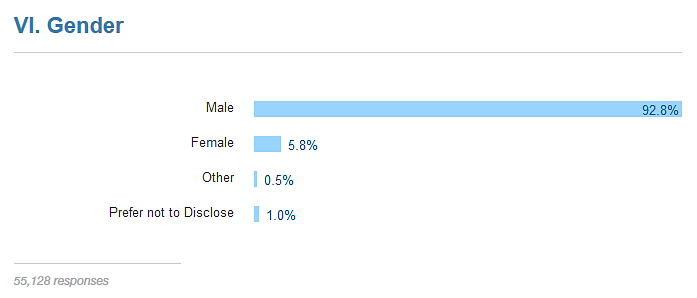
The gender (social and cultural gender) seems to be overwhelming by men, 92.8%.
Looking at the years of experience by gender, the number of people with "experience 2 to 5 years" is the most common in both men and women, but it is visible that men account for a large number of people with many years of experience.
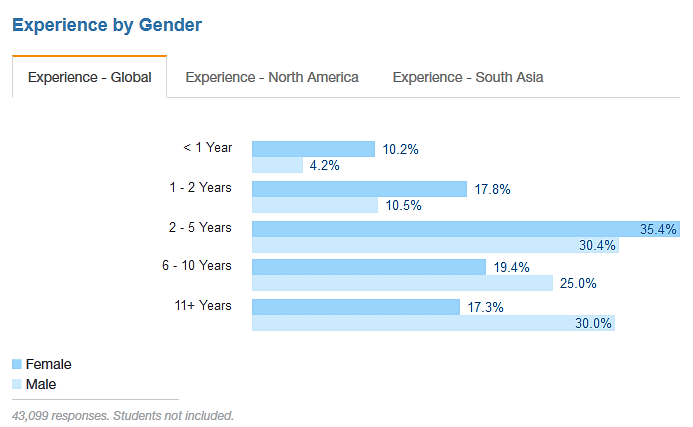
This is almost the same in North America, but ...
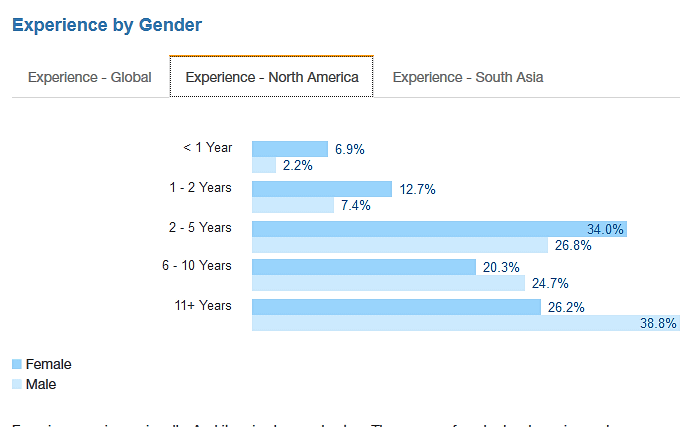
As far as South Asia region is concerned, people with more than 6 years of experience have decreased markedly.

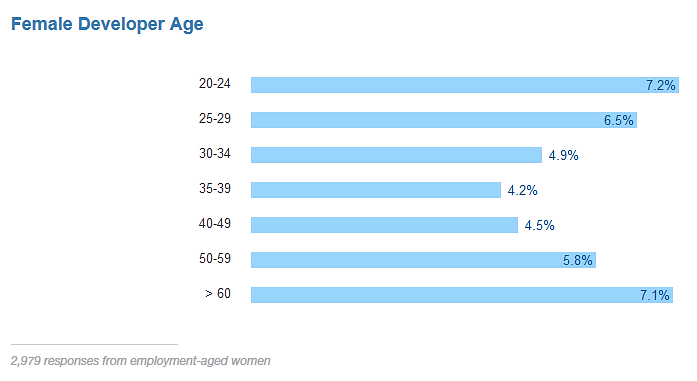
Age distribution of female developers is like this.
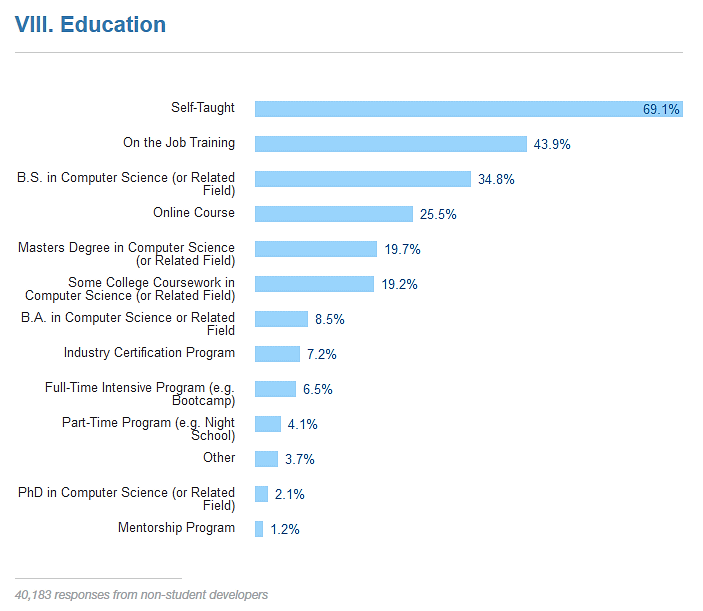
When asking about education to acquire ability, the person who learns most is 69.1% who will learn by oneself.
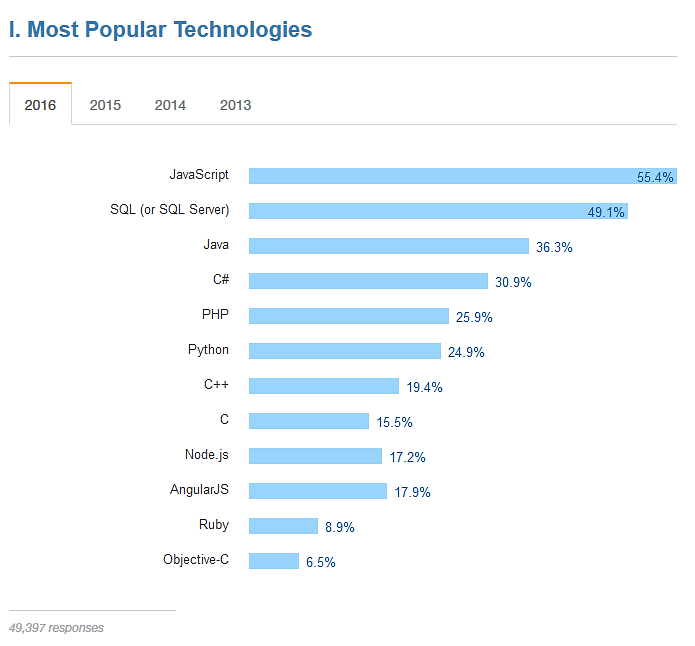
Looking at the rankings of popular development languages and development environments by year, we can see that JavaScript was ranked first in 2016 ... ...
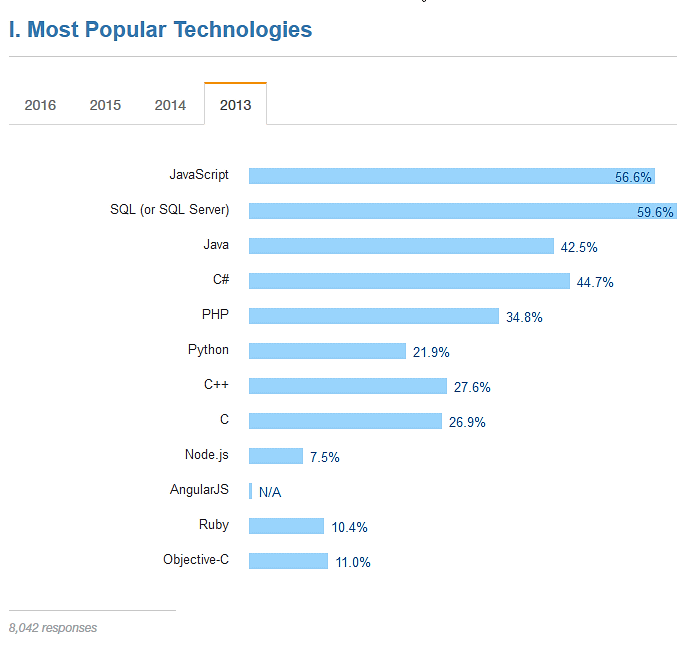
As you go back in 2013, you can see that SQL (or SQL Server) was the first place.
Stack Overflow trends in development language · environmentReact. AndSpark,SwiftAnd continue.

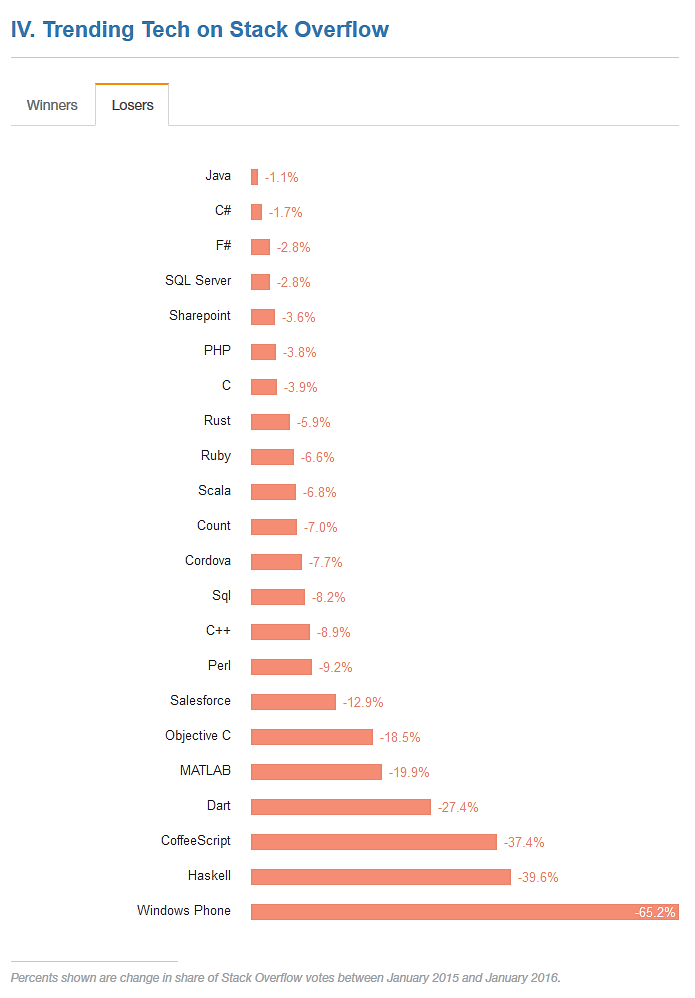
On the contrary, the development language and environment that has left the trend is here. Although it shows that the decline rate is higher as going downward,HaskellYaWindows PhoneThe activity's activity seems to be decreasing.
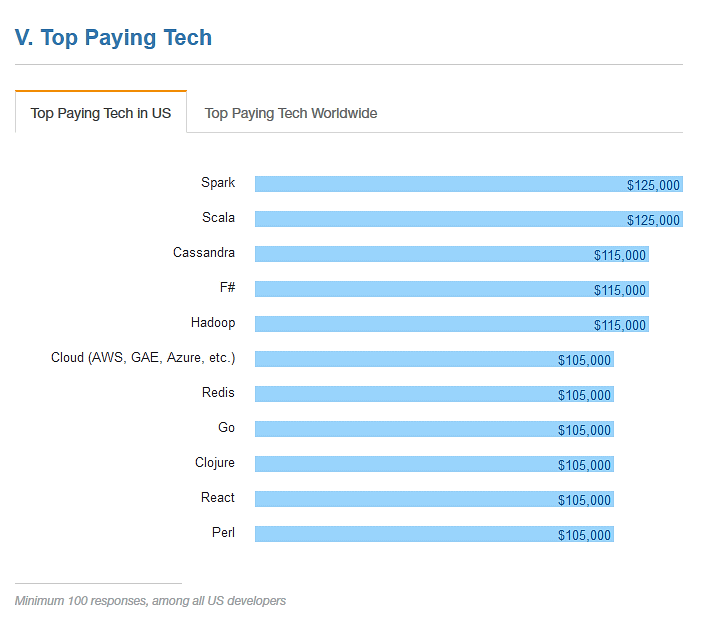
In the United States, the top of "Most Payable Development Language / Environment" is Spark.
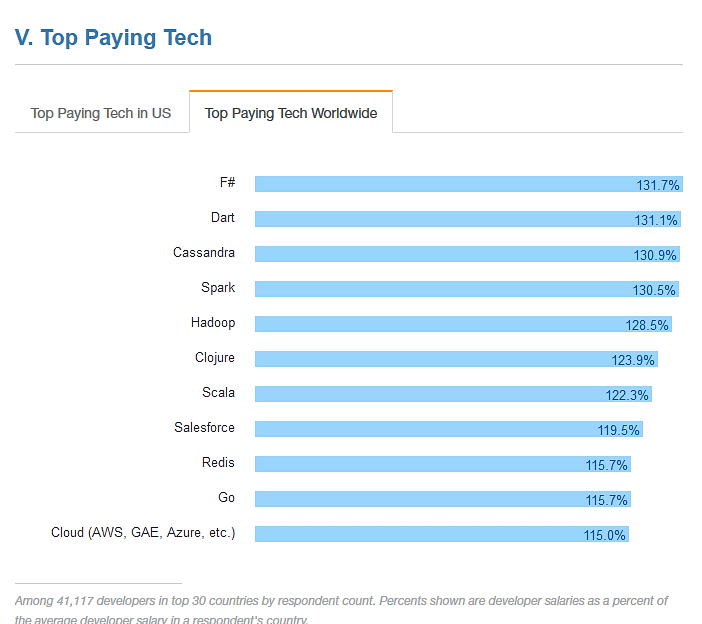
Looking at the world level,F #It is the most efficient pattern. Furthermore, the graphs in the US and the world have different indices.
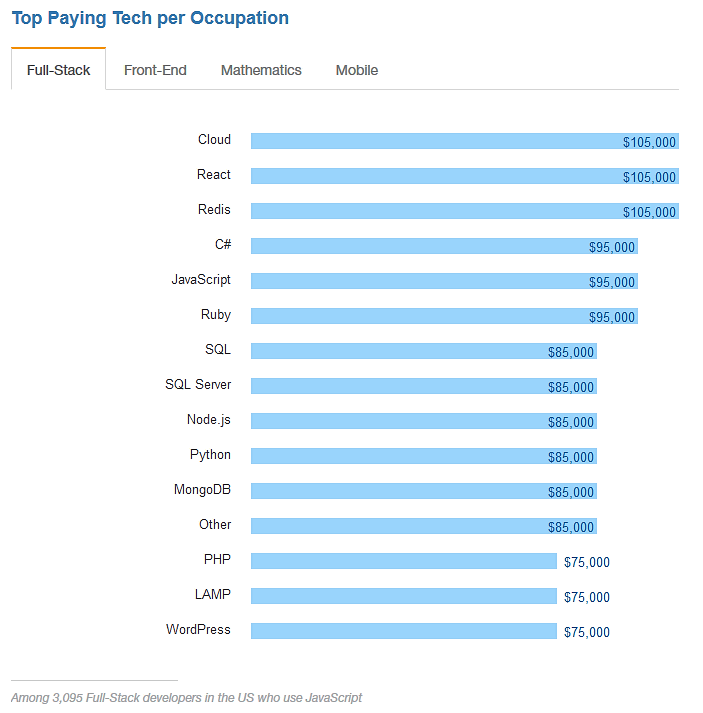
The work of the field which is most profitable for each job category is cloud related in the case of full stack.
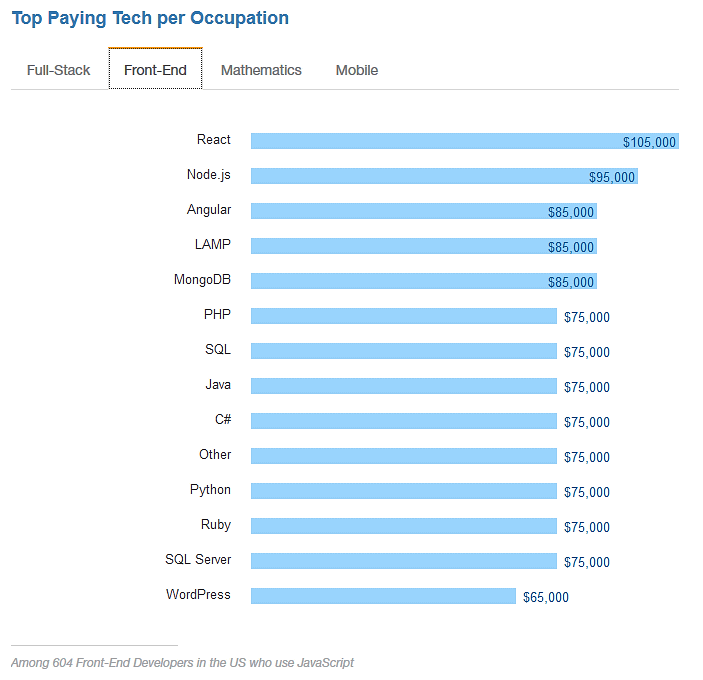
React as a front end
It is related to numerical analysisScala

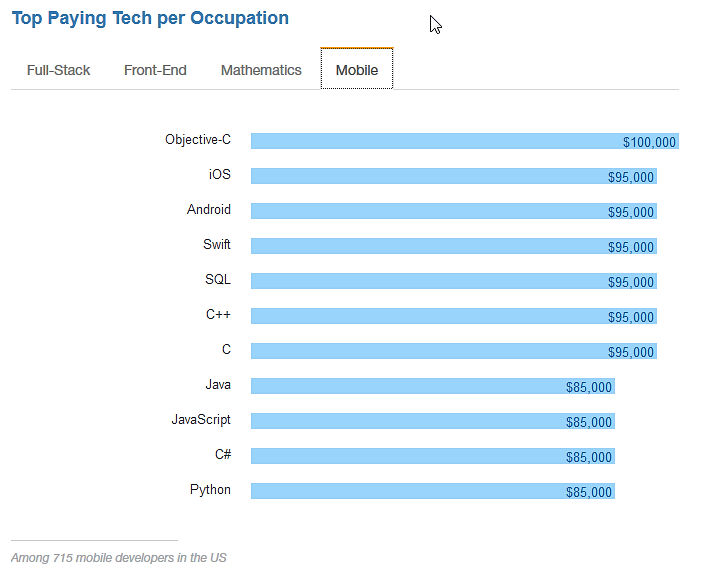
Should I call it mobile-relatedObjective-Cwas. It is also interesting that iOS and Swift have names on top.
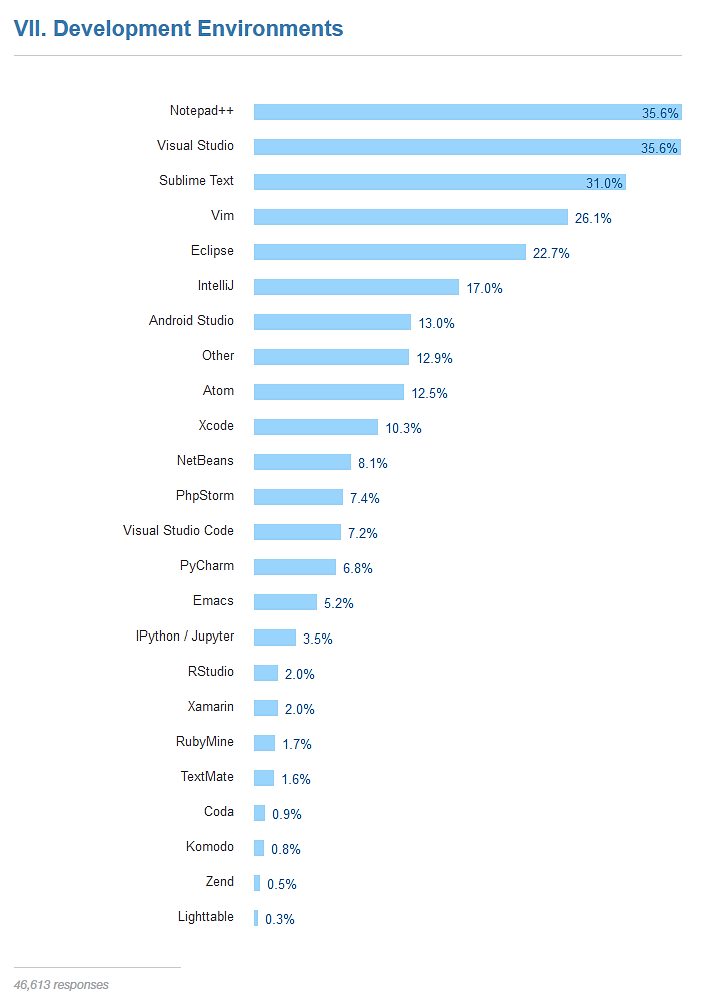
The most used in the development environment,Notepad ++And MicrosoftVisual Studio.
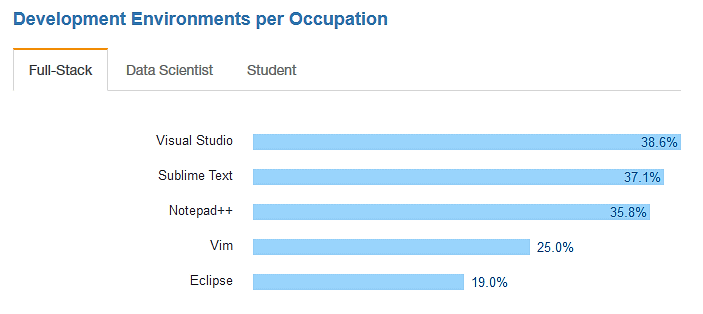
The development environment also changes depending on the field. Many people use Visual Studio for full stack ... ...
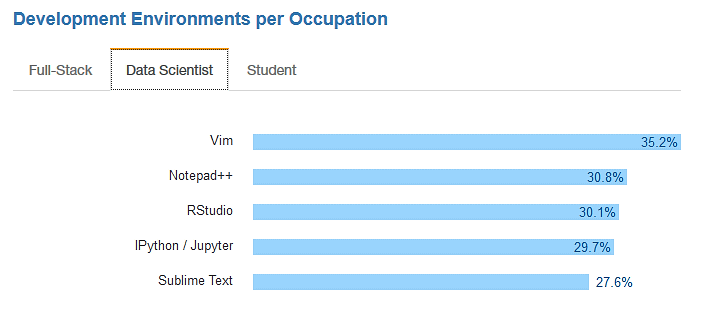
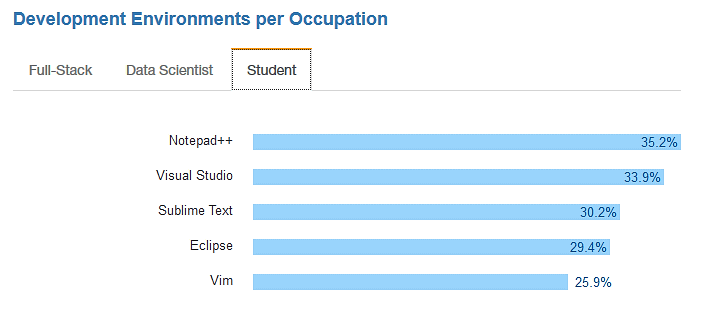
In case of data-related technicianVimIt is popular.
The student was in the style of Notepad ++.
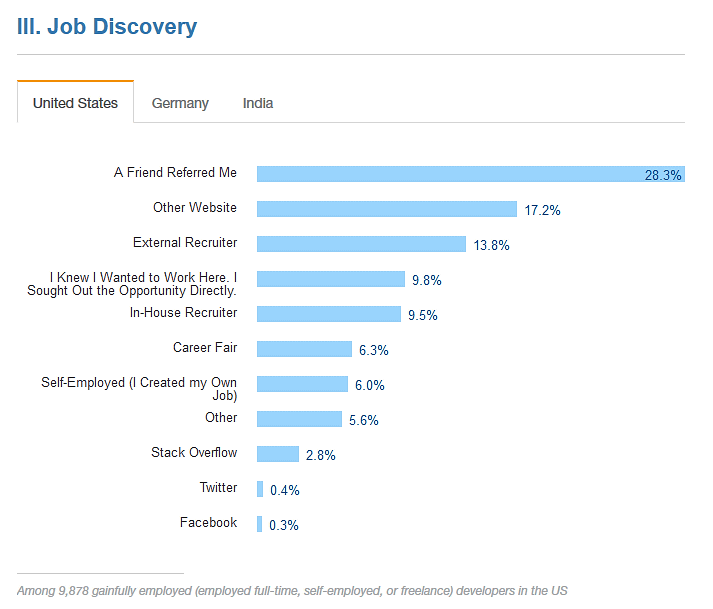
Statistics are also given about the chance to get a job. It seems that the introduction of acquaintance in America tells the most things.
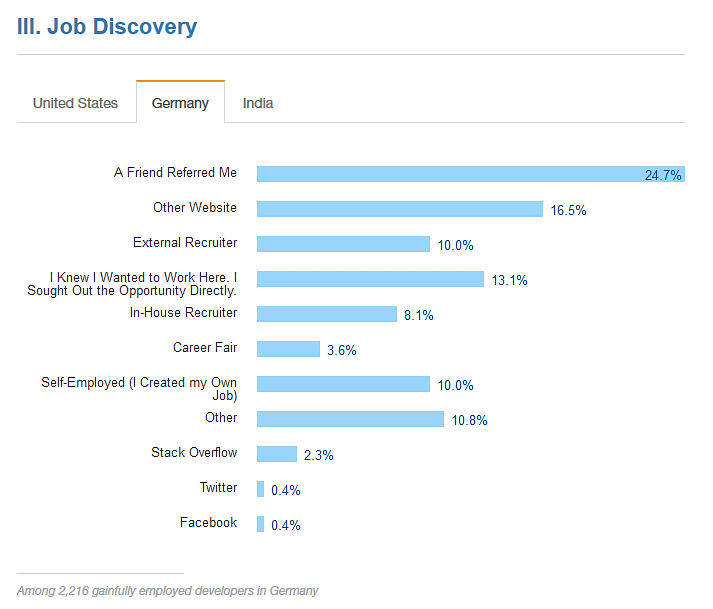
This is the same situation in Germany. Compared to the United States, there are also many people who go on to sell themselves directly to companies.
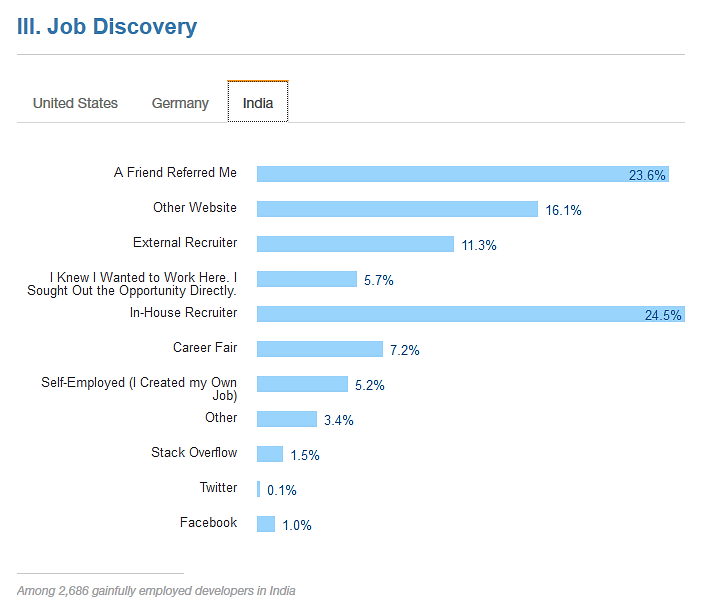
When it comes to India, introduction of acquaintances is also effective, but furthermore it seems that the influence of "In-House Recruiter (internal recruiter)", that is, the personnel affairs inside the company is more significant.
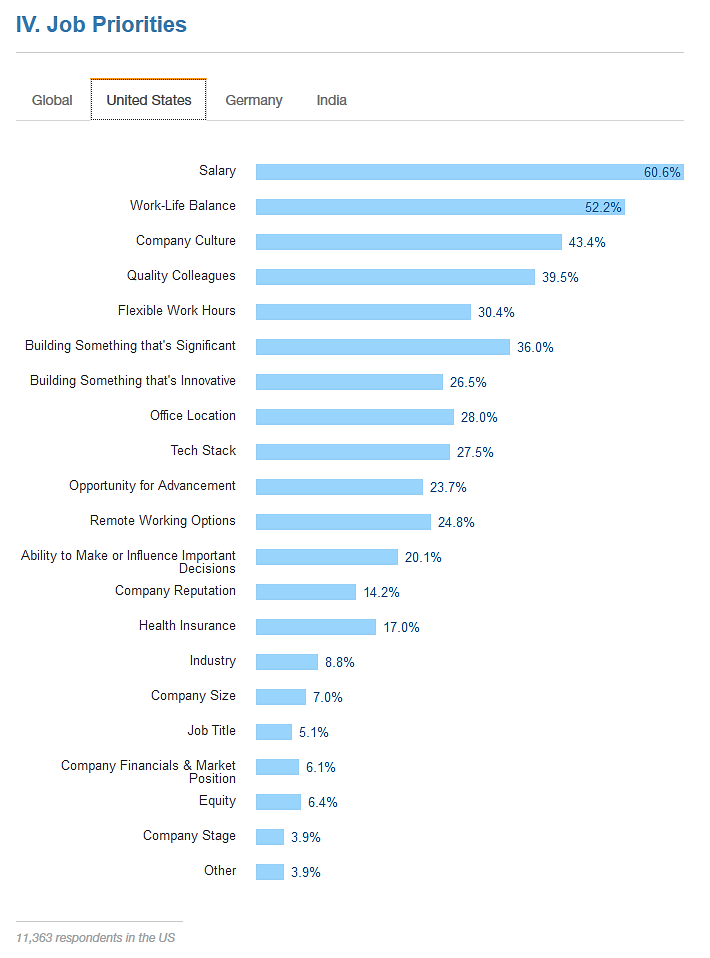
What we emphasize at work is that "Salary" is the top in the world level, the second place is "work life balance", and the third place is "internal culture".
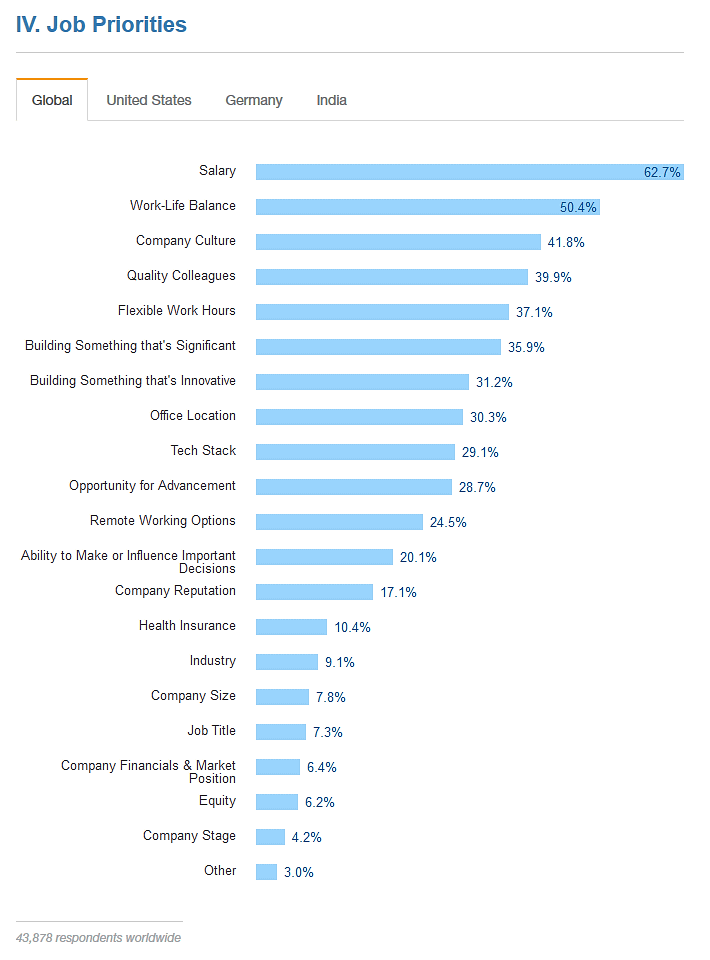
America is almost the same situation.
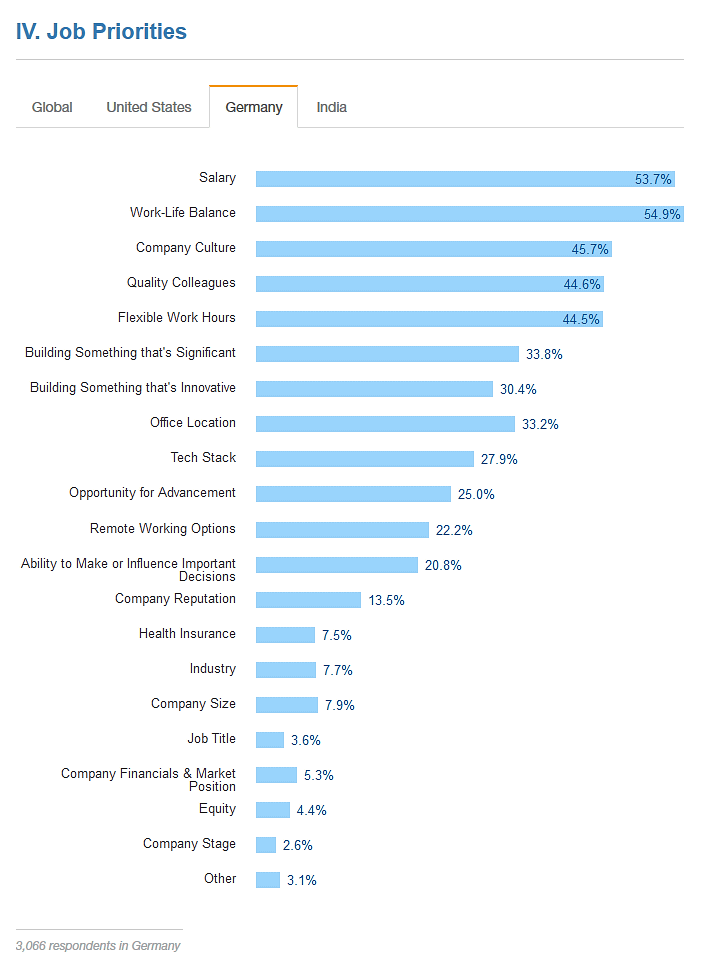
However, Germany has resulted in more people who emphasize work-life balance than salary.
It is like this when graphing the proportion of people who emphasize salary (vertical axis) and the actual salary level (horizontal axis). As a whole trend, we see a very interesting tendency that salary increases as the rate of emphasis on salary decreases.

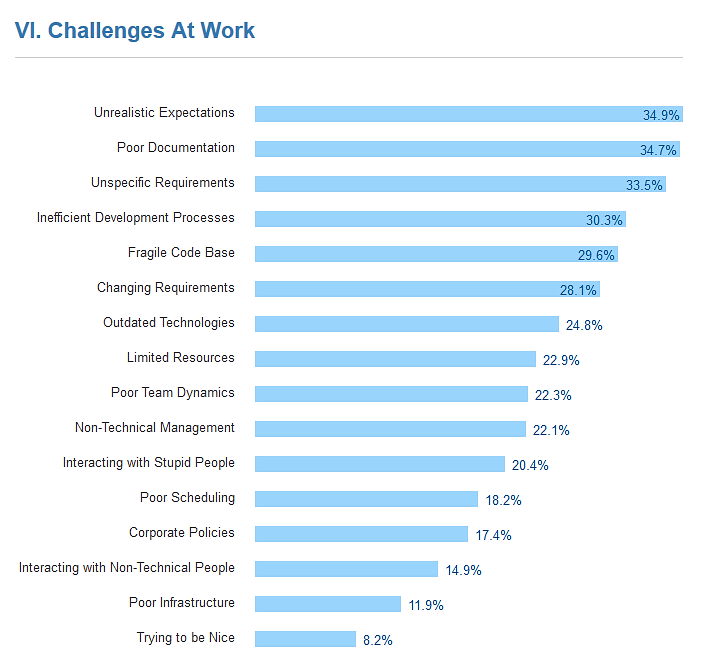
When you mention the hardest things at work, everyone experienced once as "unrealistic expectation", 1st place as "poor documentation", 2nd as "poor documentation" and 3rd as "unclear request" It is convinced that items are lined up and that the same thing happens anywhere in the world.
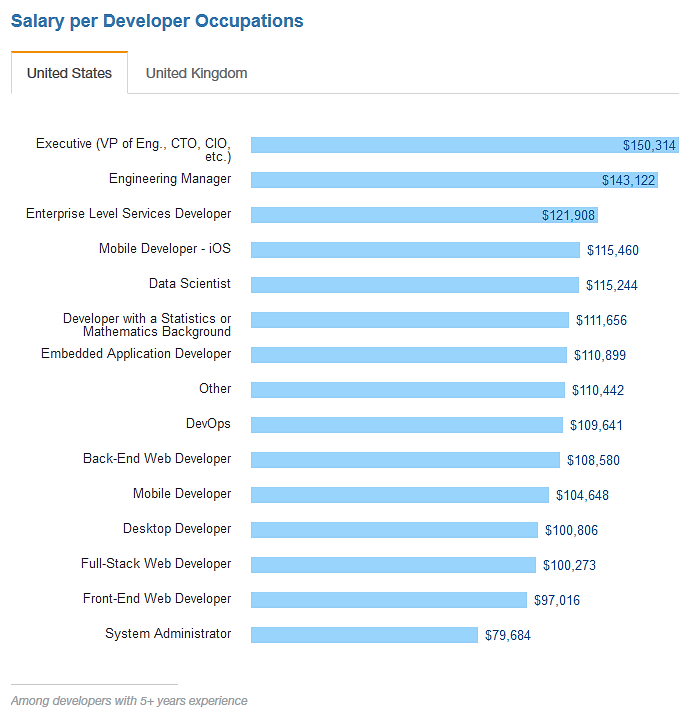
Looking at the amount of income for each type of job, the top is the technical superintendent's position, such as CTI and CIO, and it is about 150,000 dollars (about 17 million yen). Below that is followed by engineering managers, enterprise level service developers, mobile developers and so on.
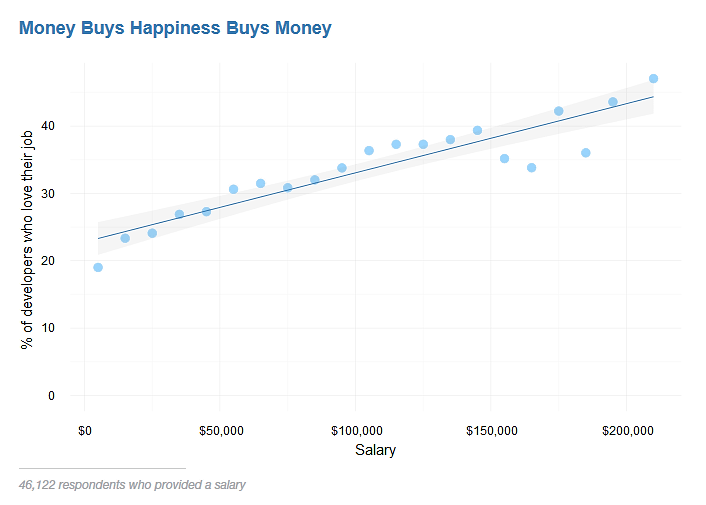
Graphing the proportion of those who like work (vertical axis) and the amount of salary (horizontal axis) gave an easy-to-understand result that they liked work as salary rises.
These statistics show the actual condition of the user in the Stack Overflow, but it seems to be said that this data can be said to be valuable data which can be touched quite interesting reality.
Related Posts:


in Note, Posted by darkhorse_log