"Wattvision" to visualize electricity usage of household appliances using smartphones

Although we may refrain from using the cooler to suppress the power consumption or turn off the electricity frequently, it is hard to grasp the image unless we actually confirm the amount of electricity consumption actually reduced by that in real time. So I made it easy to understand the amount of electricity used "Wattvision". You can see real-time power usage from PC and smartphone, and you can see which appliances consume the most power. Compared with usage on the previous day, you can refrain from using electric appliances towards the decided goal.
Wattvision - The Smart Energy Sensor by Wattvision - Kickstarter
http://www.kickstarter.com/projects/wattvision/wattvision-the-smart-energy-sensor
The movie is from the following.
Wattvision is an application that makes it possible to understand power usage in a building at a glance.
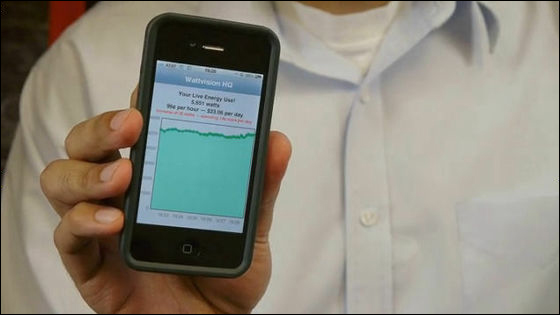
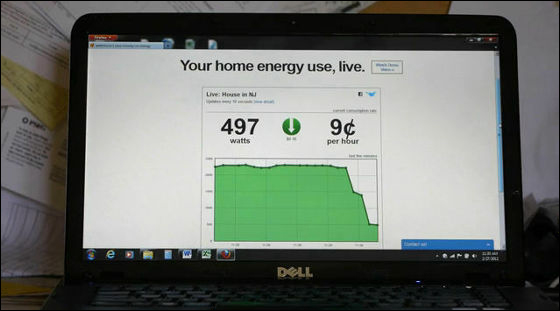
You can see real-time power usage on PCs and smartphones.
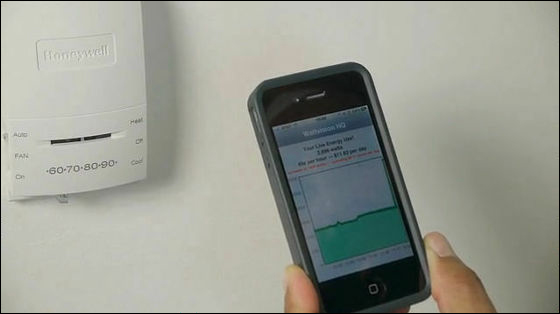
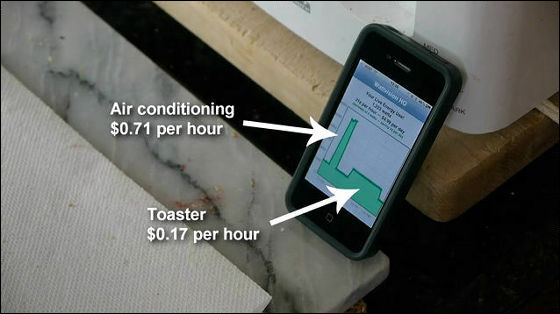
First, let's try using the air conditioner. You can see that the amount of electricity used constant from the green graph suddenly sprang up.
Next I will use a toaster.
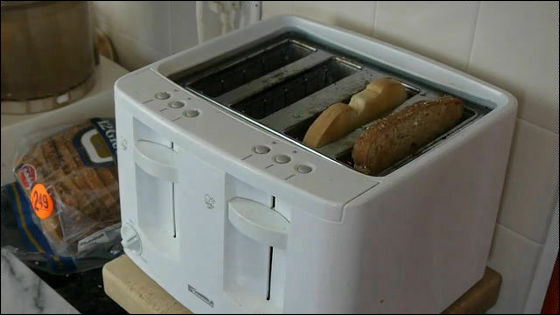
Then the graph looks something like this. When using the air conditioner, the cost was $ 0.71 / hour (about 56 yen) per hour, and for the toaster it costed $ 0.17 / hour (about 13 yen).
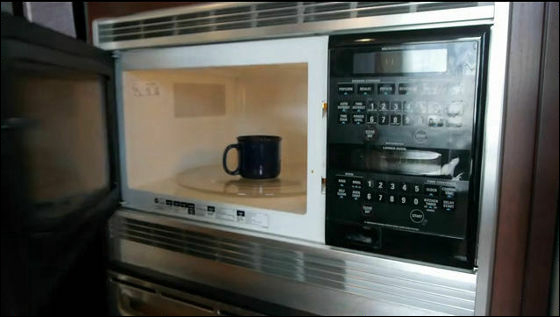
Next is a microwave.
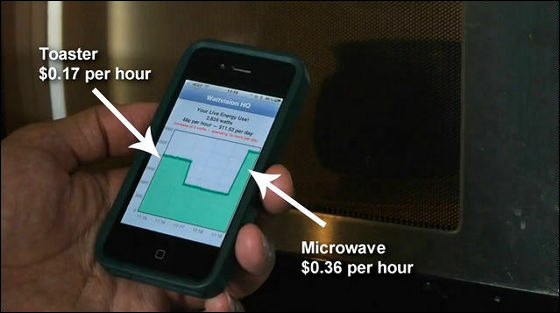
The microwave oven cost more than the toaster, it is $ 0.36 per hour (about 28 yen).
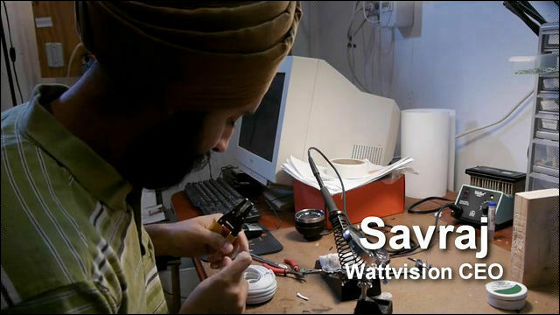
These three people made Wattvision. Software engineer Diego from the left, Savraj from CEO, Zack from business development.

McKinsey ReportAccording to the United States, the annual electricity usage cost is US $ 130 billion (about 10 trillion yen).

However, few people live while conscious of the electricity and cost actually used. That's why "Wattvision" was created as a positive action to reduce power usage.

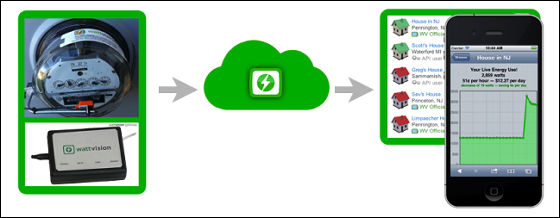
Collect data by attaching such a set of feelings to the meter.
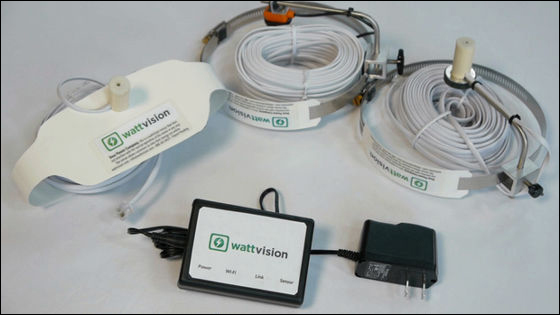
Setup is simple, first install the energy sensor on the meter.
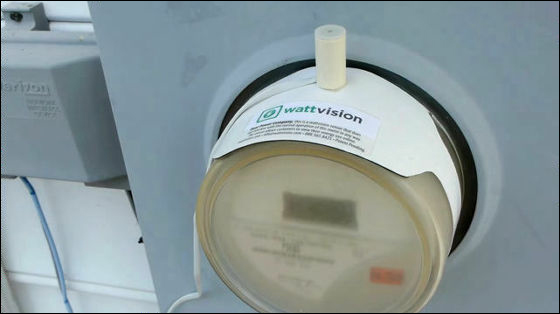
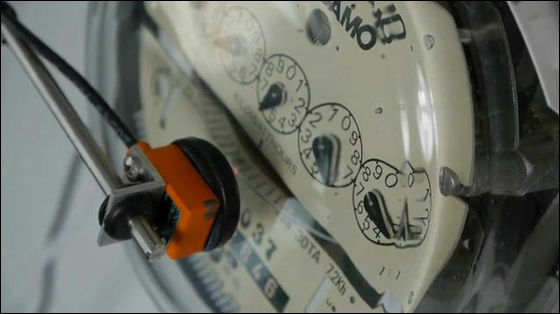
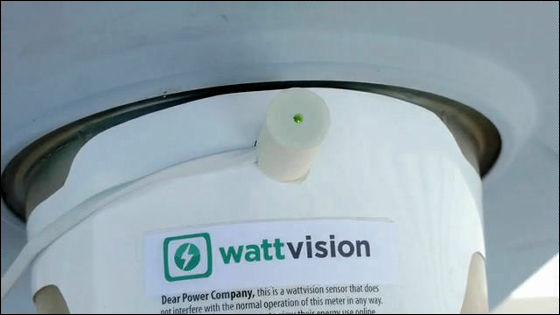
Then connect the gateway to the network OK.
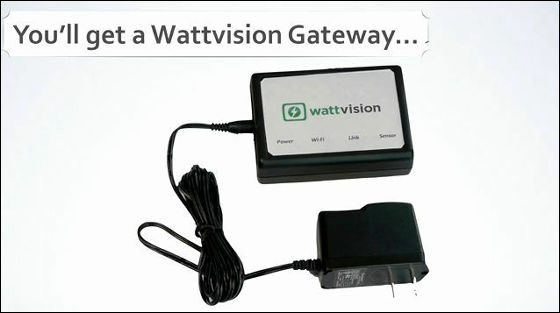
Cloud service makes it easy to see power consumption and cost from PCs and smartphones.
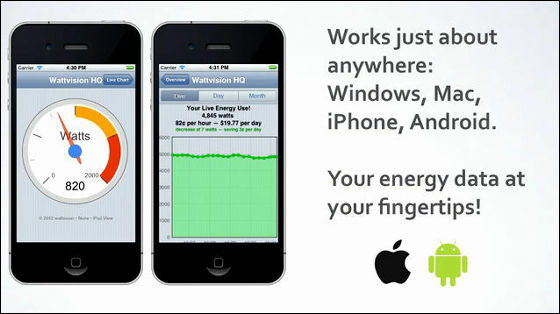
Applications can be used on Windows, Mac, iPhone and Android.
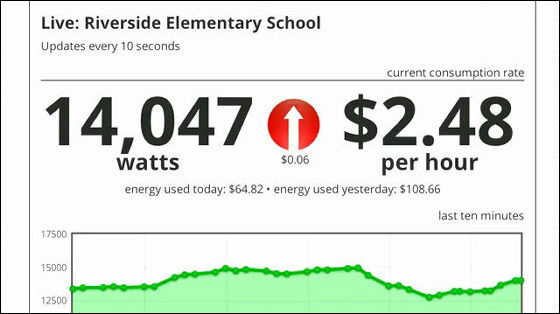
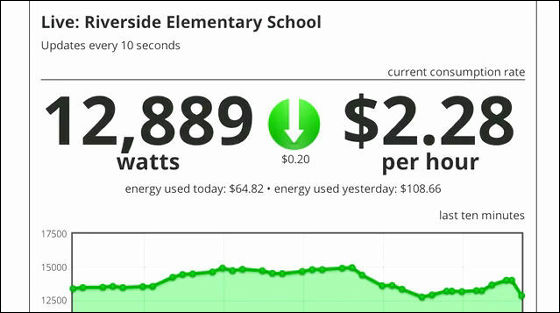
You can see real-time fluctuations in power usage in this way. The data was updated every 10 seconds, the electric power used increased as compared with 10 seconds ago ...
You can see at a glance that it is going down. It also describes the amount of electricity used on the day and the amount used the day before, it is also possible to set a goal and refrain from using electricity toward it.
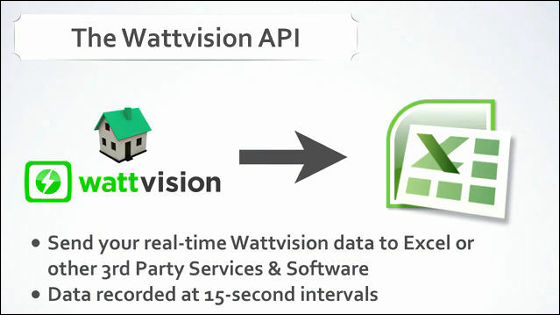
Data is recorded every 15 seconds and can be received by Excel file etc.
Also, share the data and compare it with data of similar households, so you can see that your home's electricity usage is high or low.
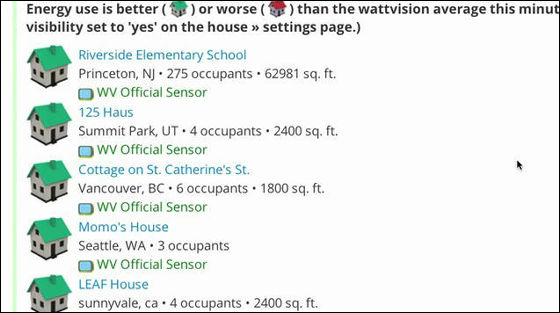
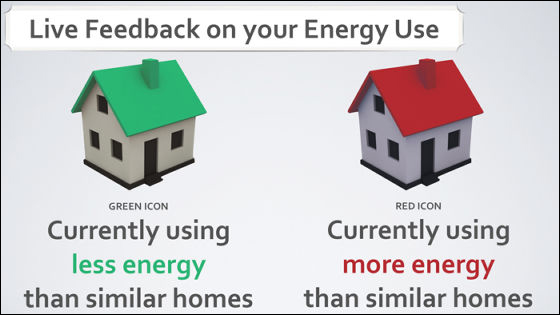
In this way, house with low power consumption is displayed in green, many house is displayed in red.
Currently, Wattvision itself is complete and we are developing Wattvision 2, but we need funds to complete this Wattvision 2.

That's why we can get one Wattvision for 225 dollars (about 18,000 yen) while we are currently recruiting equity funds at KickStarter, with a limited amount of $ 175 (about 14,000 yen) There is also a set of 175 dollars (16,000 yen), and if you increase the investment amount you can also increase the number.

The deadline is Japan time on Thursday, September 13 (Thursday) at 1:05 pm.
Related Posts:
in Mobile, Web Service, Hardware, Video, Posted by darkhorse_log


