A page that animates the transition of the epicenter on Google Maps
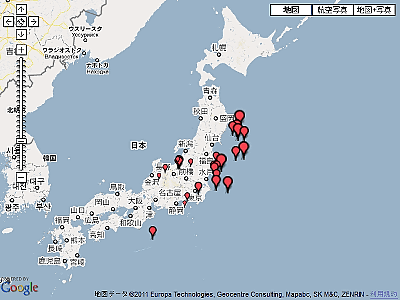
Japan Weather Association's "Earthquake InformationBased on the data on the page, a page that shows how the epicenter is moving on the Google map is easy to understand.
Browsing is from the following.
Trend of epicenter
http://www.rubyist.net/~ko1/eq/gm.html
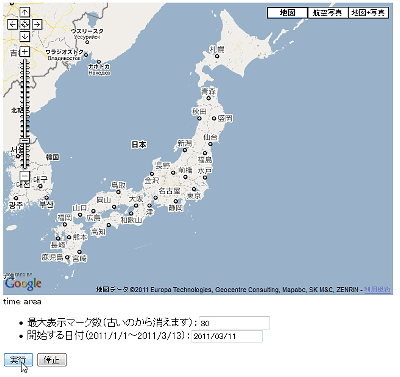
When you click "execute", the epicenter will be displayed in order
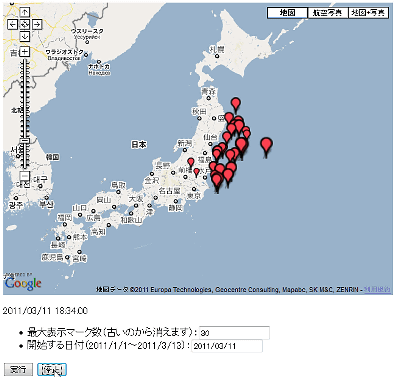
By default, 30 items are displayed and disappearing from the oldest one in order, so you can understand intuitively how the epicenter is moving.
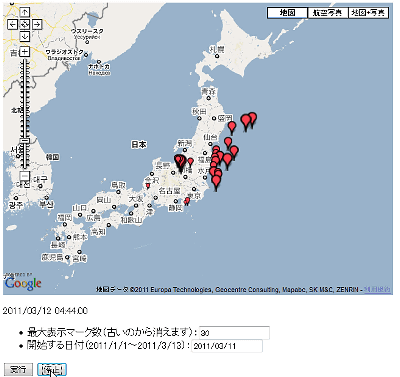
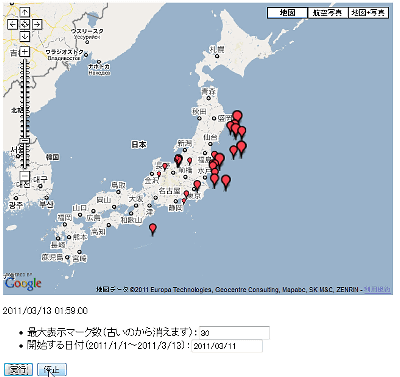
Apparently it's going southward, you can read from this data.
Related Posts:
in Web Service, Review, Posted by darkhorse


