Graph showing how many inch TVs were sold in the age in America
It is a graph showing the size of television in America selling well by age.
Generally in Japan it is said that 32 to 42 inches are the mainstream, but what size sizes are sold well in the United States?
Details are from the following.
This is a graph showing the number of units sold per inch.
TV Size Over the Past 8 Years | FlowingData
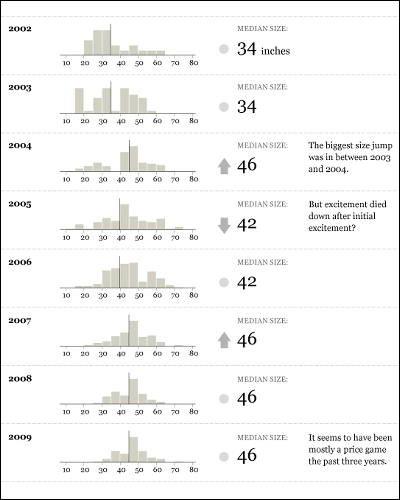
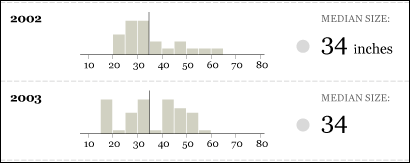
A graph from 2002 to 2003. As of 2002 there seems to be someone who buys a large television of 40 inches or more, but the mainstream is less than 35 inches. In 2003, the number of televisions sold for 40 inches or more has increased sharply, but TVs under 35 inches are still sold still.
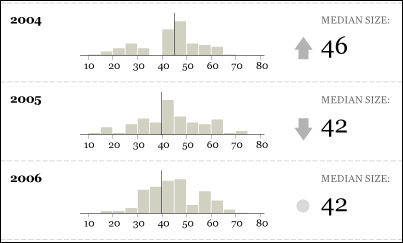
2004 to 2006. In 2004, the number of units sold below 40-inch will drop sharply and the average size will rise to 46 inches. In 2005 and 2006, sales of 30 inch to 40 inch TVs increased, and the average size was 42 inch.
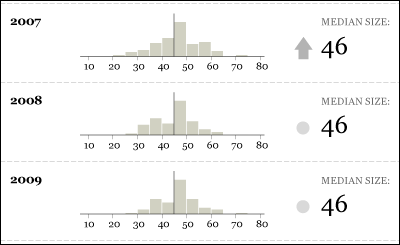
From 2007 to 2009. From 2007, 45-inch to 50-inch graphs are in the shape of a mountain and the average size rose to 46 inches.
It seems that television which is bigger than Japan is becoming mainstream in the United States. Is it related to the size of the room?
Related Posts:


in Note, Posted by darkhorse_log