Access analysis tool "User Insight" which understands user's action at a glance
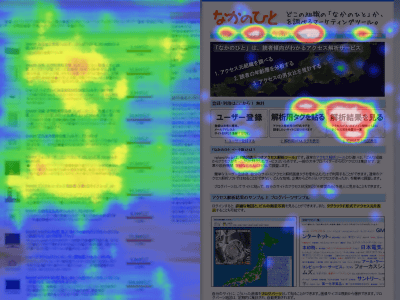
"User Insight" displays the web page like a thermograph observing body temperature, so that you can see at a glance, "Watch where on the page" "Where are you clicking" It is an analysis tool that displays. As with the thermograph, the place where you are closely watching or clicking frequently is displayed in bright colors, whereas where it is not so, it is displayed in dark. Because it can be understood intuitively rather than represented by a table or graph, it is convenient that anyone can understand immediately as soon as they can see it.
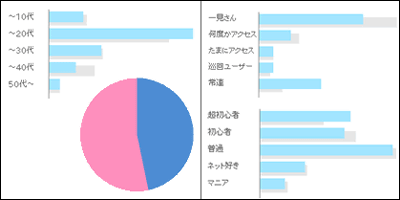
Also, since gender, age, region, industry, access frequency, net utilization, etc. can be analyzed, it is possible to analyze even "what user layer" and "what are you interested" by combining it thing.
Let's see the screen that shows the analysis result as to what it actually looks like.
Details are from the following.
User Insight Web Marketing Tool Which Readers Know How to See the Site
http://ui.userlocal.jp/
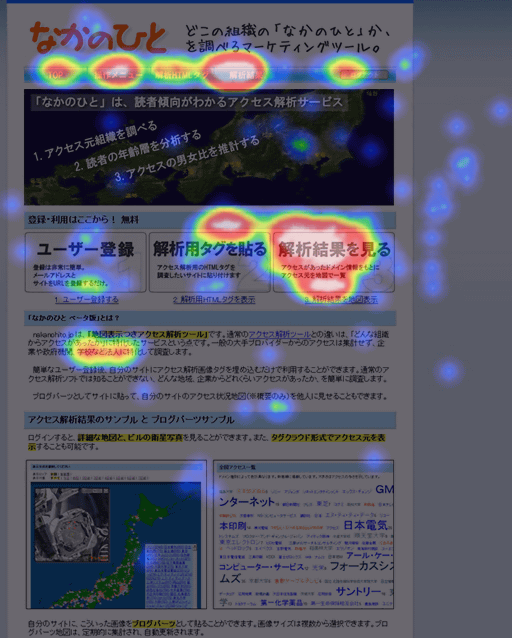
It shows what the user is looking at in the article when visiting the page. It is a place where bright colors are often seen.
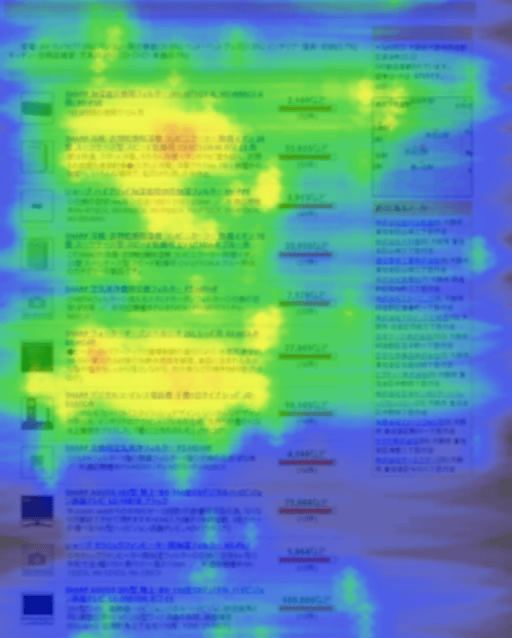
It shows what on the page is often clicked.
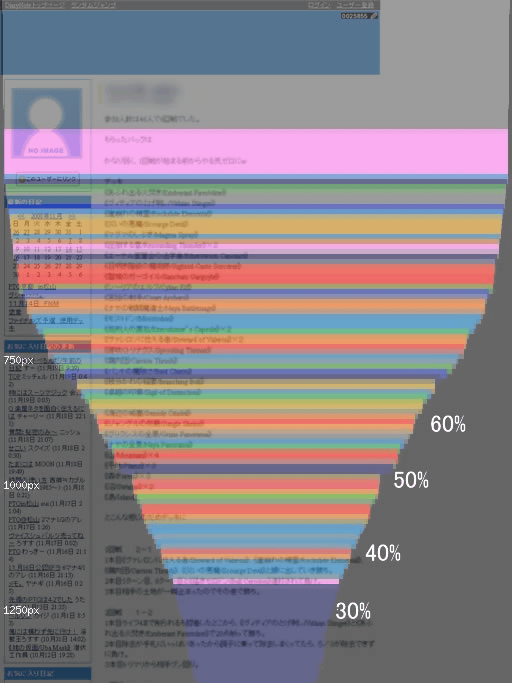
It shows what number of readers have read up to what paragraph. The width narrows as the number of readers decreases.
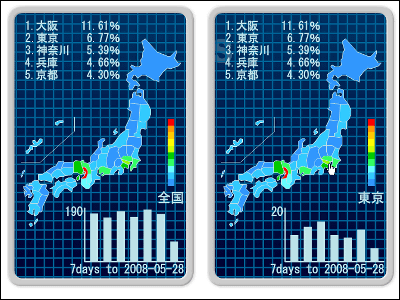
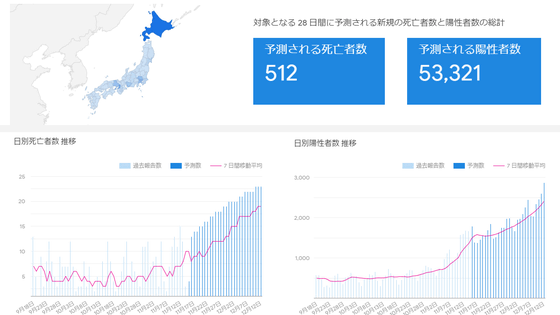
It is also possible to graph demographics.
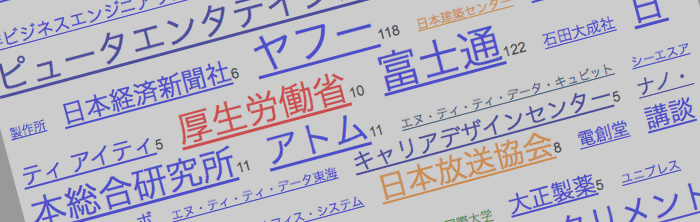
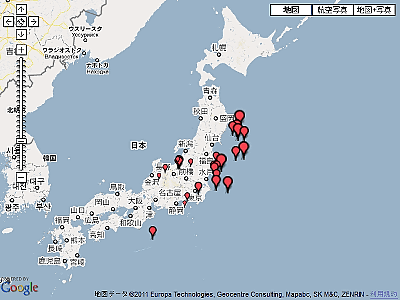
It is also possible to compile which organizations have more access.
Based on large-scale data, users seem to use statistically grouped users with close access trends as user estimates, and they do not contain personal attributes or privacy information.
Today it is on sale from November 19th and it seems that it can be used from 50,000 yen per month. Is not a free version available?
Related Posts:
in Web Service, Posted by darkhorse_log