"SysSense" free software that automatically displays and displays Google AdSense earnings
"SysSense" is a very useful free software that displays current earnings without logging in to Google AdSense every time. Automatically update every time you reside in the task tray, you can customize the contents to display freely, you can also display graphs. Depending on the setting, you can also announce you by sounding the sound when it is updated. It is best for those who care about the revenue of Google AdSense.
So, I actually installed and used it.
Download from below.
Singer's Creations SysSense
Click on it to download it

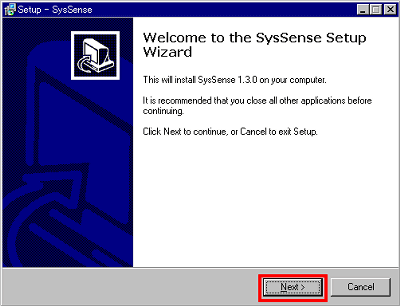
Click "Next"
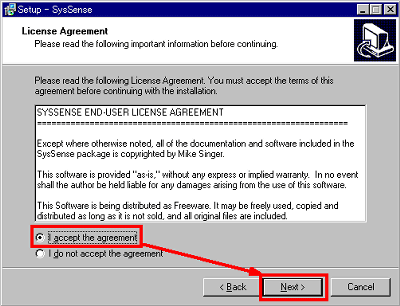
Please check "I accept the agreement" and click "Next"
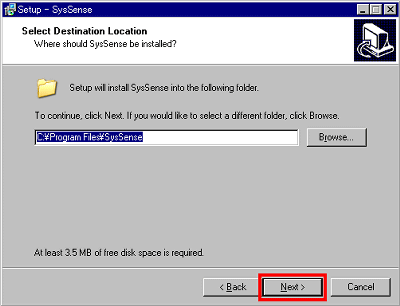
Click "Next"
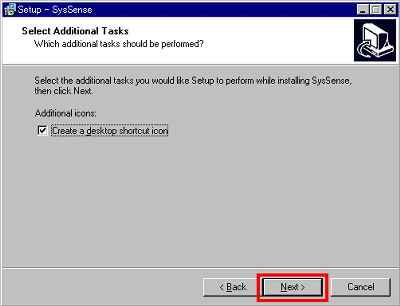
Click "Next"
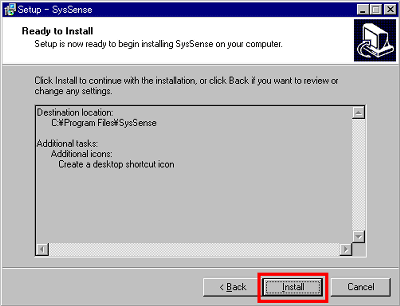
Click "Install"
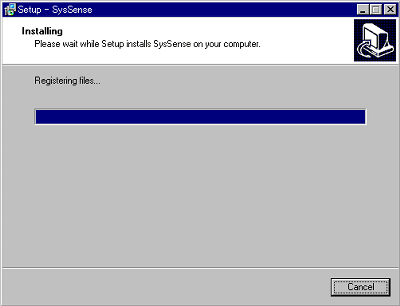
Wait for installation to finish
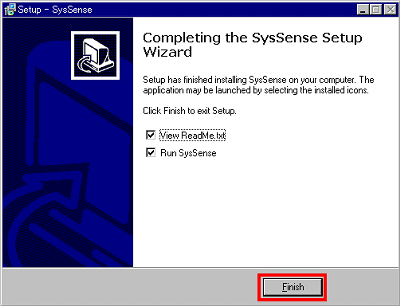
Click "Finish"
Click "Yes" as you can ask if you want to set it on initial startup

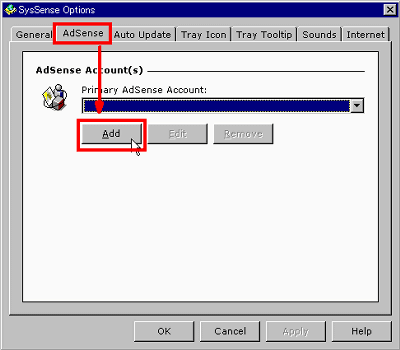
Click the "AdSense" tab and click "Add"
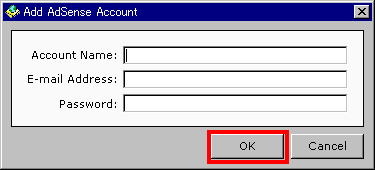
Enter your favorite name in "Account Name", enter the email address of the Google AdSense account in "E-mail Address", enter the password in "Password" and click "OK"
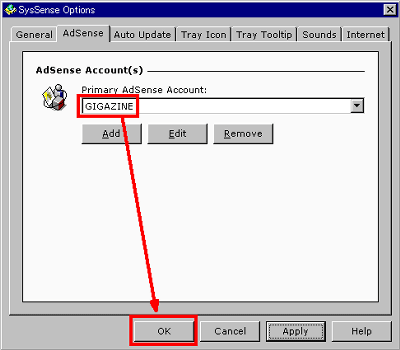
Since the name entered in "Account Name" is displayed, click "OK" after confirmation
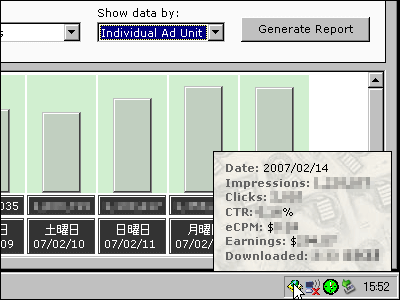
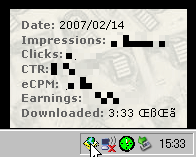
It resides in the task tray and when you move the mouse up, it appears like this
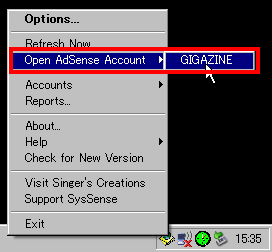
Right click to display the menu, and click "Refresh Now" to display the latest information
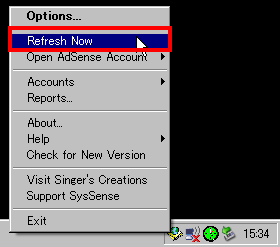
You can also log in to your Google AdSense account page from "Open AdSense Account"
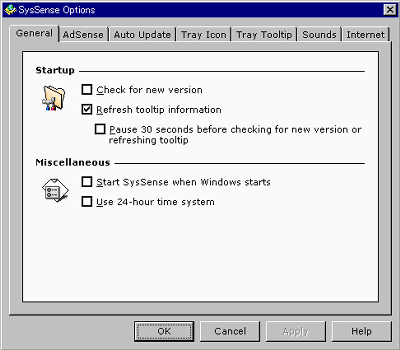
Various settings are available by selecting "Options" from the right click menu. From "General" you can set whether to acquire information at startup, whether to perform version upgrade check or not. Also, if you put a check at the bottom, the time display will be displayed 24 hours.
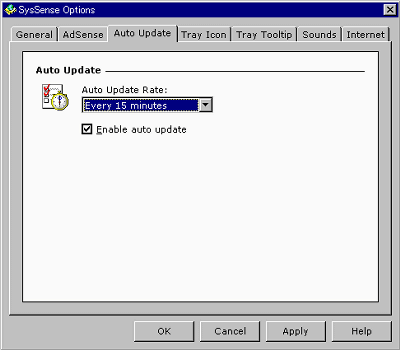
"Auto Update" decides how many minutes to update automatically
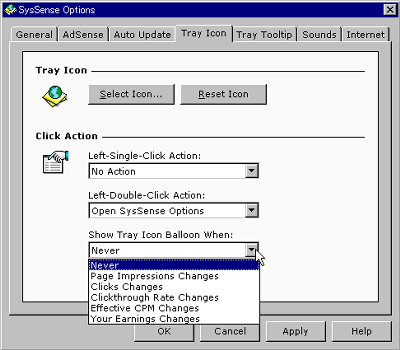
From "Tray Icon" you can change tray icons and behaviors when clicking icons.
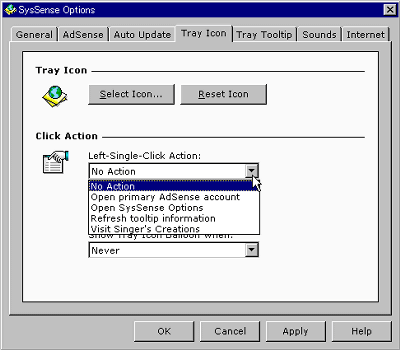
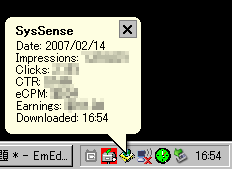
Especially useful is at the bottom, it is possible to display the balloon automatically when the profit changes.
It is displayed like this
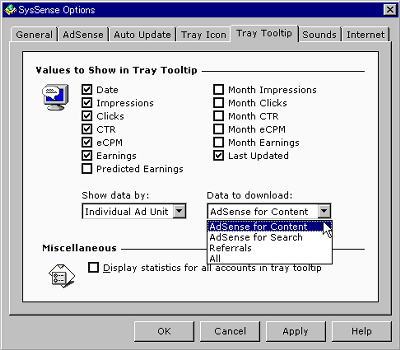
From "Tray Tooltip" you can change the displayed contents. Revenue from search can also be displayed.
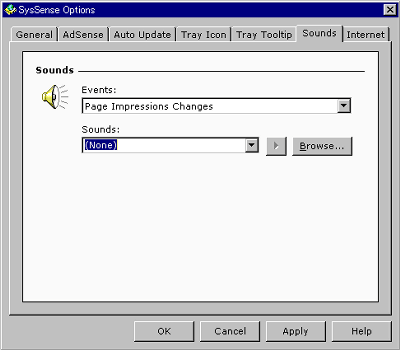
From "Sounds" you can specify the sound to be heard when something happens
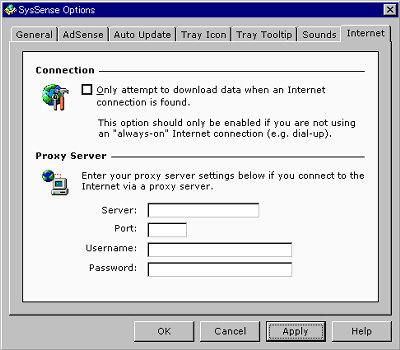
From "Internet" it is possible to prevent proxy setting or automatic updating when not connected to the net
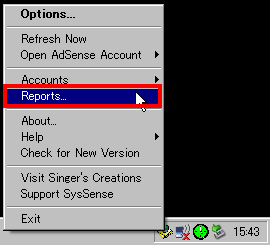
If you right-click and click "Reports", graph display is possible
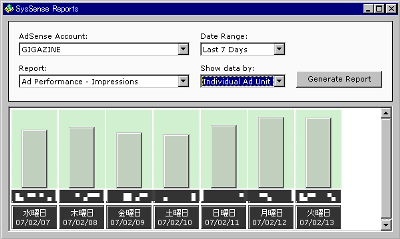
When you set the conditions at the top and click "Generate Report" the graph will look like this. Convenient because it is easy to understand visually.
Related Posts:
