GIGAZINE's biggest challenge, from LoadAverage '86' to '3'

So, I searched for a way to lower the load again, a record of the battle.
1. Change MySQL settings to speed up
Introduction of Zend Optimizer 3
3. Introduction of the iCube PHP Accelerator
4. Reduce queries by reviewing templates
5. Control the interval to crawl inrobots.txt
6. Change MySQL setting to lower load setting
7. Activate caching
The last commentary "How to lower GIGAZINE's LoadAverage from "27" to "2"Approximately three weeks after, on the evening of June 20 (Tuesday), the 15-minute average of the load will constantly spew out "25", and the number of visitors has increased rapidly, finally on June 28 (Wednesday) At 12:45, Load Average 15 minutes average is "86", with little effect of load countermeasure.
Is something fundamentally wrong? Or maybe the hardware specification of the GIGAZINE server is limited? After all, is not it just a countermeasure against burnt-fire like load ...?
However, unlike last time, however, this time we finally achieved a dramatic improvement. Below, complete explanation of the process.
First we took measures against the load on the night of June 20.
1. Change MySQL settings to speed up
There are two main reasons for frequently connecting to the database: page view count and random trackback address generation. Based on the assumption that ExpressionEngine itself has a database syntax and perfect tuning, the only thing we can do is change the configuration file, that is, change the configuration file. As a result of examination, I decided to change the setting file "my.cnf". The following article was referred to.
MySQL tuning - [database] All About
As a result of looking at various things while referring to this, I decided to allocate 1/4 of the total memory.
Introduction of Zend Optimizer 3
In order to increase processing speed, select "Zend Optimizer 3" which is terribly easy and easy to install. Confirm that the operation of ExpressionEngine is not hindered on the test server, and introduce it to the production environment.
With MySQL configuration change and introduction of Zend Optimizer 3, the load has changed from 25 to 15 on a 15-minute average. It became a little. However, a little relieved, but also short-lived, Thursday, June 22, the fact of the shock is known. "Zend Optimizer 3" actually did not move .... If you read the manual carefully, it seems that it will not work if PHP is compiled with "enableversioning" option ....
Zend Optimizer Japanese manual (PDF file)
Please confirm that your PHP is compiled with Enable Versioning disabled. You can check from the presence or absence of "--enableversioning" in the "Configure Command section" at the top output by the -phpinfo () function. If this parameter exists, you need to disable this compilation option and recompile PHP.
I often find "Zend Optimizer even if I insert it, the speed does not change, the speed does not change, it has no effect", but perhaps it may be caught around here.
That means that GIGAZINE was lighter by merely changing MySQL's configuration. Shikiku And during this period visitors increase day by day.
3. Introduction of the iCube PHP Accelerator
I decided that Zend Optimizer 3 is not working, so I uninstalled it, Yahoo! I installed "ionCube PHP Accelerator" instead of installing it. Explanation Because the manual is polite and polite, the procedure itself is fairly easy.
IonCube PHP Accelerator
Make sure that the manual is properly read from the end to the end, and the intermediate file is also properly generated. For the time being we will look at the default setting. Since the setting can be changed in detail, it may be possible to further optimize by adjusting this area. It feels nice.
4. Reduce queries by reviewing templates
Review the part of the RSS output that is accessed most, as well as the template of the part to display in the browser. In order to eliminate queries unrelated to RSS output and speed up processing as much as possible.
Data Caching and Performance - ExpressionEngine Documentation
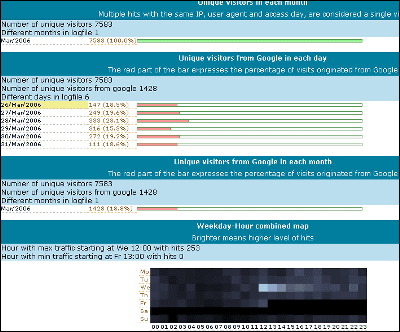
Also, at this point it is found that the load of the time zone when the access reaches the peak is increasing, and it is not increasing much as average on a daily average, rather it is reduced to about 3 loads. Which of the following three patterns is the time zone when the load reaches the apex?
A. From 12 o'clock to 13:15
B.17 to 18
C 22: 0 to 45: 45
Especially heavy is "A" time zone from 12 o'clock to 13:15. GIGAZINE is accessible from the domain or corporation, considerable part of the viewer during the daytime, so that as soon as everyone arrives at 12 o'clock in the day everyone gets into lunch time, Then, I was going to see it even a little GIGAZINE ~ Accessed all at once, it was exposed that the load increased steadily under the white day.
For the same reason, from 17 o'clock to 18 o'clock in the time zone of "B", it seems that if you are a worker like 9 o'clock - 5 o'clock, you are going to have a look like ~ before seeing it. Therefore, this time zone also rises sharply.
Although "C" from 22 o'clock to 0:45 pm will not increase all at once, this time it will constantly come up with a certain amount of load as general people who occupy the majority of visitors of the night, other than companies and companies, will come constantly It was.
5. Control the interval to crawl inrobots.txt
Totalizing the logs of the last week and the logs before the last week, the load suddenly rises when the search engines' bots and crawlers visit overlap, especially in cases where "A" jumps dreadfully during weekdays time zones Discovered that. Three bots of Google, MSN, Yahoo were simultaneously accessing each page one to three seconds at the same time, and it was supposed to be outrageous. Especially astonishing is MSN, which is accessing about 2 seconds from 2 pages per second, which is about the speed of cutting off 1 second. Therefore, as a result of examining whether the access interval can be controlled with robots.txt, it turned out that MSN and Yahoo can control.
Site owner help: Address MSNBot and site crawl issues
Yahoo! Help - To reduce the number of requests from robots for search engines for site administrators
At this point the load is from 15 to 12.
I thought that there might still be some unknown way, and I went to the Kinokuniya to see the wisdom of my predecessor, and read the various performance and tuning related books from one side. As a result, there is something wrong with the relationship between the current number of accesses and the load. In short, is not there another reason why there is no effect as much as I expected? Premonition that it is. It turns out later that it turns out.
Friday, June 24,Published in livedoor blog communicationAnd after a temporary increase in visitors, the access to RSS 2.0 eventually increased by about 2000 compared to last week. Also irrespective of that, the number of visitors has increased sharply, the load has increased from a maximum of 12 to 25 with an average of 15 minutes. I feel hopeless.
On Saturday, June 25, ExpressionEngine itself has been updated to version 1.4.2. A variety of functions were added, and I was relieved a bit because I could fix bugs. However, there is not much relation with load reduction, Shobon. Rather, PHP file size is increasing, is it okay? Will it increase in function that processing is increased and becomes heavier ...? And one anxiety goes by.
On Sunday, June 26, when I reconsidered the settings that caused access to MySQL, the option to record Referer remained on and somehow kept recording hundreds of Referer It turns out that it is. Apache's access log analysis is sufficient, so turn off this function.
Tuesday, June 28, the day of fate. The load suddenly increased rapidly from 12 o'clock, and at 12:45, Load Average 15 minutes average became "86" while the effect of the load countermeasure hardly appeared. I wanted to go on a journey to the woods by going into a crazy mode and there is a volume of bamboo trees.
6. Change MySQL setting to lower load setting
Even if I cried, I had no choice, so when I looked at the log, it was simply a swap occurred. In other words, somewhere setting is bad. As a result of various investigations, it turned out that it was caused by "changing MySQL settings and speeding up". This setting is tuning for machines with more memory or power, which will increase the processing speed, but the CPU load will also increase to some extent as well. In other words, if you want to minimize the load as much as you can keep speed down to a certain extent, you should reduce the amount of memory used. It was caused by blind spots or because I did not properly read the documentation of MySQL itself. Heavy ministry.
As a result, the same number of accesses came from 18 o'clock in the evening, but the load was able to survive at around 20. But it is still heavy. I have to manage somehow ....
On the night of Wednesday, 29th (Wednesday), I will search and read the ExpressionEngine's community from one end to find out what measures were taken in the same case.
PMachine Community Forums | Powered By ExpressionEngine
http://www.pmachine.com/forums/
And finding out the thread that the people who are suffering with similar things set up. As you go forward, people in ExpressionEngine are writing this.
"OK, I will review the setting again,Whether the cache is properly generatedCheck it. Whatever you think of that load with that number of accesses, it is funny, it should be lighter. "
... Cache generation? I have a bad feeling, I see the cache directory. Three directories named db_cache, page_cache, and sql_cache have been created properly by ExpressionEngine properly. There is a cache file properly in sql_cache. But there is nothing in db_cache and page_cache ... the mountain of an empty directory. Why is the directory permission "777", why?
7. Activate caching
When you read the communication in the above community, you can see that some people have not created a cache even though the permission is "777" in the same way. As I go further, the person in ExpressionEngine wrote such a thing.
"OK, PHP is in safe mode? If it is safe mode, I will turn it off now."
Looking at php.ini, safe mode was on exactly. When this is set to "Safemode = Off", the cache file and the remaining cache file are generated and the load quickly decreases. Even at 4 o'clock in the morning which was quiet until now, the load was reduced to "0.1", which was about "3". In other words, all kinds of load countermeasures up to now have begun to be effective at a stroke, and the load has dropped to one-tenth.
As a result, I have experienced one of the biggest access so far at 12:00 to 13:00 on June 30 (Friday), but the Load Average 15 minutes average has reached the maximum "3". Suddenly since yesterday, GIGAZINE came to look crisp is up to this.
When I open the lid like this, it is content like shame of overwhelming, but I was shamed to dare because there might be people who stumble with similar things. It seems that further training is necessary.
■ The conclusion of this time:
Once you change the setting make sure that it is working properly
Related Posts:


in Note, Software, Web Service, Review, Column, Posted by darkhorse_log