I tried using Google's access analysis service "Google Analytics"

It can be used for free up to 5 million PV per month. Simply divided by 30 days, it is OK if it is within 160,000 PV a day.
If it exceeds 5 million PV, it will not be counted any more, so no separate fee will be added.Google Analytics
Originally it was available for free, which cost $ 199 in the analysis of 100,000 PV a month called "Urchin", which is too amazing! It is said that up to 5 million PV is free, so if you go with simple calculations, you can actually use for $ 1,9950 and about 1.18 million yen for free ... I thought that there was no hand not using this, and not my GIGAZINE I tried on a different site to manage.
Create an account in "Google Analytics", log in, enter the domain of the site you want to analyze, paste the generated tags on the page. This is the only work. There are subtle instructions that follow the meta tag and before the close tag on the head, but this is probably because you count relative ads when counting targeted ads.
Because it is still heavy now, I can not see the analysis results in real time. Approximately 24 hours to 48 hours after waiting about pasting analysis tags is OK.
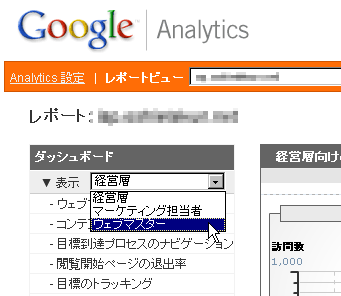
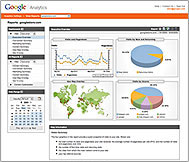
Click "Report View" to see the report. All graphs are rendered in Flash and animated.
In this state, it is less than normal access analysis. To see it in detail, select "Webmaster" from the dropdown list.
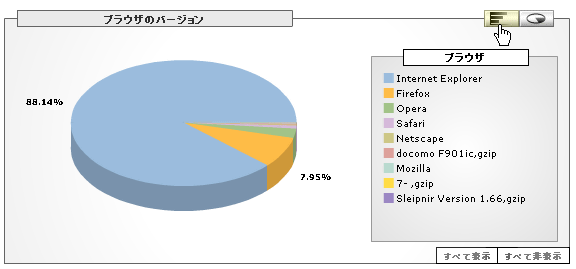
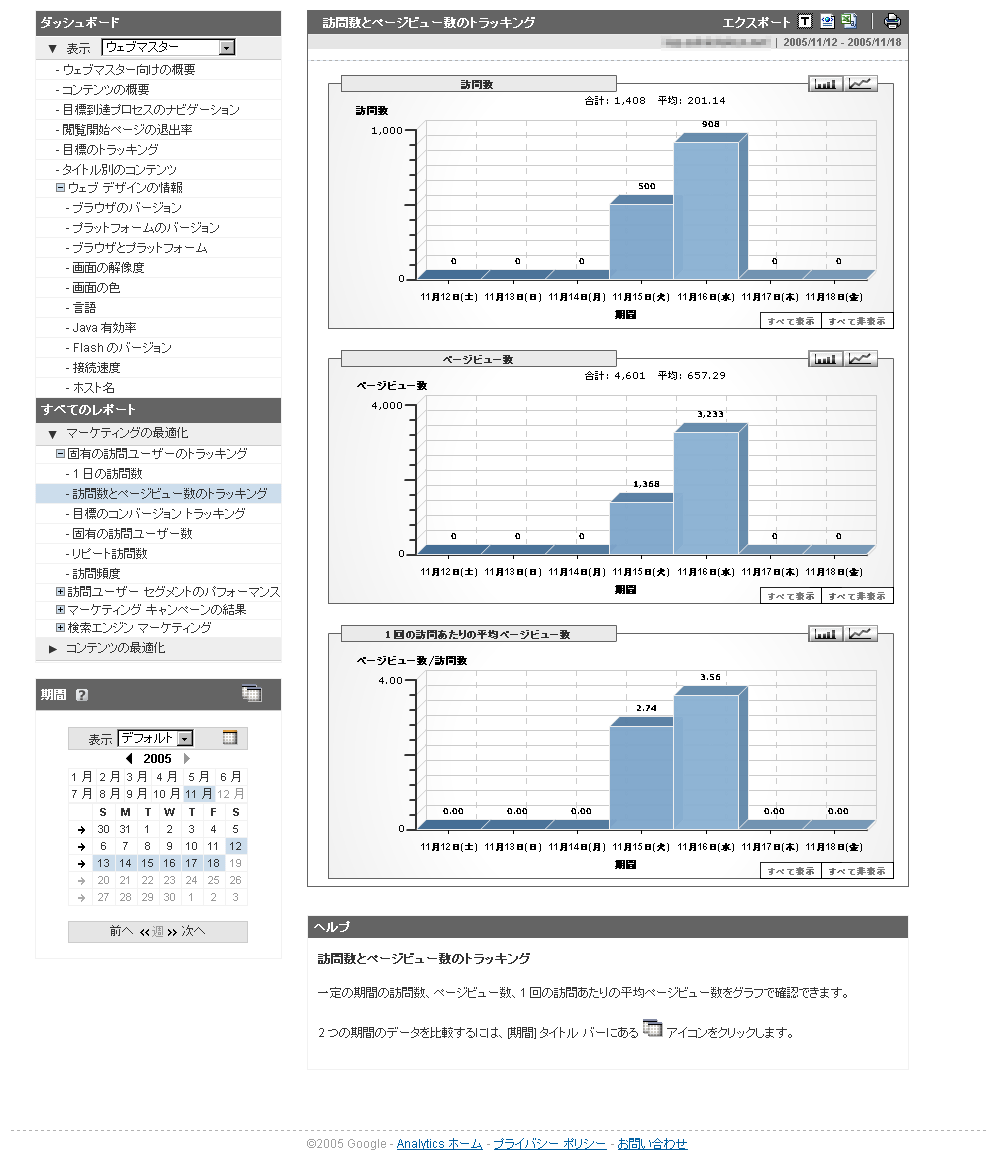
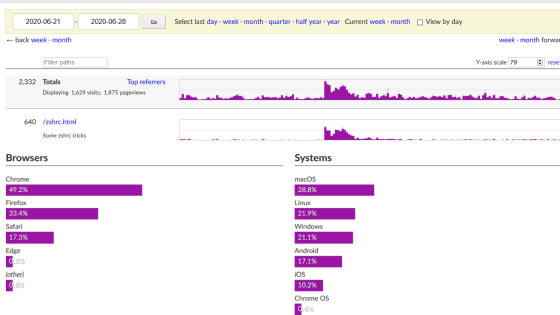
Then you can display the results like any other existing access analysis like this.

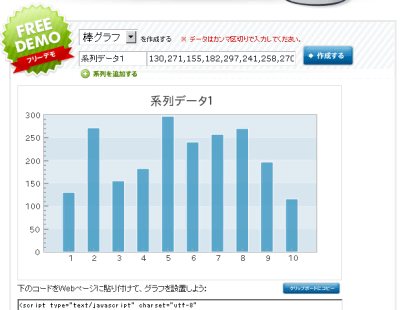
There are several graph display formats, the standard is a pie chart.
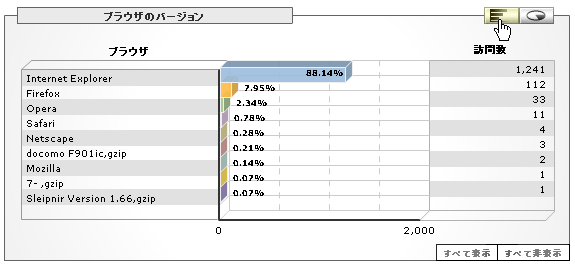
Clicking on the bar graph button in the upper left will immediately switch to a bar chart.
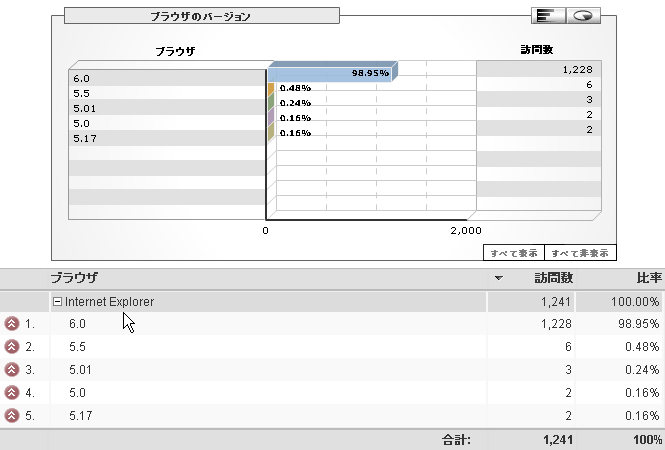
You can further check the version of the browser by further clicking "+".
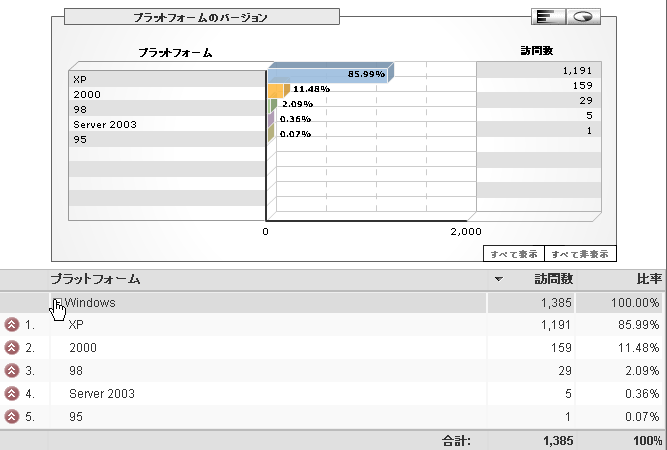
You can analyze OS versions like this.
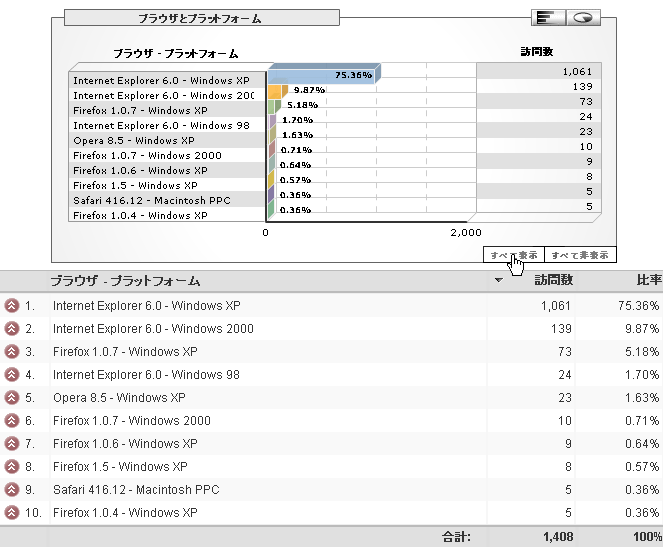
It is also possible to analyze with a combination of browser and OS.
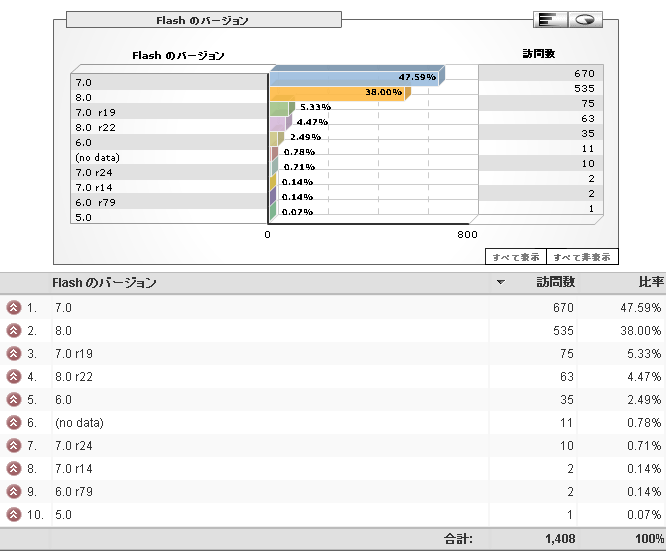
You can also display something like Flash version.
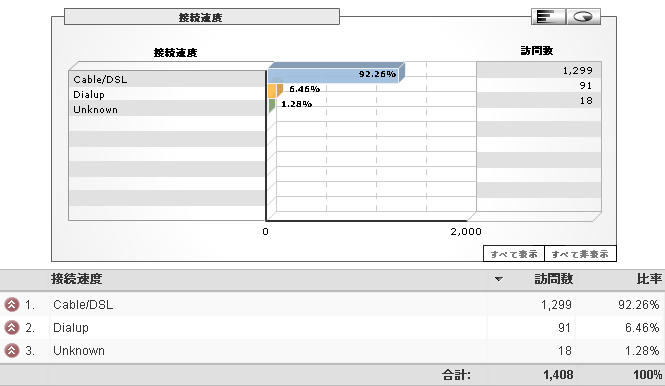
Connection speed is also rough but it is displayed.
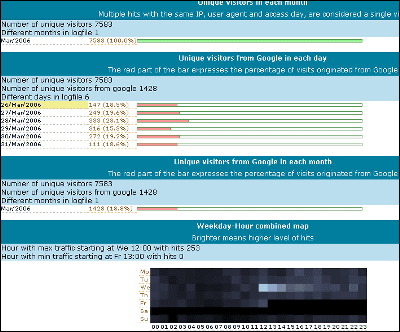
In addition, you can display the number of visitors (unique users), PV or average PV for the period specified by the calendar as a graph. This can also be a line graph.
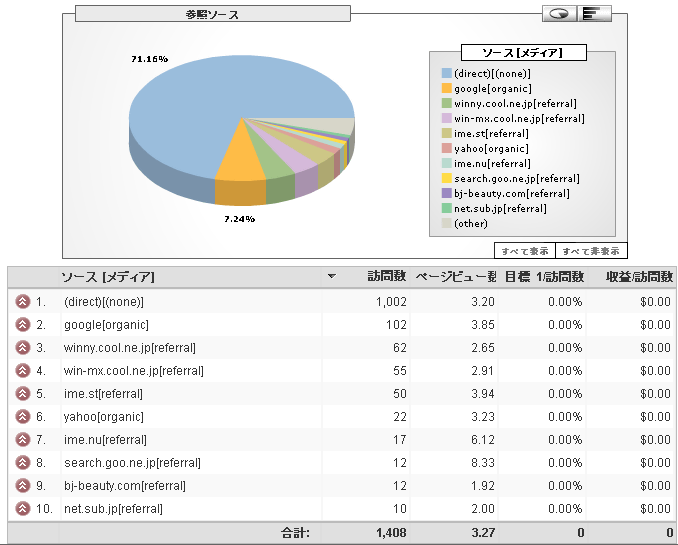
It is also possible to analyze where links are mainly from.
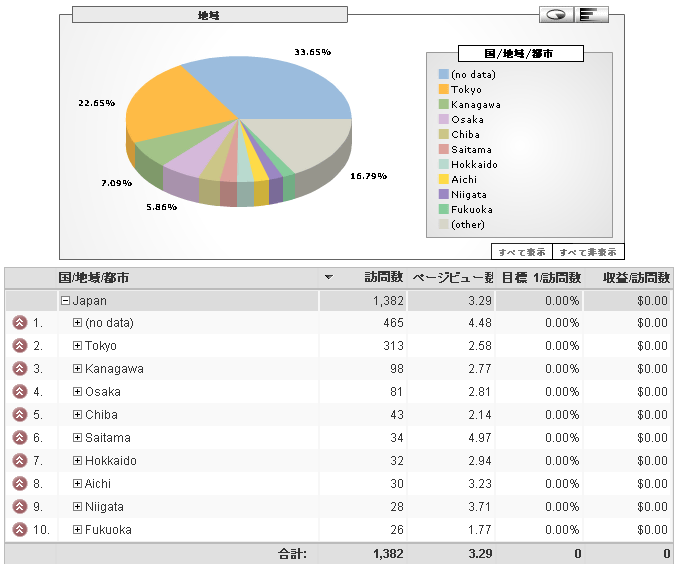
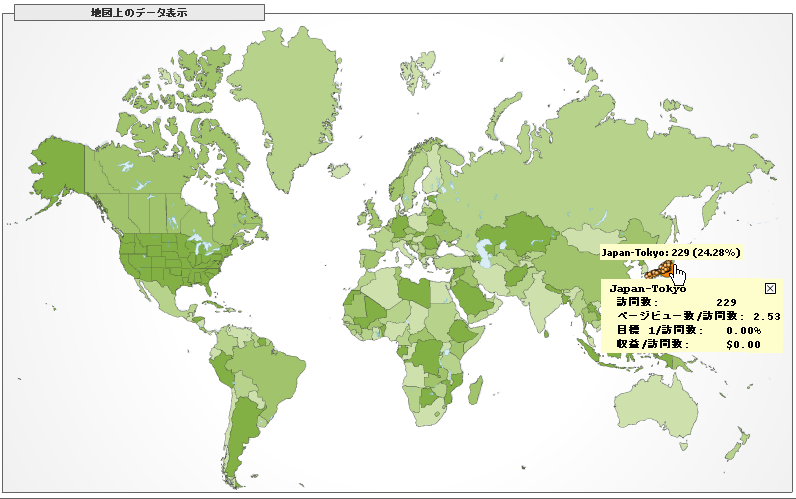
And this is excellent, you can see from which prefectures in Japan are accessed.
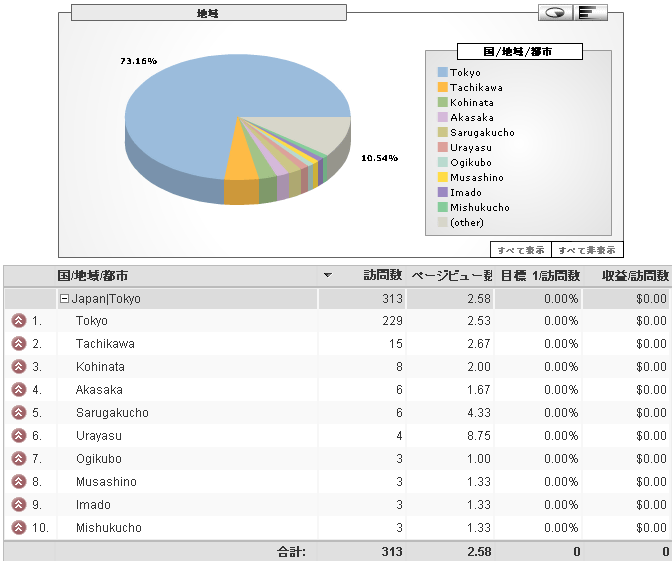
Furthermore, it can analyze even in municipal units within prefectures, Google resurrecting!
You can also display it on the world map, you can see details by clicking on the collision.
A site that will be accessed from all over the world will surely be a spectacular sight.
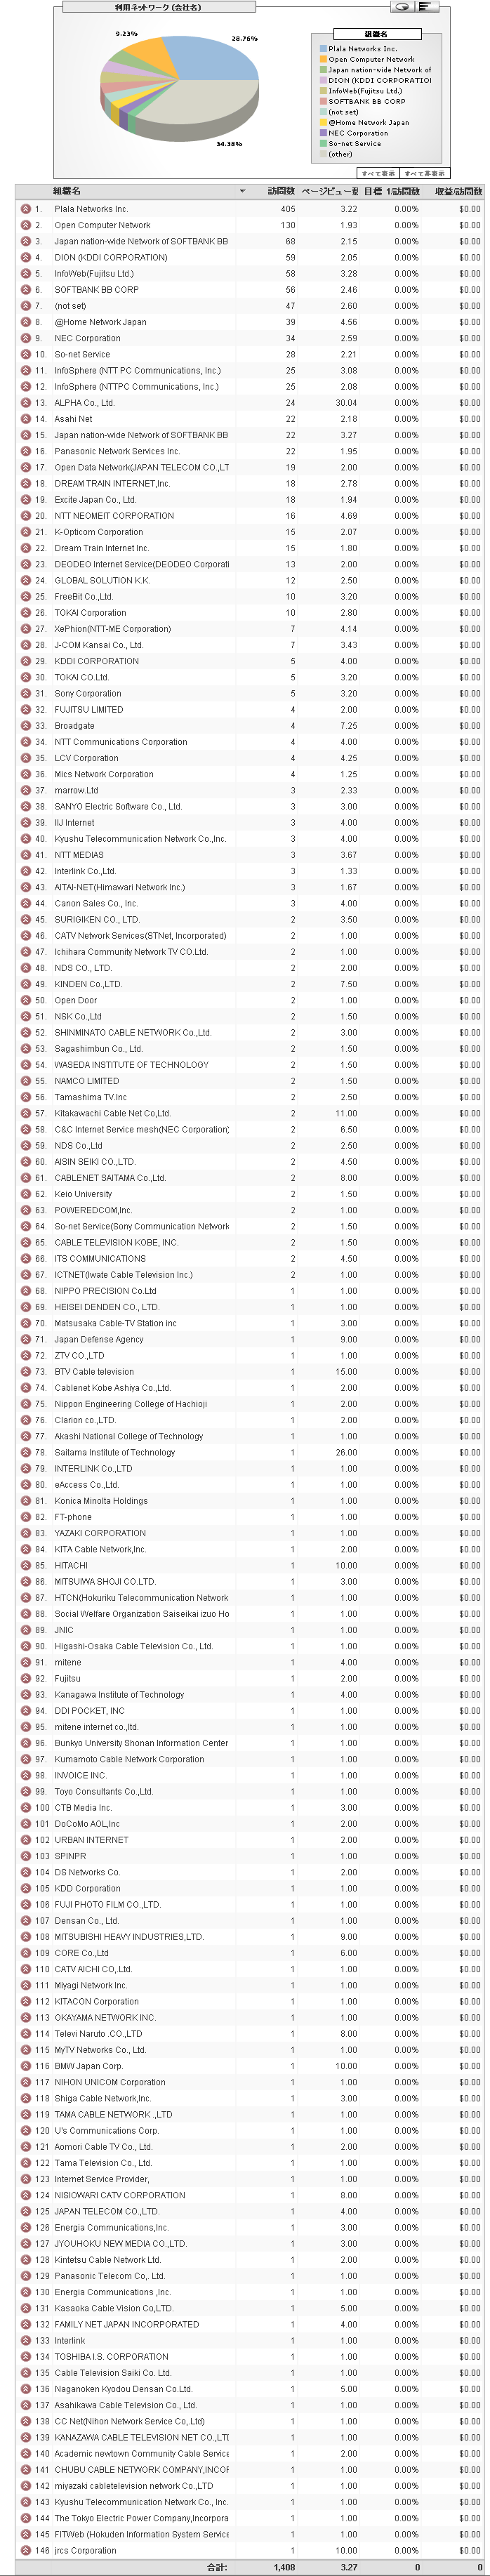
Also, you can analyze which companies, networks, providers are visiting.
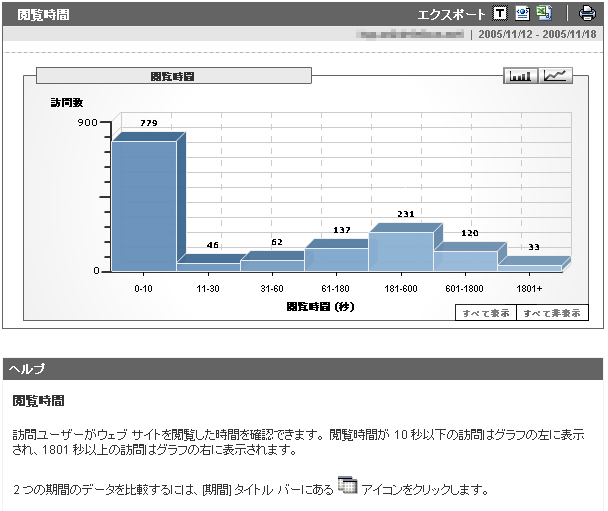
You can also display the length of stay in one visit.
Other than that, the evaluation of the page you saw at the very end and the page you saw first, what route you reached the target page, how much you downloaded by rewriting the link tag, By embedding at the source code level, access analysis within the full Flash site is also possible. You can track how many clicks were actually made on e-mail magazine advertisements and click advertisements, and if you set a unit price for each, you can also figure out how much total amount you have achieved.
Also, if it is a shopping site, it will be like "Thank you" after the last order
If you divide the page for each product and put in your own tags on each page, detailed marketing analysis such as which customer who came by the route bought the product, if it did not fall out in the case, etc is.
In addition, by creating a user account, you can create browsing-only users, etc. It is also useful if you want to show the results of access analysis, although it will be a problem if you change the setting.
As a result, menus are separated as view for management, view for marketers, and views for webmasters. Managers need only grasp the outline, marketers understand sales, and webmasters do more fine adjustments.
In addition, it is possible to analyze the main domain and multiple subdomains with one account with filtering, which seems to be determined by Referer. (Specification that does not distinguish between main.index.php and index.php of subdomain as normal)
Filtering is also powerful, but since all analysis results can be output as text file, CSV file, XML file, it can be easily reused.
You can tell if you came from the search engine keyword search results by "All reports" → "Marketing optimization" → "Search engine marketing" → "Conversion of the entire keyword".
Clearly, I have thought that the main access analysis is good in Kore (bitter smile)
Related Posts:

in Web Service, Review, Posted by darkhorse