Cloudflare reports it detected and blocked the largest ever '5.6Tbps DDoS attack' in Q4 2024

Cloudflare has released the 20th edition of its quarterly
Record-breaking 5.6 Tbps DDoS attack and global DDoS trends for 2024 Q4
https://blog.cloudflare.com/ddos-threat-report-for-2024-q4/
Record 5.6Tbps DDoS Attack in Q4 2024 and Global DDoS Trends
https://blog.cloudflare.com/ja-jp/ddos-threat-report-for-2024-q4/
Cloudflare's global network capacity as of Q4 2024 will be 321 terabits per second (Tbps), an 812% increase from 35 Tbps at the beginning of 2020. The service area has also expanded by 65% to 330 cities around the world in Q4 2024, up from 200 cities at the beginning of 2020. As a result, Cloudflare now serves approximately 20% of all websites and 18,000 IP networks.
Key insights for DDoS attacks in 2024 include:
In 2024, Cloudflare's autonomous DDoS protection systems blocked approximately 21.3 million DDoS attacks, up 53% from the previous year. This means that Cloudflare blocked 4,870 DDoS attacks every hour in 2024.
In Q4 2024, over 420 hyper-bandwidth intensive attacks were detected, exceeding 1 billion packets per second (pps), or 1 Tbps. Additionally, the volume of attacks exceeding 1 Tbps increased 1,885% quarter-over-quarter.
During Halloween week in 2024, Cloudflare's DDoS protection system automatically detected and successfully prevented a 5.6 Tbps DDoS attack, the largest ever recorded.
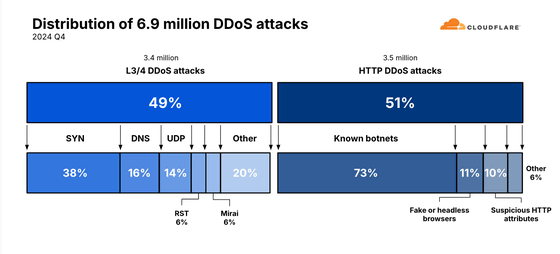
The total number of DDoS attacks detected and stopped by Cloudflare in Q4 2024 was 6.9 million, a 16% increase from the previous quarter and an 83% increase year over year. Of the DDoS attacks detected and stopped in Q4 2024, 49% were Layer 3 and Layer 4 DDoS attacks and 51% were HTTP DDoS attacks.
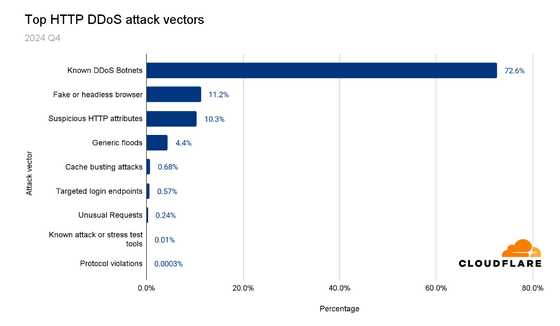
72.6% of HTTP DDoS attacks were launched by known botnets, and Cloudflare explains that 'operating a large network and seeing many types of attacks and botnets allows us to quickly detect and block these attacks.' Other attacks included 11.2% HTTP DDoS attacks disguised as legitimate browsers, 10.3% attacks containing suspicious or anomalous HTTP attributes, 4.4% general HTTP floods, 0.68% bandwidth-intensive cache busting attacks, and 0.57% bandwidth-intensive attacks targeting login endpoints.
The top 13 user agents that appeared most frequently in DDoS attacks were: 99.9% of DDoS attacks were carried out by the user agent 'HITV_ST_PLATFORM' associated with smart TVs and set-top boxes. Cloudflare points out, 'In other words, when we look at traffic coming from the HITV_ST_PLATFORM user agent, there is a 0.1% chance that it is legitimate traffic.'
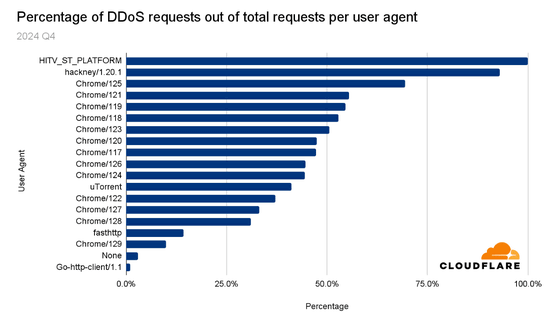
The second most common user-agent was '
Other user agents are mostly populated by Chrome, whose latest stable version at the time of reporting was version 132.
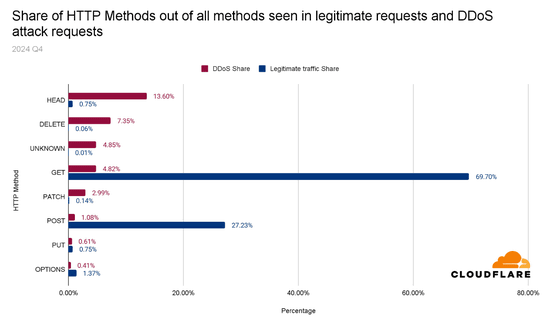
'HTTP methods' are part of the HTTP protocol that define the action to be taken on a resource on a server, enabling communication between clients and servers. The graph below compares common HTTP methods (blue) with the HTTP methods used in DDoS attacks (red). GET (69.70%) is by far the most commonly used HTTP method, but only 4.82% of DDoS attacks use it. HEAD (13.60%) is the most commonly used method in DDoS attacks, followed by DELETE (7.35%) and UNKNOWN (4.85%).
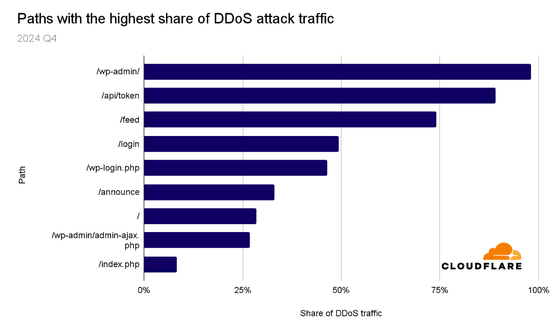
An 'HTTP path' describes a specific server resource. DDoS attacks target the root of a website, but there are also cases where a specific path is targeted. Below is a list of the HTTP paths most targeted by DDoS attacks. It seems that 98% of HTTP requests to the HTTP path '/wp-admin/' were part of a DDoS attack. '/wp-admin/' is the HTTP path for the default WordPress administrator dashboard.
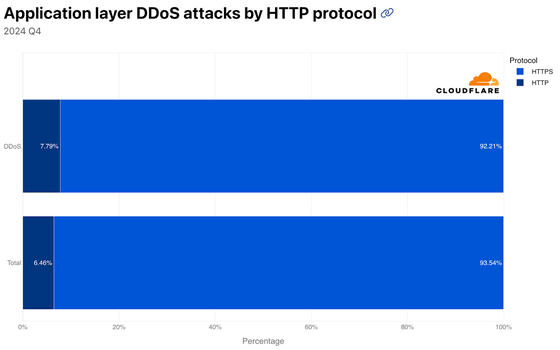
93.54% of legitimate traffic in Q4 2024 will be HTTPS, with only 6.46% being unencrypted HTTP. In comparison, 92.21% of DDoS attack traffic will be HTTPS, with 7.79% being HTTP.
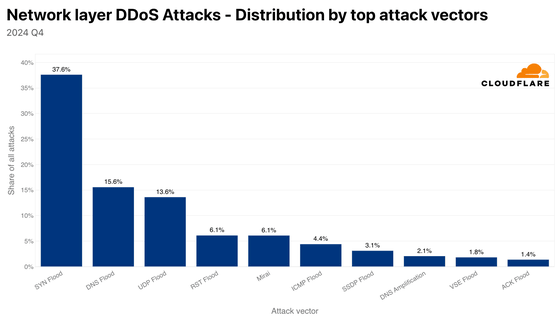
The most common attack vectors for Layer 3 and Layer 4 DDoS attacks are
The other common attack vector, or botnet type, is
On October 29, 2024, a 5.6Tbps UDP DDoS attack launched from a Mirai variant botnet targeted users of Cloudflare Magic Transit, an Internet service provider in East Asia. Cloudflare analyzed that the attack took just 80 seconds and was launched from more than 13,000 IoT devices. Cloudflare's distributed defense system detects and blocks the attack fully automatically, successfully blocking the attack without human intervention, alerts or triggers, and without causing any degradation in network performance.
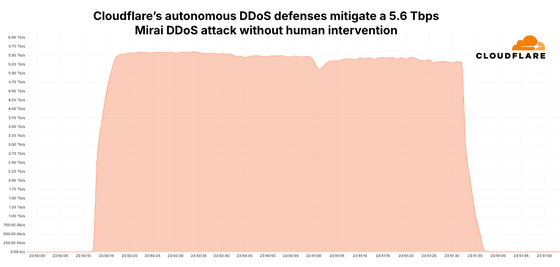
The total number of unique source IP addresses used in this attack was approximately 13,000, with an average of 5,500 unique source IP addresses per second. The number of unique source ports per second was similar. Each IP address contributed just under 8 Gbps per second, with an average contribution of approximately 1 Gbps (approximately 0.012% of the total).
The majority of HTTP DDoS attacks (63%) were less than 50,000 requests per second, while 3% of HTTP DDoS attacks exceeded 100 million requests per second. Similarly, the majority of network layer DDoS attacks were also small, with 93% not exceeding 500 Mbps and 87% not exceeding 50,000 requests per second.
72% of HTTP DDoS attacks lasted less than 10 minutes, 22% lasted more than an hour, and 11% lasted more than 24 hours. 91% of network layer DDoS attacks were also short, completing in less than 10 minutes, and only 2% lasted more than an hour.
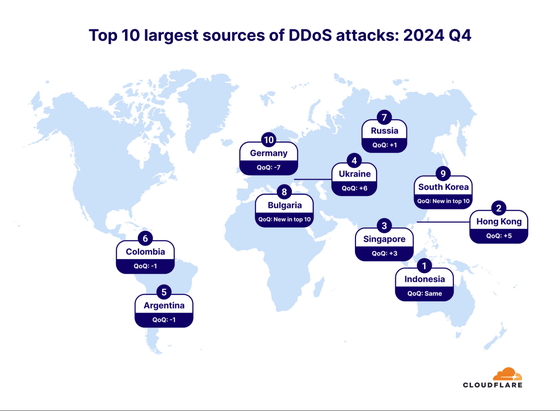
Below is a map of where DDoS attacks originate. Indonesia is the largest source of DDoS attacks, followed by Hong Kong, Singapore, Ukraine, Argentina, Colombia, Russia, Bulgaria, South Korea, and Germany. HTTP DDoS attacks cannot be spoofed, so to understand where the attacks are coming from, the source IP addresses that launch HTTP DDoS attacks are mapped. Network layer DDoS attacks are identified by using location data of the data center where the DDoS packets were captured.
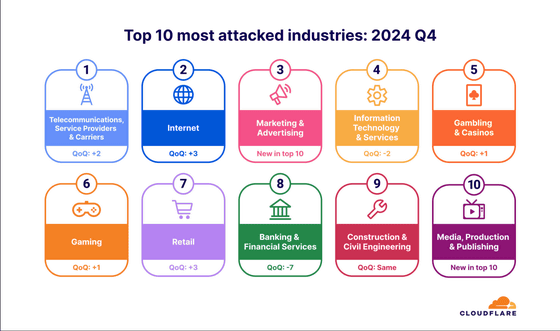
Below is an image showing the top 10 industries targeted by DDoS attacks, with the Telecommunications Service Providers and Carriers industry coming in first, followed by the Internet industry and the Marketing and Advertising industry.
Related Posts:
in Security, Posted by logu_ii


