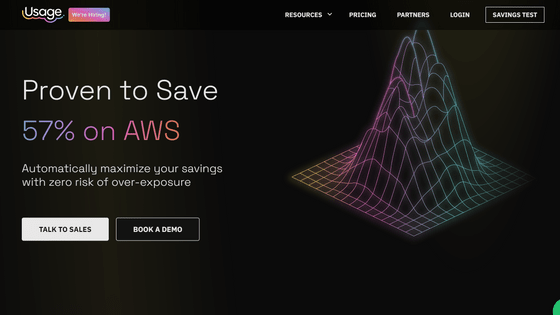
Dashdive is a tool that allows you to measure costs from all aspects across multiple cloud services.
Managing costs can be difficult, especially when using multiple clouds. A tool that allows you to manage costs from all aspects so that you don't end up in a situation where you won a large contract, but the cloud costs ballooned, and you're not sure whether the total is positive or not. is ' Dashdive '.
Dashdive | Cloud Cost Observability
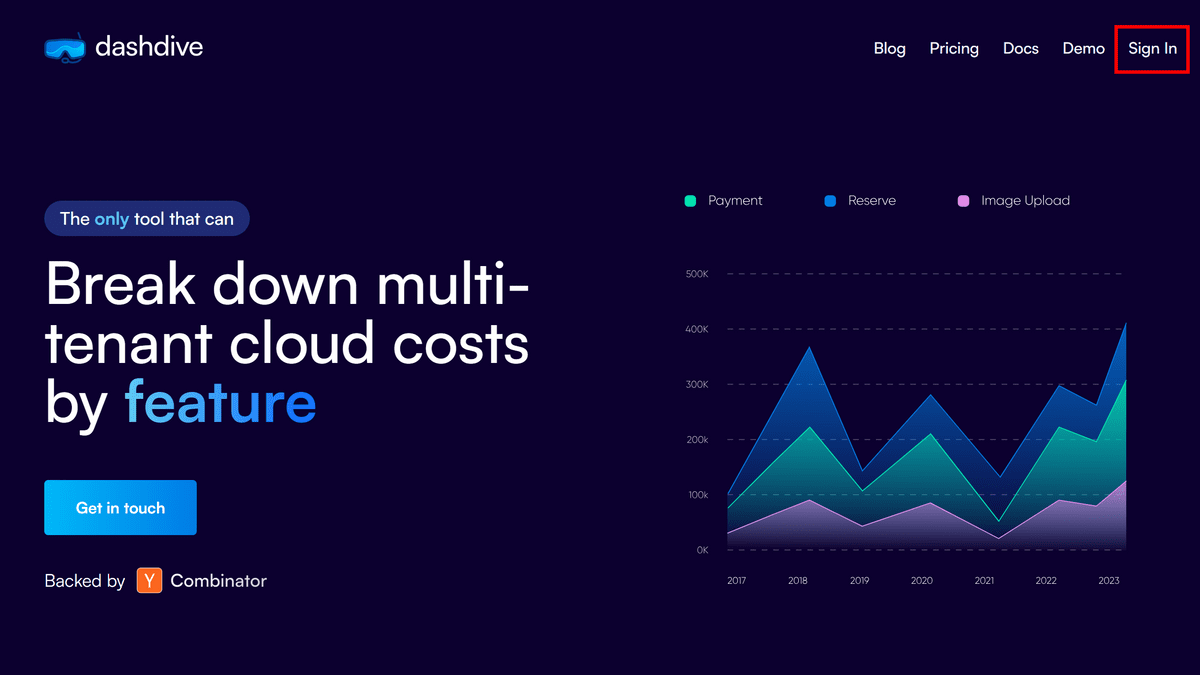
Click 'Sign In' at the top right of the official website .
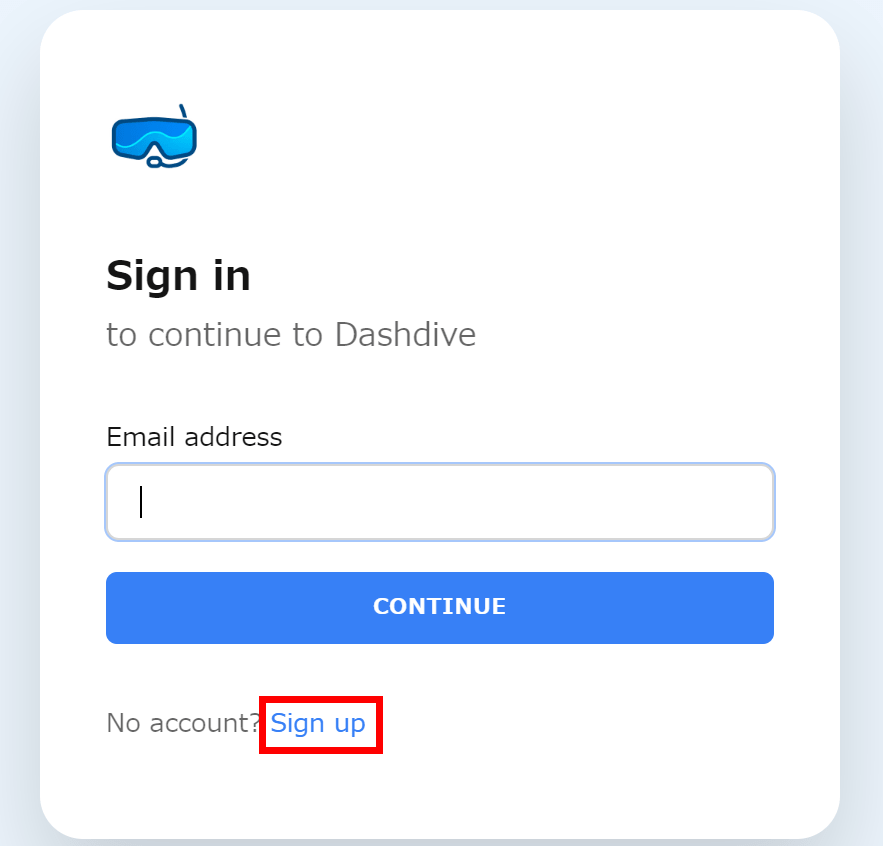
Click 'Sign up' to register as a new user.
Enter your email address and password and click 'CONTINUE'.
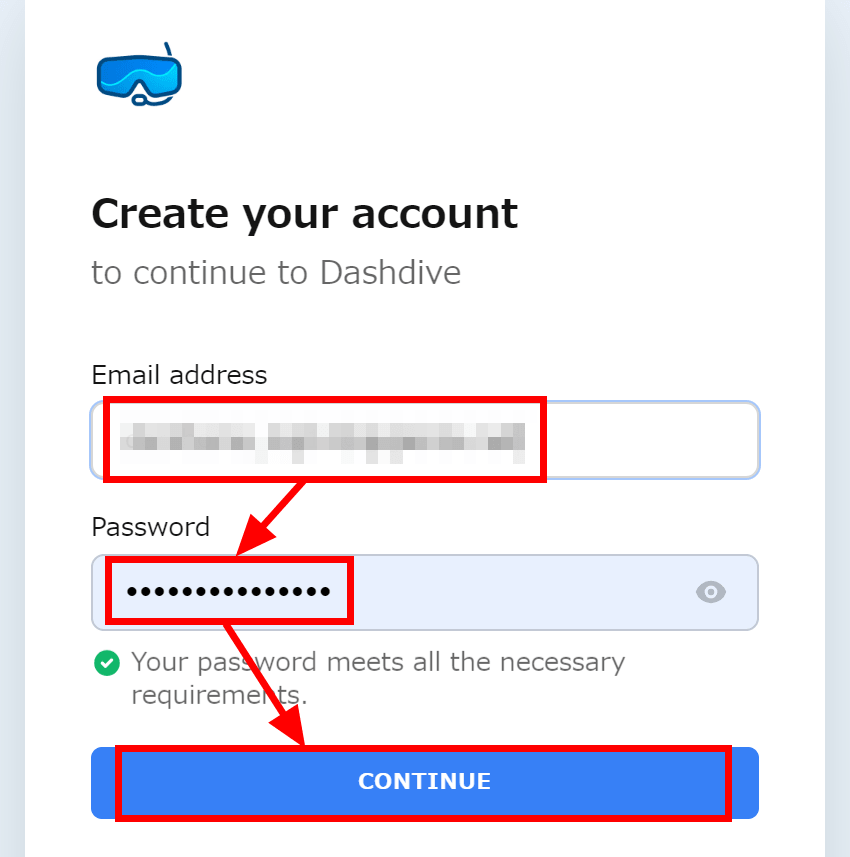
A 6-digit verification code will be sent to you via email.

Registration is complete by entering the verification code on the site.

However, at the time of writing the article, Dashdive's internal team needed to work manually each time each customer registered, so it was not immediately available.

The mechanism of Dashdive is shown below. By sending data to Dashdive's servers every time you use the cloud from the service, Dashdive will store, analyze, and display the data for easy viewing. At the time of writing, only storage services are supported, and

Although I was not able to actually try using it, a dashboard
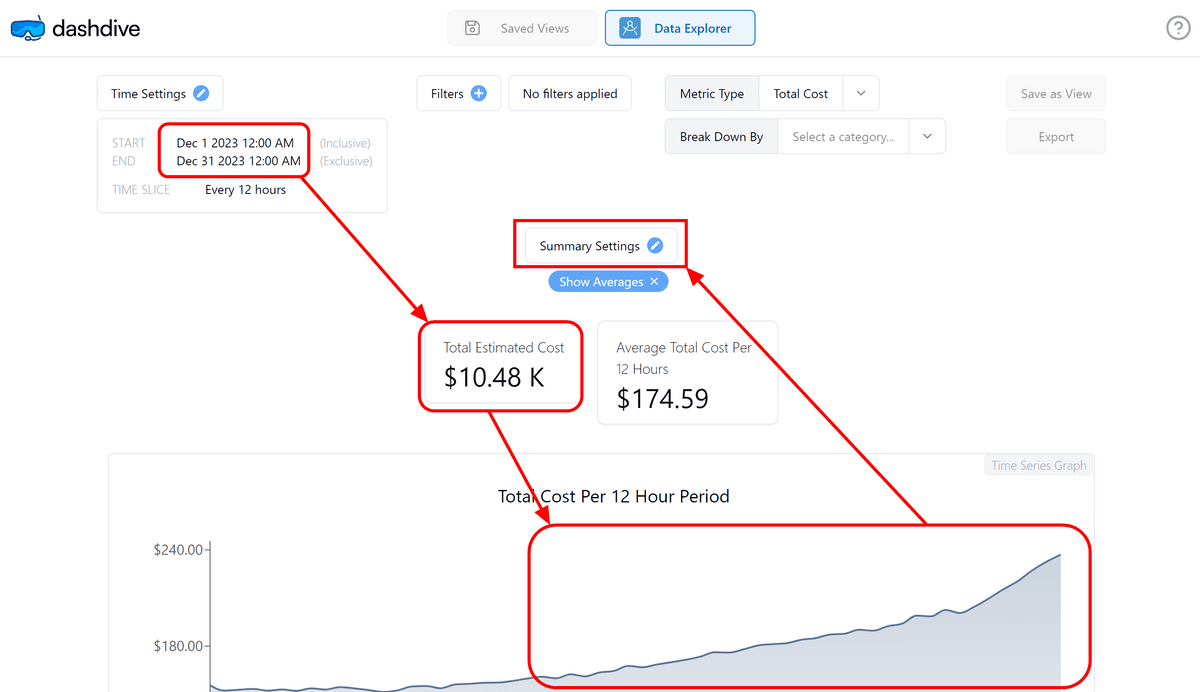
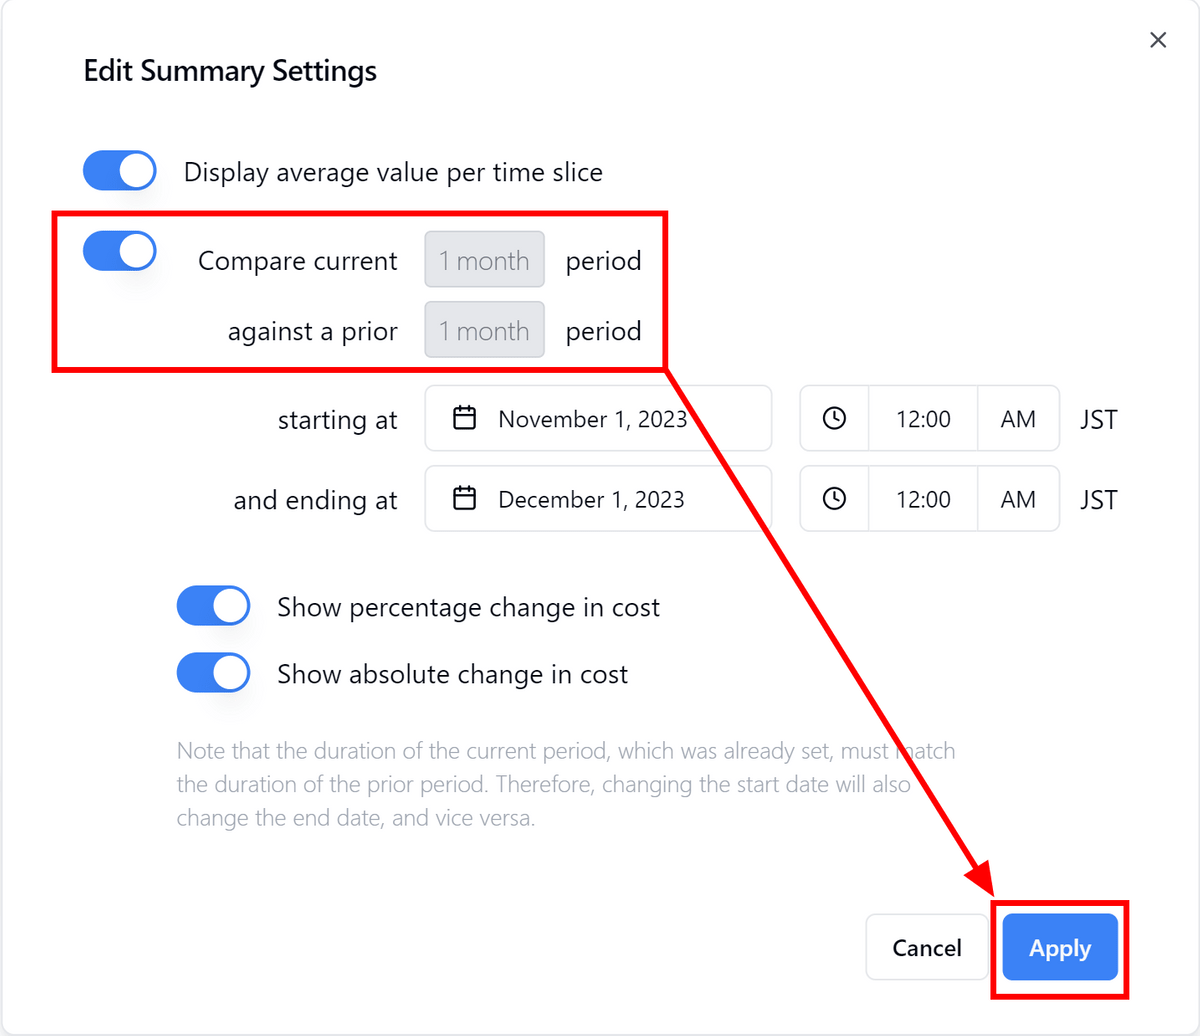
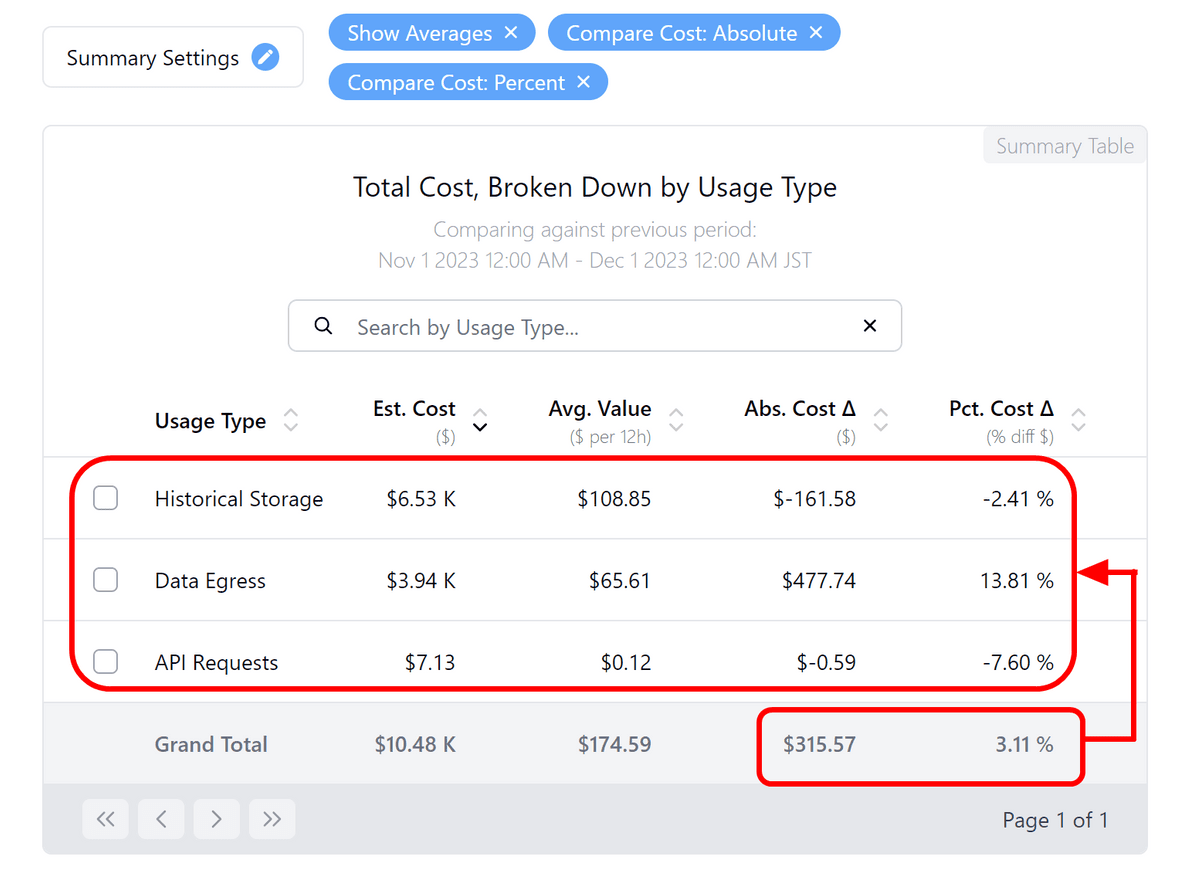
On the 'Summary Settings' screen, you can edit the data displayed in the middle. Enable comparison with last month's data and click Apply.
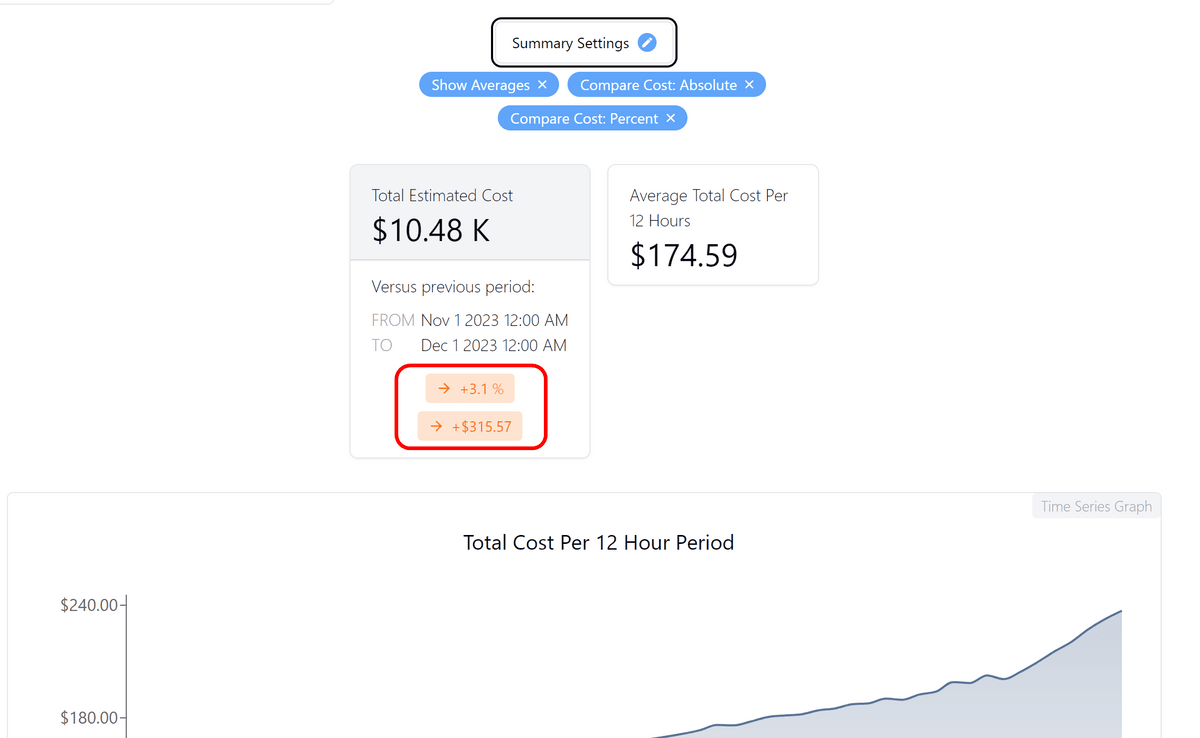
The amount of change from last month is displayed in orange. The cost has increased by 3.3%, and the net amount is $315.57.
Click the arrow mark in the 'Break Down By' item in the upper right corner to display a breakdown by various tags. Click on 'Usage Type'.
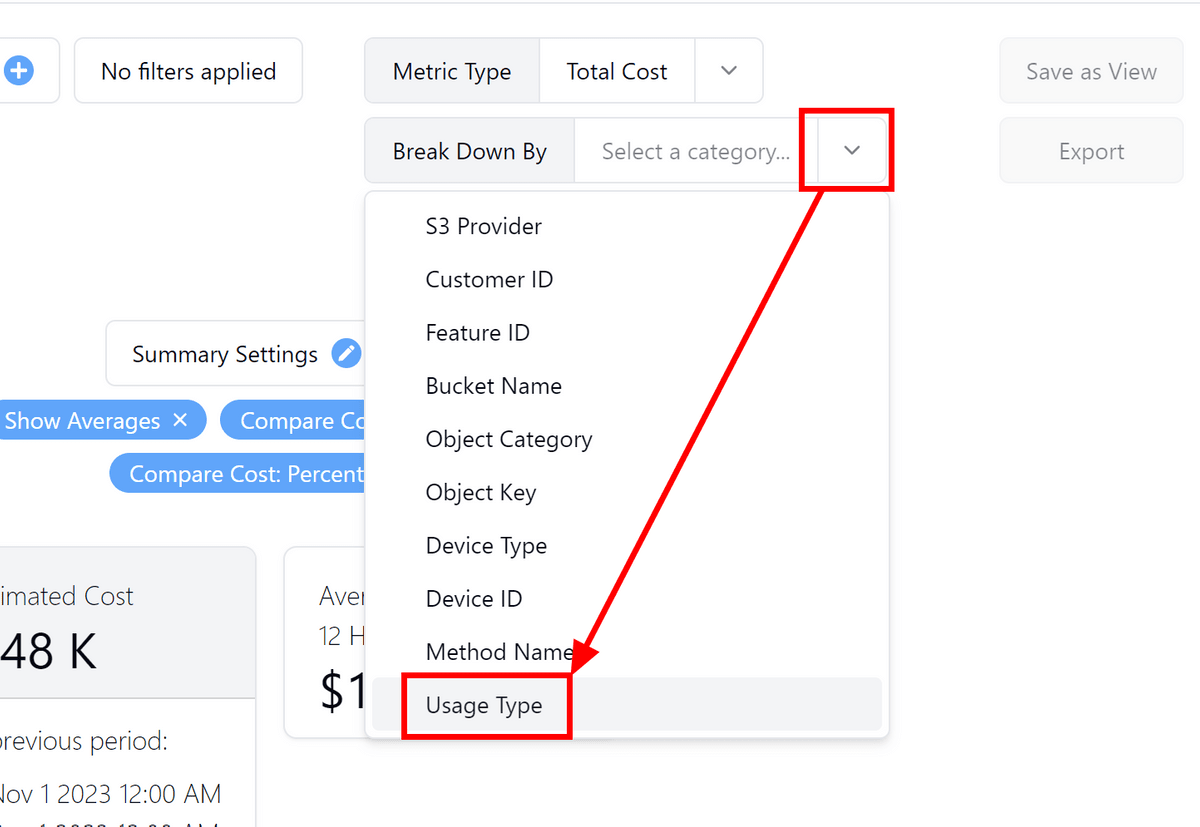
A breakdown of the amount of change for each usage is displayed. You can see that the cost of 'Data Egress (data transfer to the outside)' is increasing.
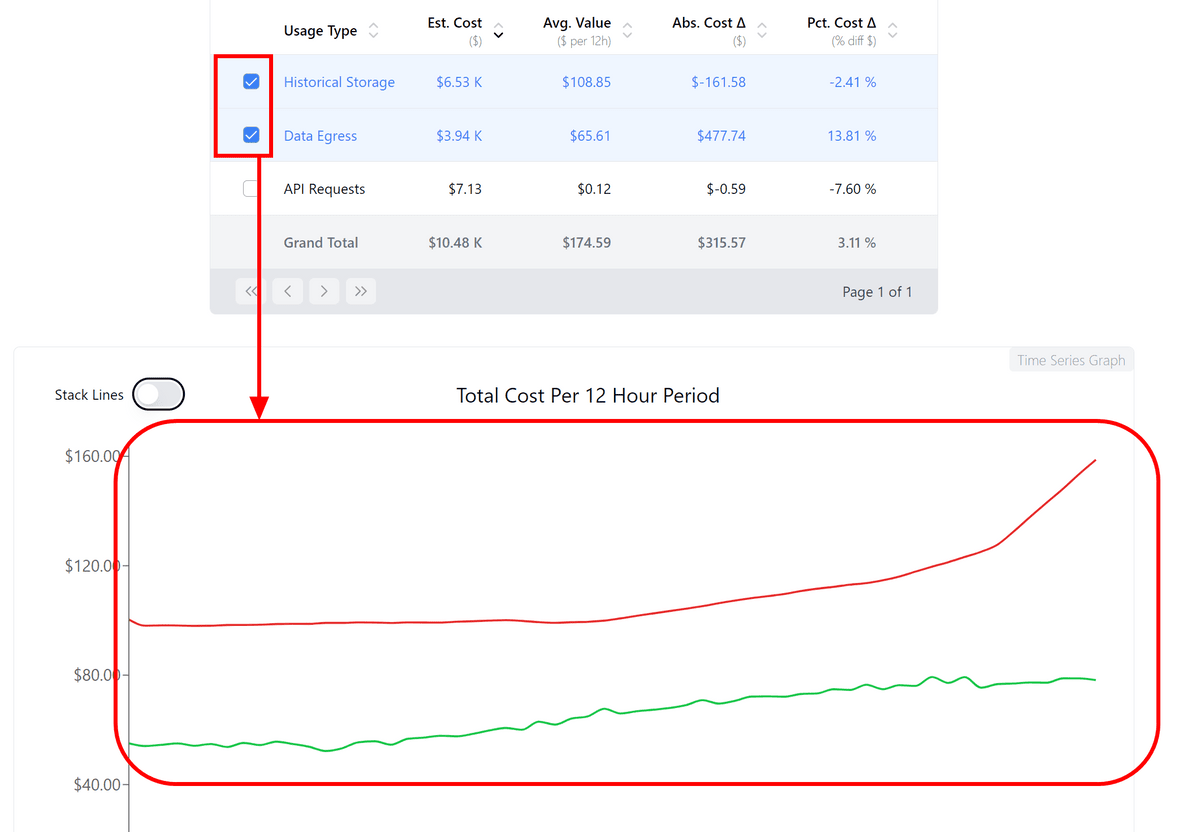
By checking an item, it is also possible to output a graph for only that item.
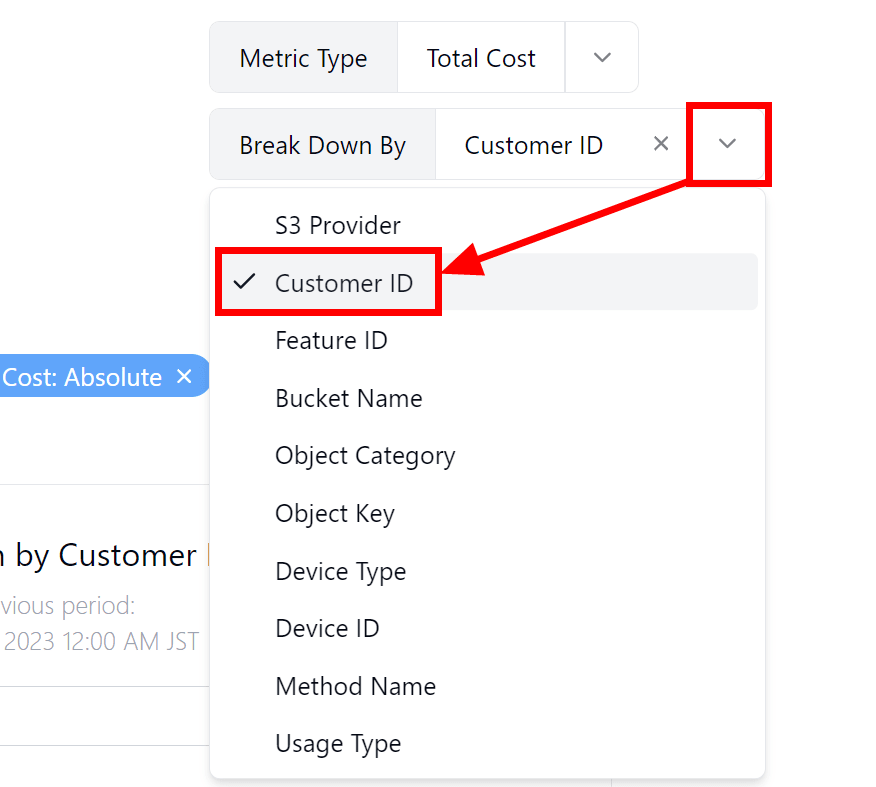
Let's look into the details of the transfer fee. Click 'Filters' at the top left of the dashboard, select 'Data Egress' for 'Usage Type' and click 'Apply'. Now, only data whose Usage Type is set to Data Egress is subject to aggregation.

Select 'Customer ID' for Break Down By.
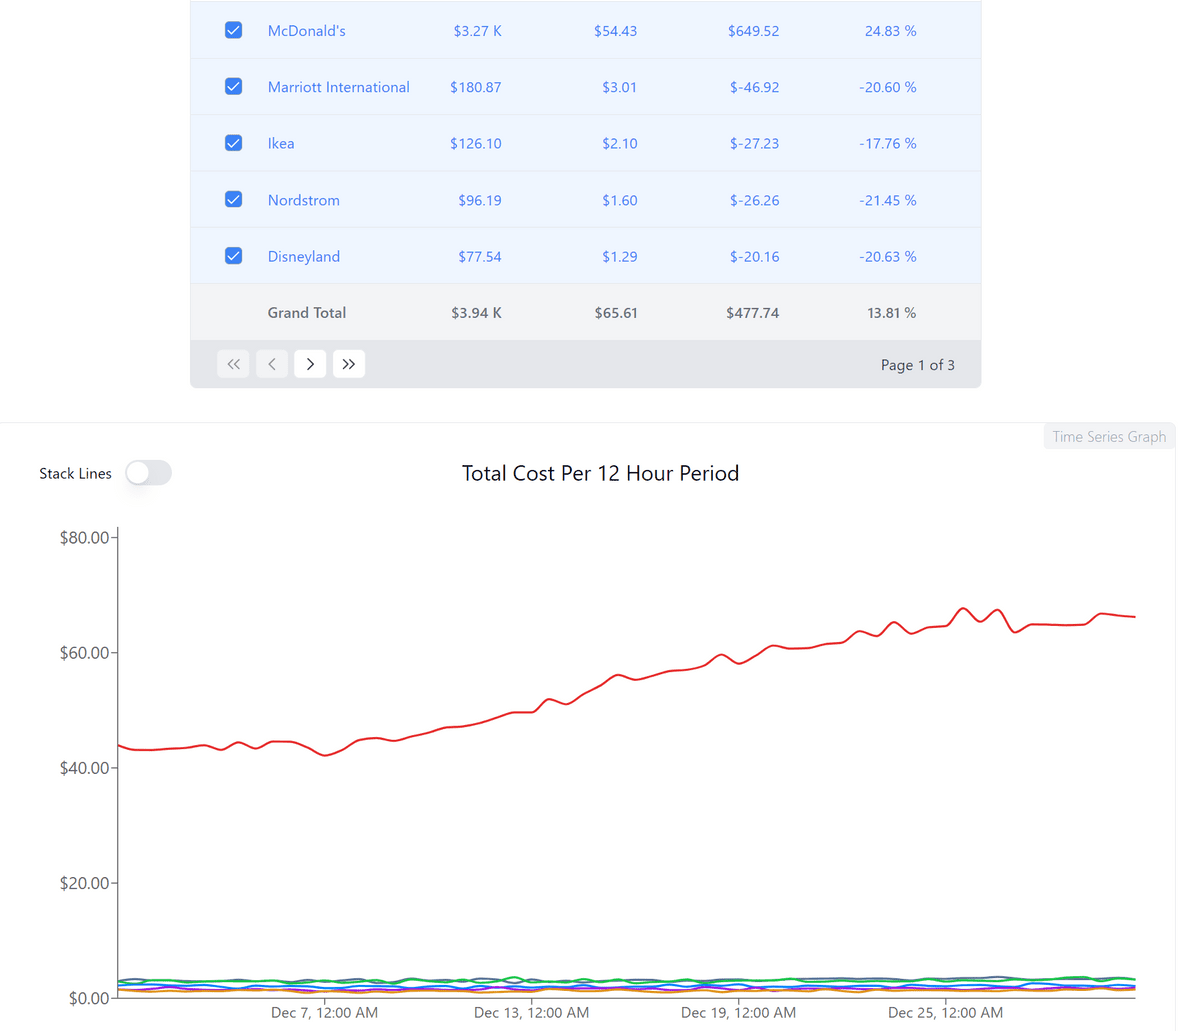
Transfer charges incurred are categorized and output for each user. You can see that the user 'McDonald's' is transferring a considerable amount of data.

It's obvious when you look at the graph.
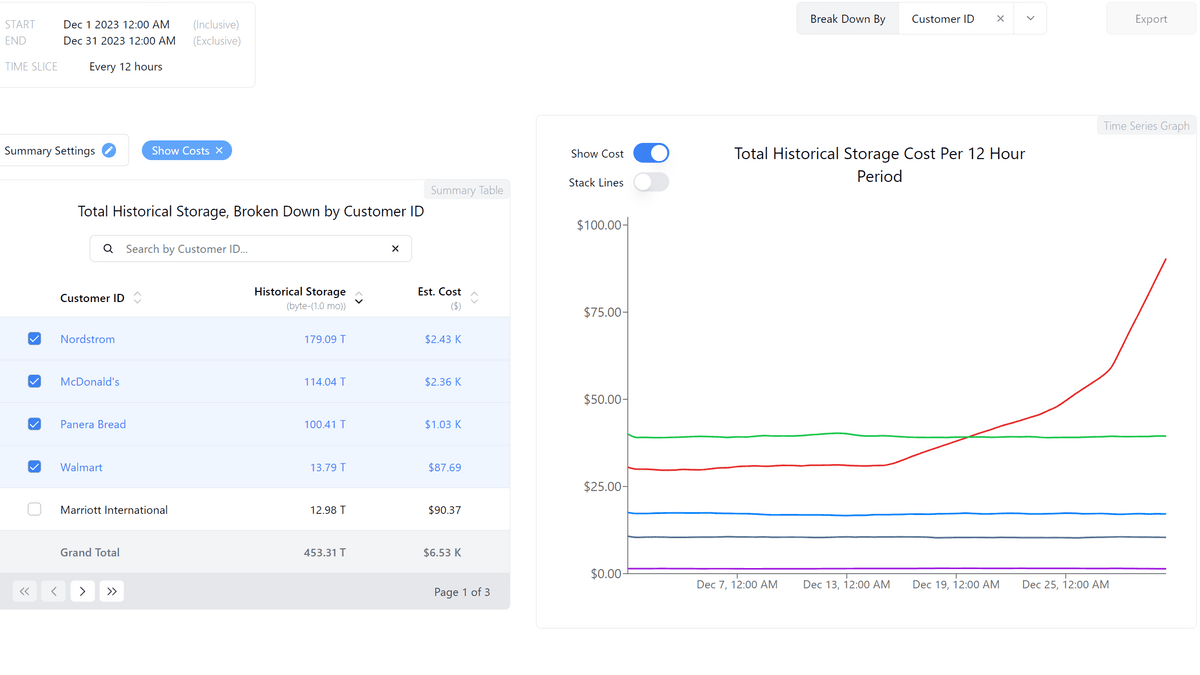
Next, I changed the filter to 'Historical Storage (cumulative storage usage)'.
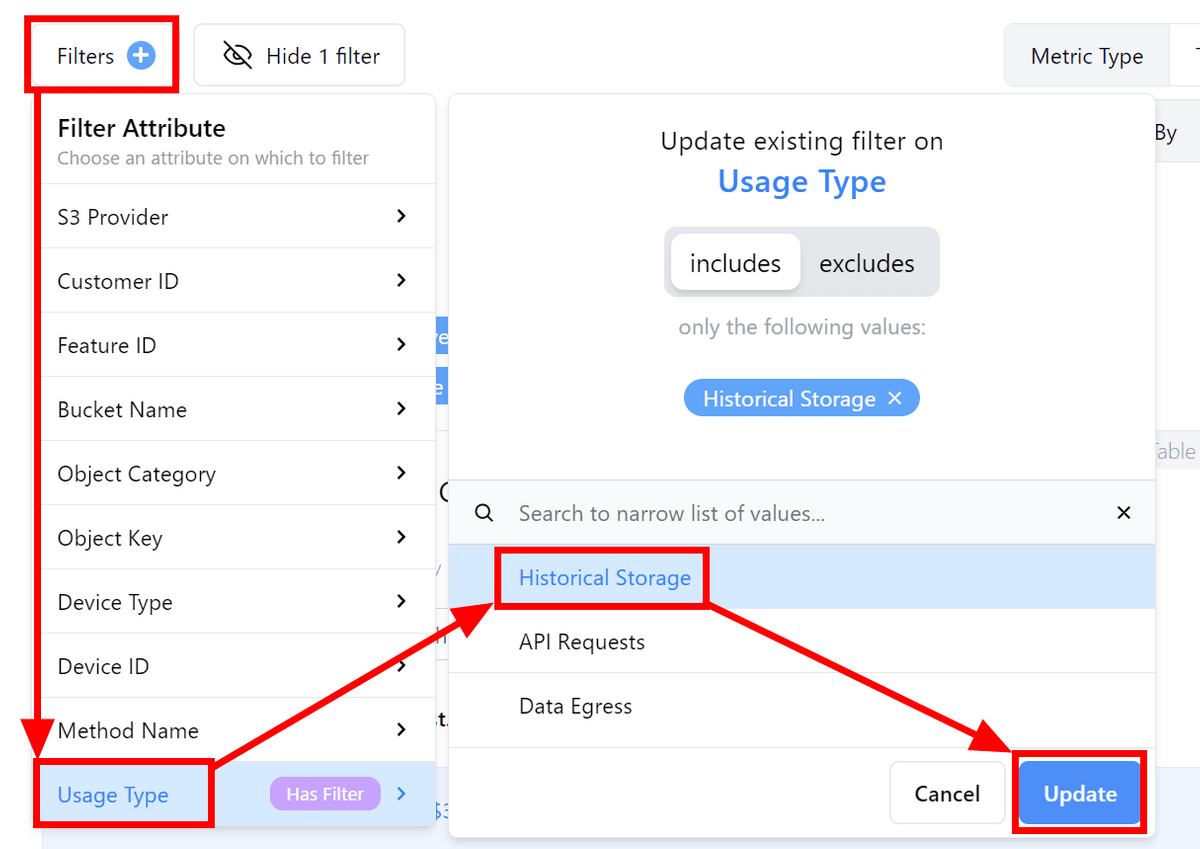
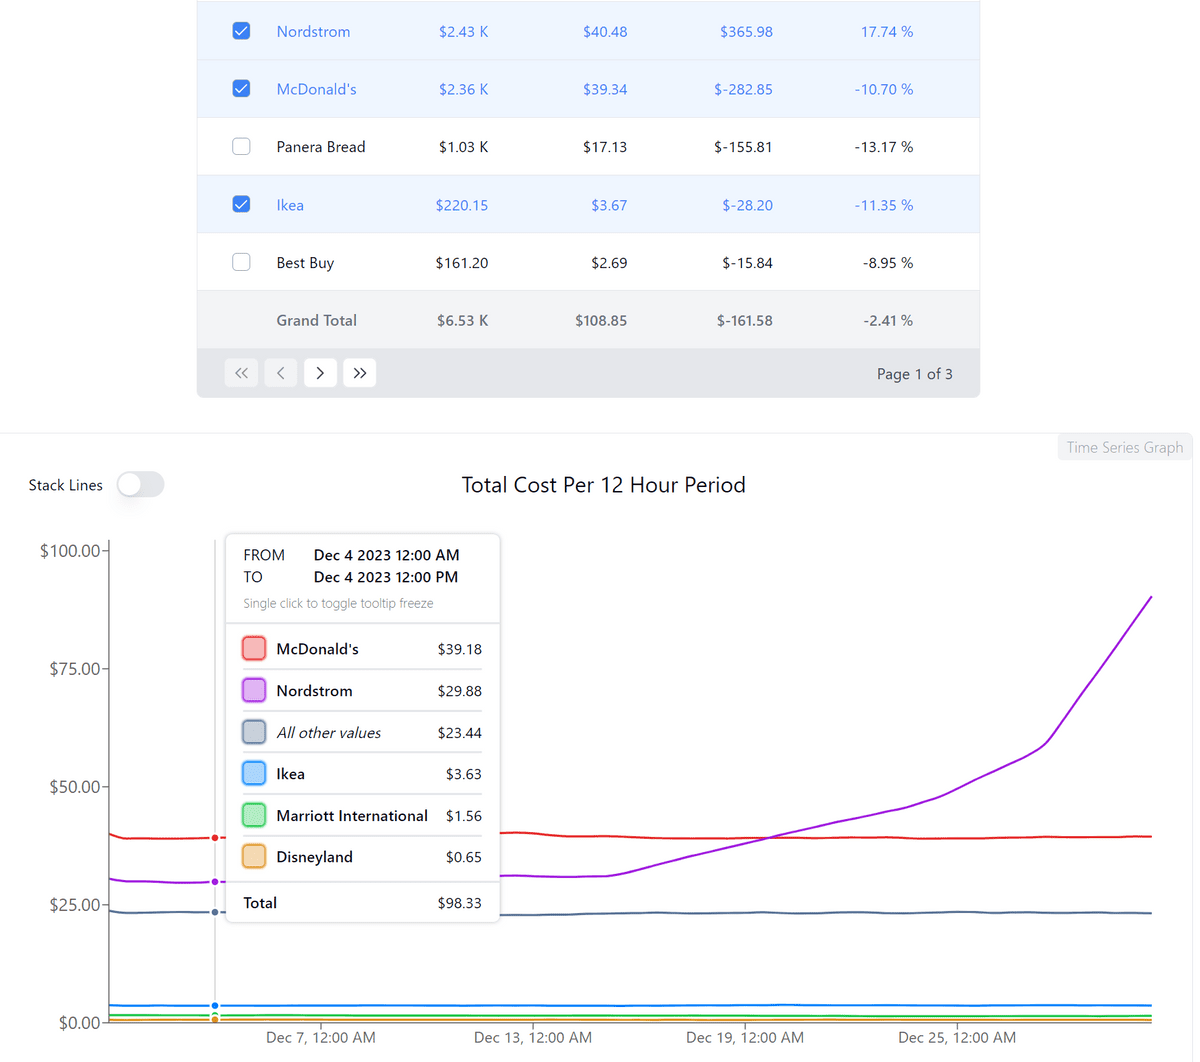
You can see that the storage usage of the user 'Nordstorm' has increased rapidly.
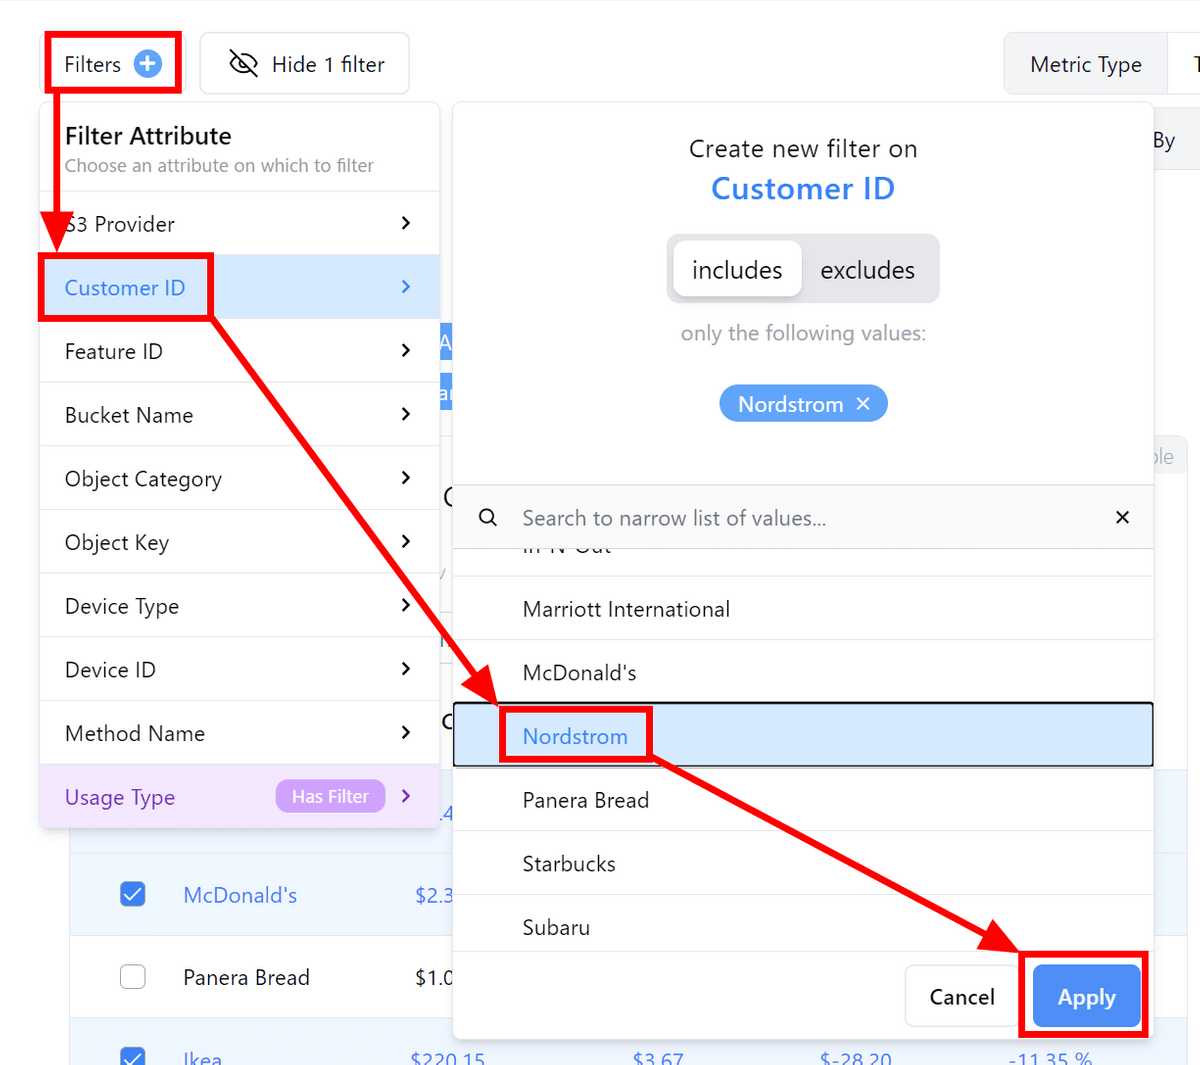
So let's take a closer look at Nordstorm's data. Open the filter, click 'Nordstorm' in 'Customer ID', and click 'Apply'.
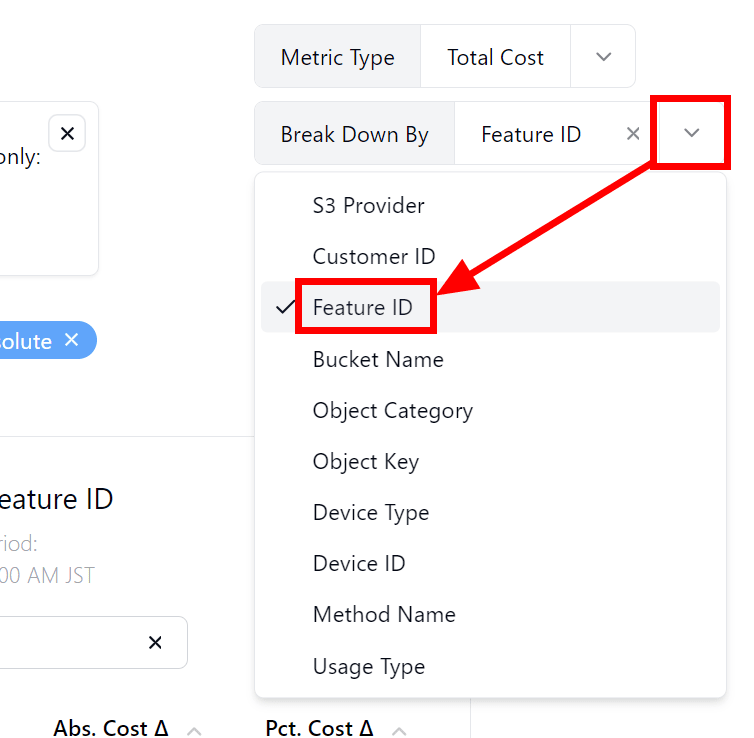
Now that only Nordstorm's cumulative storage usage data is displayed, let's check various metrics in Break Down By. First, click 'Feature ID'.
There is an overall increasing trend, but no clear cause has been found.

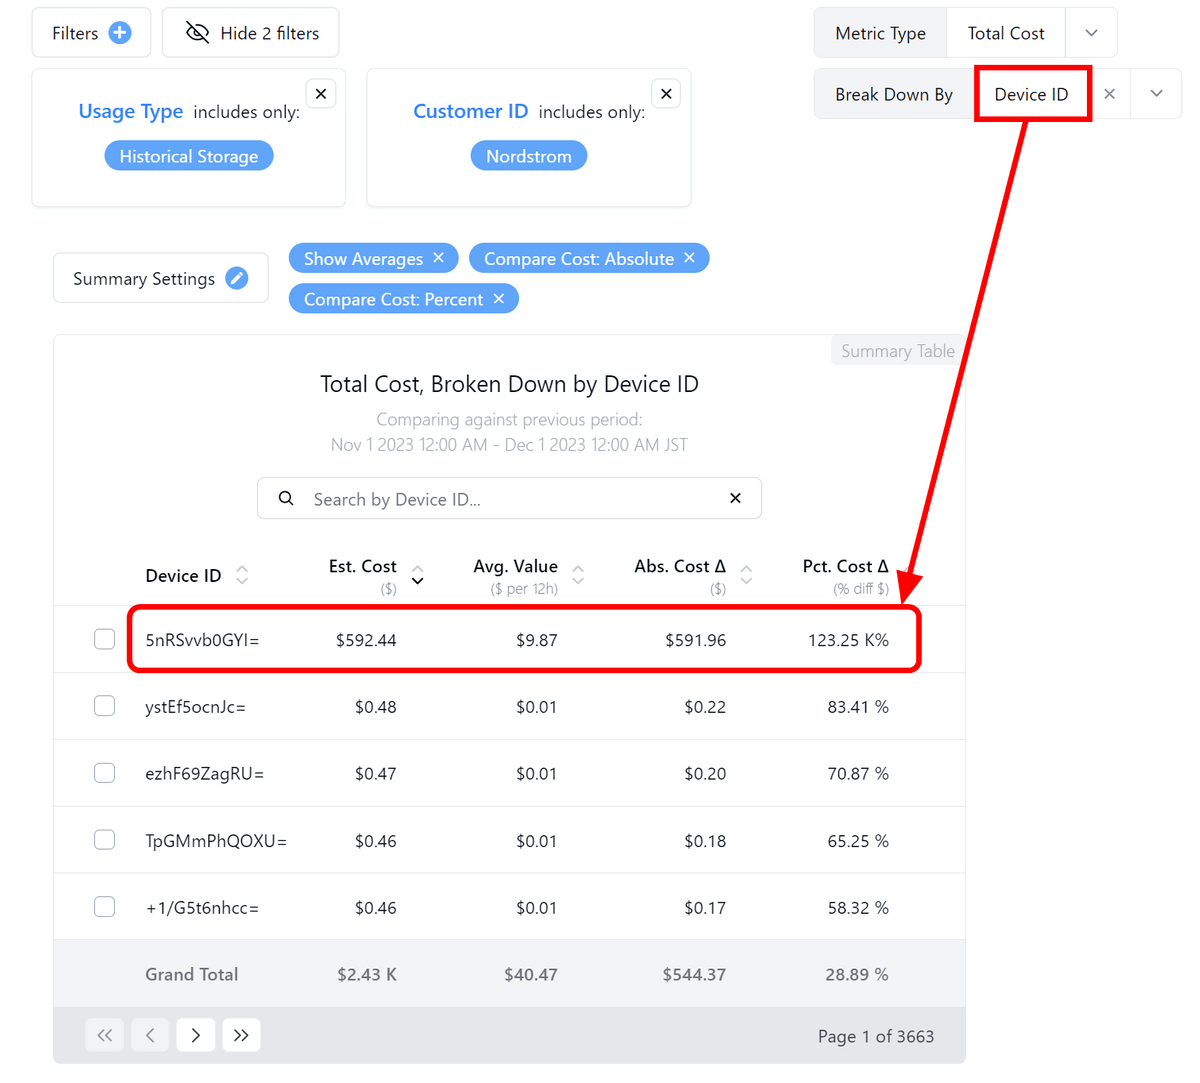
Among the various indicators, when displaying 'Device ID', clearly strange data appeared. Single device usage has increased by 123,250% compared to last month.
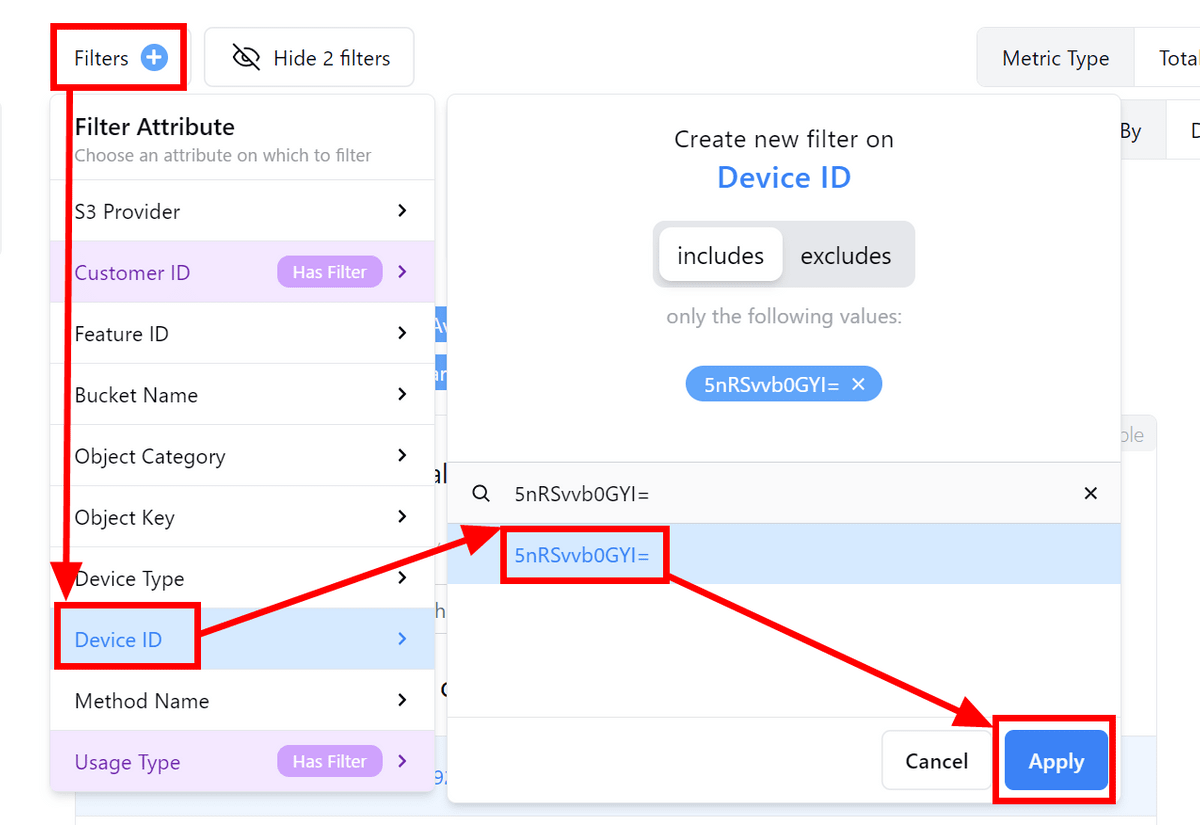
Enter the ID of the device in Filter's Device ID and click Apply to see more details.
It turned out that when the breakdown display was set to 'Object Key', a large number of small objects were generated.

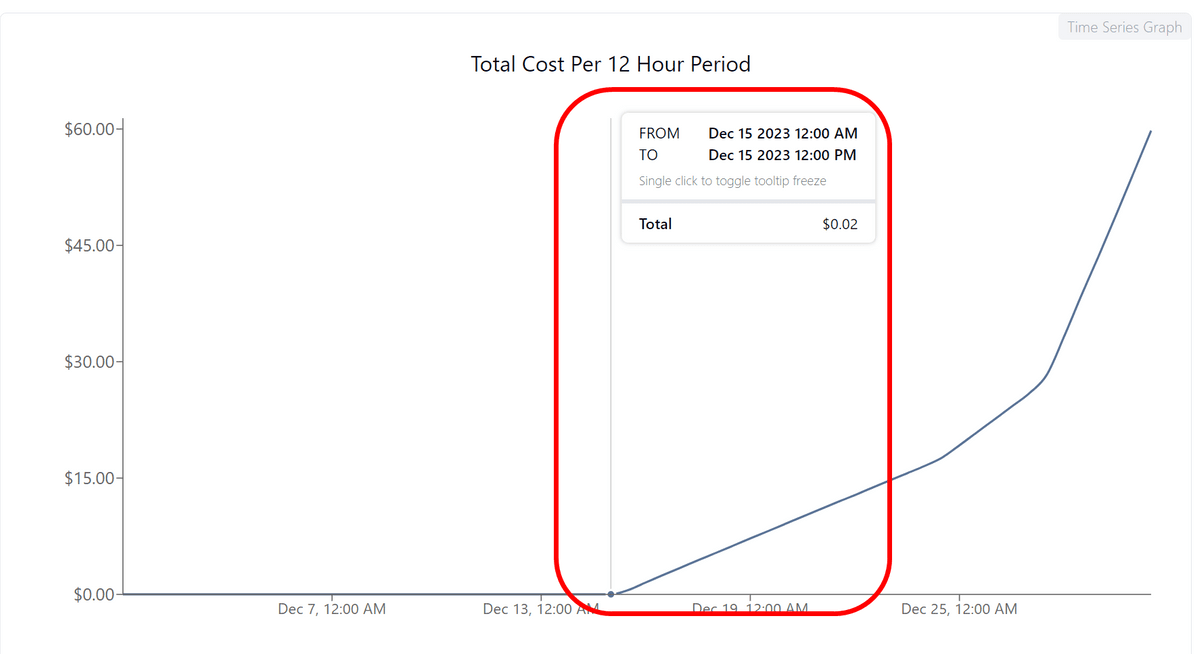
When I checked the graph, I found that everything was safe until the afternoon of December 15th, and I was able to analyze that the cause was the change I made in the morning of December 16th.
This time, usage statistics were displayed in dollars, but it is also possible to display them in terms of API request count, transfer amount, cumulative storage usage, etc.

For example, by setting the statistics type to cumulative storage usage and setting the breakdown display for each user, it is possible to output the cumulative storage usage for each user in one go. This data is available for usage-based billing contracts.

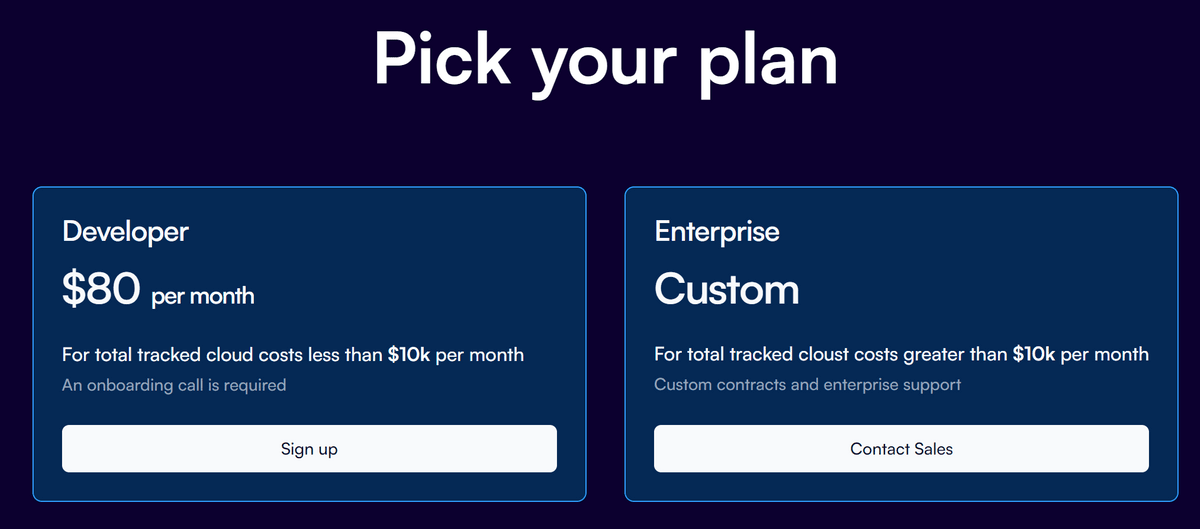
At the time of article creation, users whose total cloud fee is less than 10,000 dollars (approximately 1,490,000 yen) are eligible for the 'Developer' plan of 80 dollars (approximately 12,000 yen) per month, and the cloud fee is 10,000 dollars (approximately 12,000 yen). If the amount exceeds US dollars (approximately 1.49 million yen), it was supported by the enterprise plan.
Related Posts:


in Review, Web Application, Posted by log1d_ts