'Nuclear War Map' that simulates 'what if a nuclear war occurs' on a map, the result of the horror that 26 nuclear warheads dropped in just 3 minutes killed about 1 million people
Since Russia began its invasion of Ukraine on February 24, 2022, governments have imposed economic sanctions on Russia and some companies have taken measures such as excluding Russia from service. Russia, which is becoming more and more isolated, is reported to have
Nuclear War Map: what would happen in a nuclear war?
https://www.nuclearwarmap.com/
'Nuclear War Map' is a tool that simulates 'if a nuclear warhead falls on the United States' based on unclassified textual data on nuclear weapons and open data on physics and fallout patterns on modern weapons. 'It's a realistic simulation based on hard science and known targeting strategies,' said Christopher Minson , a computer scientist who authored 'Nuclear War Map.'
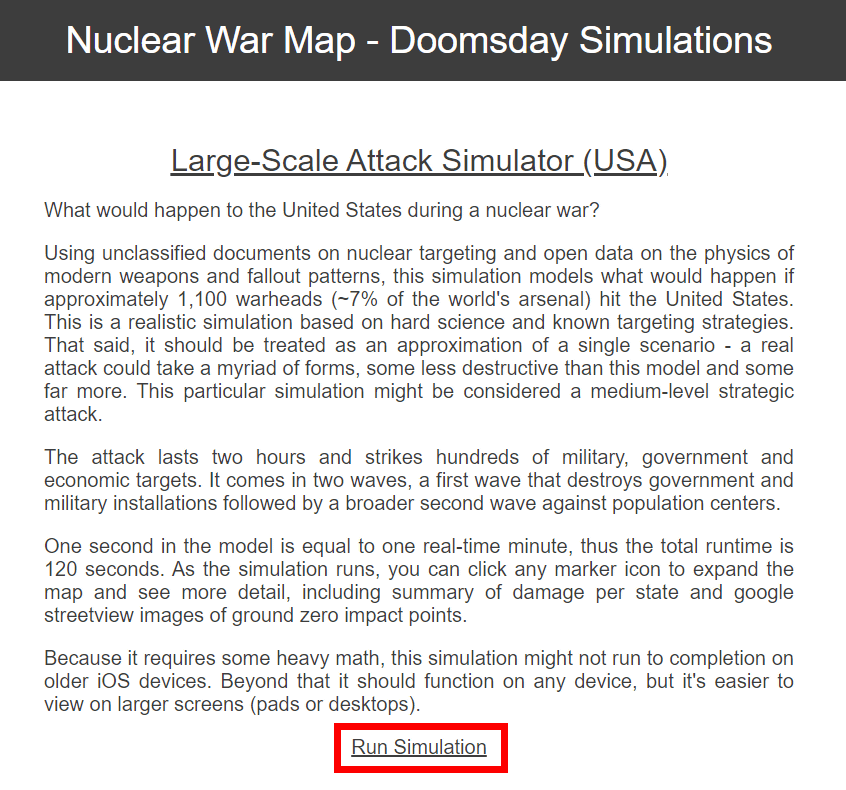
There are two simulations in the 'Nuclear War Map', one is the 'Large-Scale Attack Simulator (USA)' which simulates the case where about 1100 nuclear warheads (about 7% in the world) have fallen all over the United States. 'am. You can start the simulation by accessing the Nuclear War Map and clicking 'Run Simulation' at the bottom of the notation 'Large-Scale Attack Simulator (USA)'.
Click 'launch' at the top left of the screen.
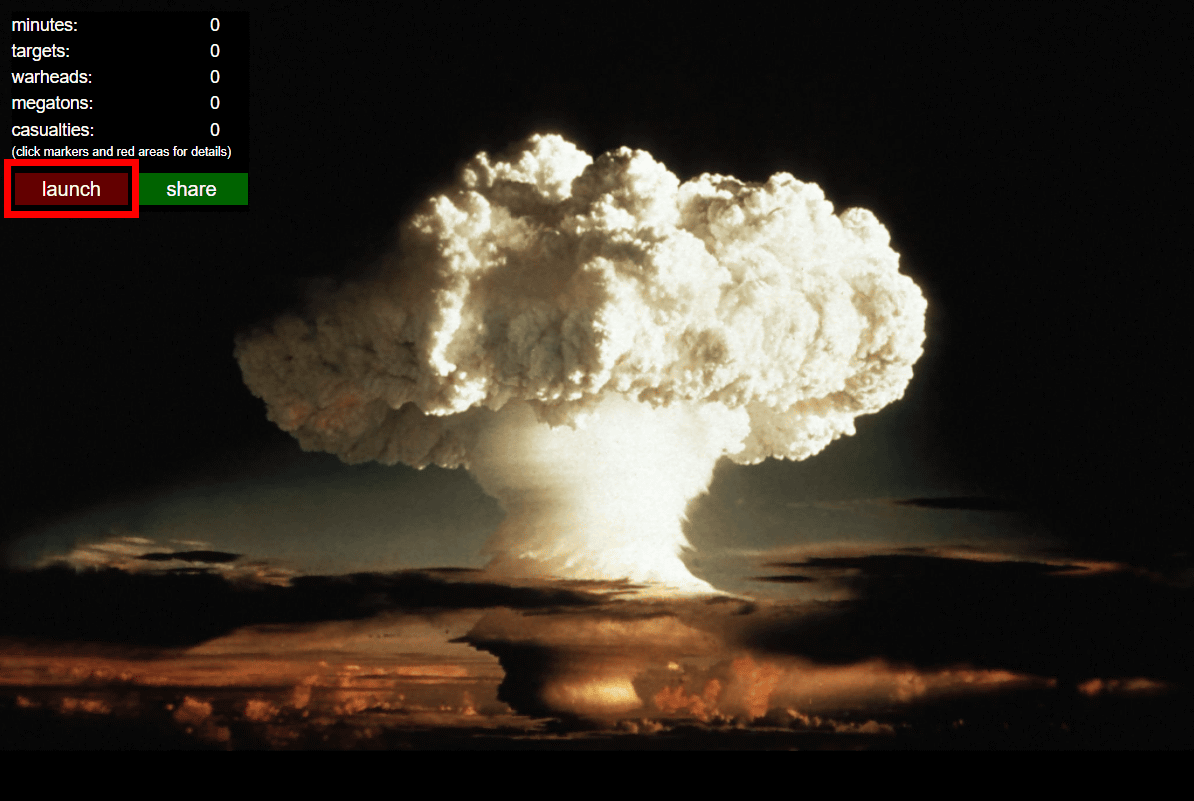
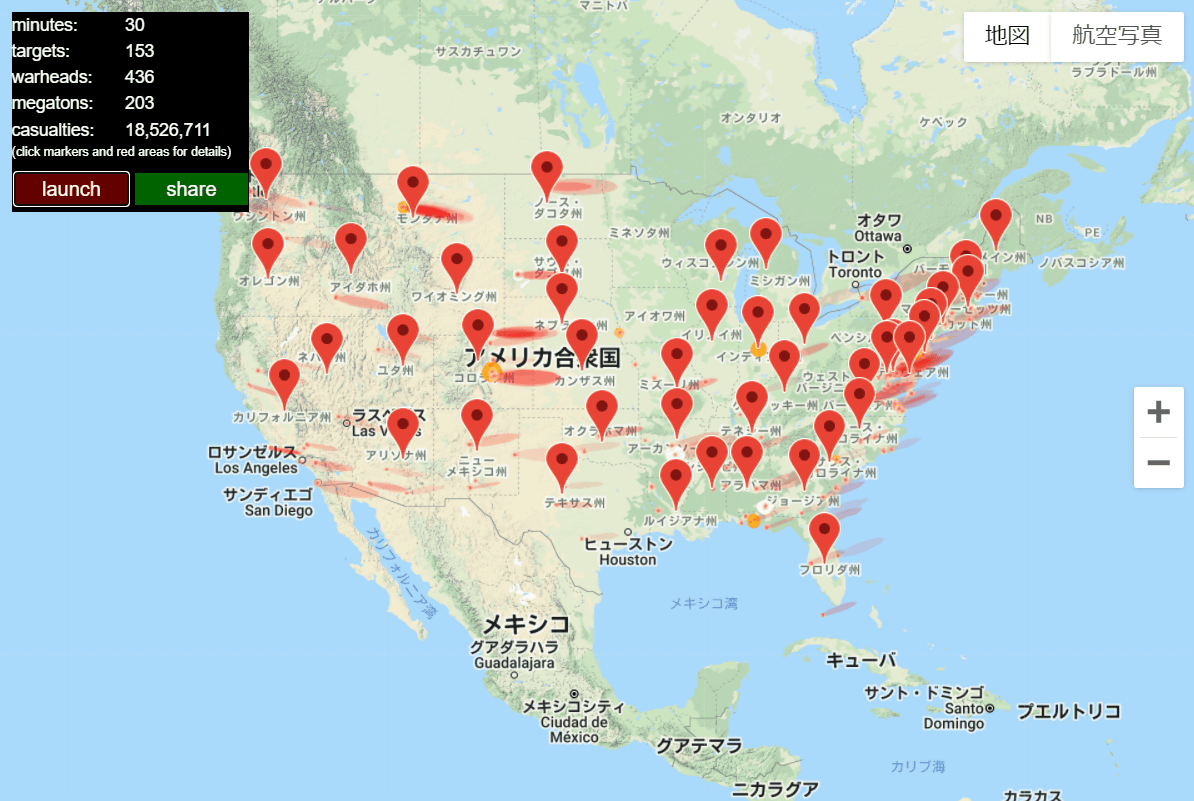
Then a map showing the whole of America is displayed ...

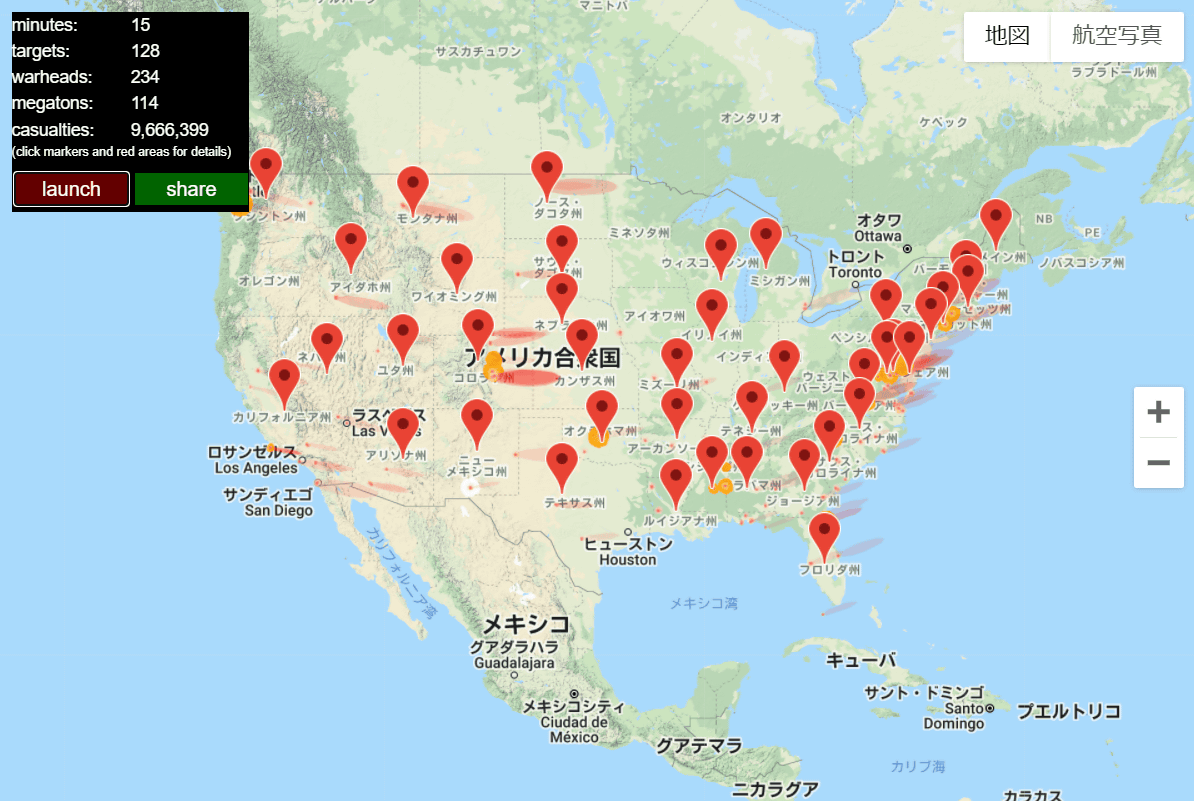
The pin will come down at once. Pins and orange circles on the map are where nuclear weapons were received. At the top left of the map are 'minutes', which represent the time elapsed since a nuclear attack, 'targets,' which represent the number of locations targeted by the attack, and the number of nuclear warheads that have fallen into the United States. 'Warheads', 'megatons' which converted the explosive power of the dropped nuclear warheads into

Fifteen minutes after the start of the nuclear attack, the number of targeted cities was 128, the number of warheads dropped was 234, and the number of casualties had risen to over 9.6 million.
After another 15 minutes, the number of cities targeted by the attack increased to 153, the number of warheads dropped was 436, and the number of casualties increased to over 18 million.
Just 60 minutes (1 hour) after the attack started, the number of cities targeted by the attack was 209, the number of warheads dropped was 684, and the number of victims was over 61 million.

90 minutes after the attack started, the number of cities targeted by the attack was 327, the number of warheads dropped was 847, the number of victims exceeded 110 million, and the number of victims was 100 million. Break through the platform.

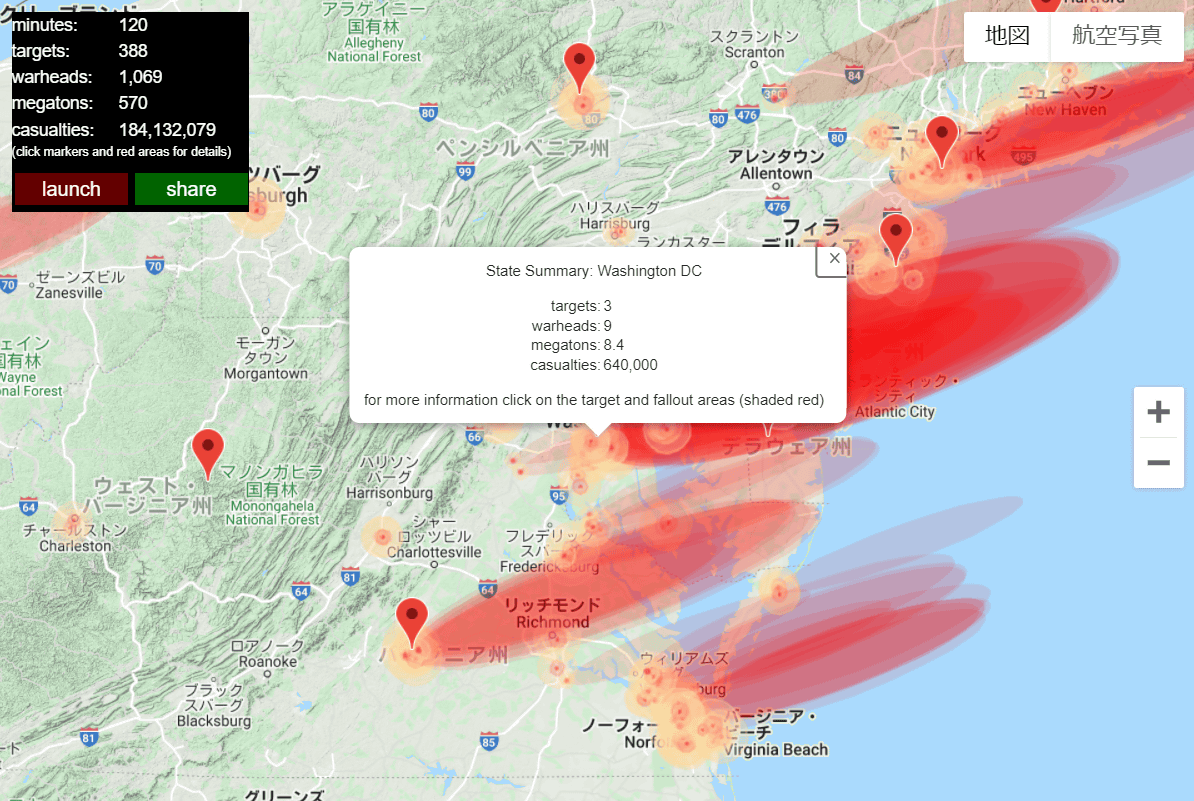
The simulation is 120 minutes (2 hours) from the start of the nuclear attack, the number of cities finally attacked is 388, the number of warheads dropped is 1069, and the number of casualties is over 180 million. .. You can check the numbers by major city by clicking the pin on the map, and in the case of Washington DC, the capital of the United States, the number of warheads dropped is estimated to be 9, and the number of casualties is estimated to be 640,000.
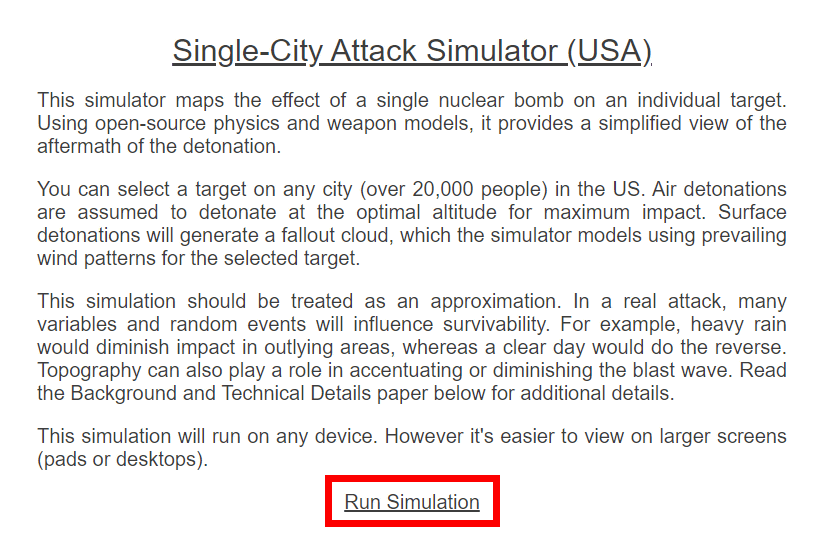
Next, try using 'Single-City Attack Simulator (USA)' at the bottom of the page. 'Single-City Attack Simulator (USA)' can simulate the case where a nuclear bomb is dropped on any city with more than 20,000 inhabitants. It's easy to use, go to the
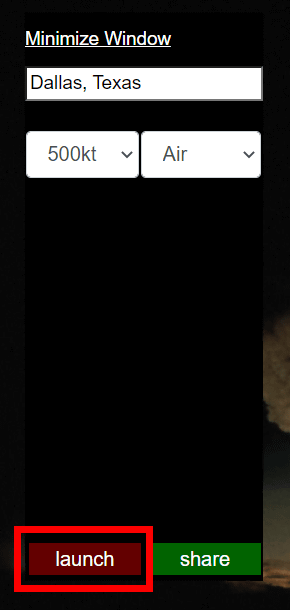
From the top of the screen, you can specify the 'city where the nuclear bomb is dropped', the power of the nuclear bomb, and the position where the nuclear bomb will explode. This time, click 'launch' with the setting that a 500 kiloton (500 kt) nuclear bomb explodes in the air (Air) in Dallas, Texas, which was entered in the initial state.
The map will then show Dallas, color-coded red if 100% of the people in the area die, pink if 100% injured or dead, and yellow if seriously injured or dead. In this case, the area 0.45 miles from the hypocenter is 100% dead, the area 3.47 miles from the hypocenter is 100% injured or dead, and 9.46 miles from the hypocenter. The area will be seriously injured or killed.
Change the location of the explosion without changing the power of the nuclear bomb from 'Air' to 'Surface' and click 'launch'.
Then, the notation on the map changes as follows, and an area extending east from the hypocenter is newly formed in addition to the red, pink, and yellow areas. This is an area that can be killed by fallout, and in the case of this simulation, it seems that the range is 40.89 miles (about 66 km) east of the hypocenter.

Related Posts:


in Web Service, Review, Posted by logu_ii