"NUKEMAP" which can simulate casualties and pollution areas when nuclear bombs are dropped

It is possible to simulate the number of casualties and the extent of the influence by radioactive pollutants by dropping a number of nuclear weapons which have a name in history to a favorite place on the map,NUKEMAP"is. He received a doctorate in historical science from Harvard UniversityAlex WellersteinMr. Mr. creates, and the reason for making it seems to be to understand the possibility that nuclear weapons that often go to the topic may cause destruction.
NUKEMAP by Alex Wellerstein
http://nuclearsecrecy.com/nukemap/
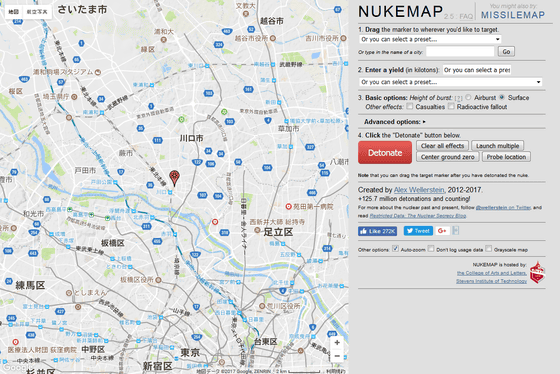
To use NUKEMAP, set necessary information in order from the upper right of the screen. First of all, we decided the hypocenter.
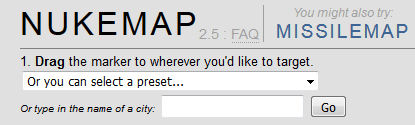
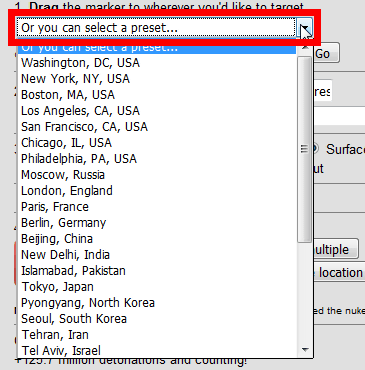
By clicking the red frame part you can choose the world's major cities.
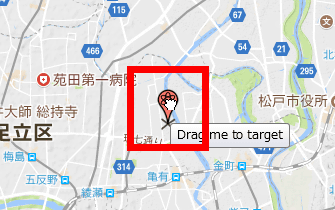
It is OK even if you drag & drop the pin on the map.
Even if you enter the place name in the red frame part and click "Go" ......

You can change the hypocenter.
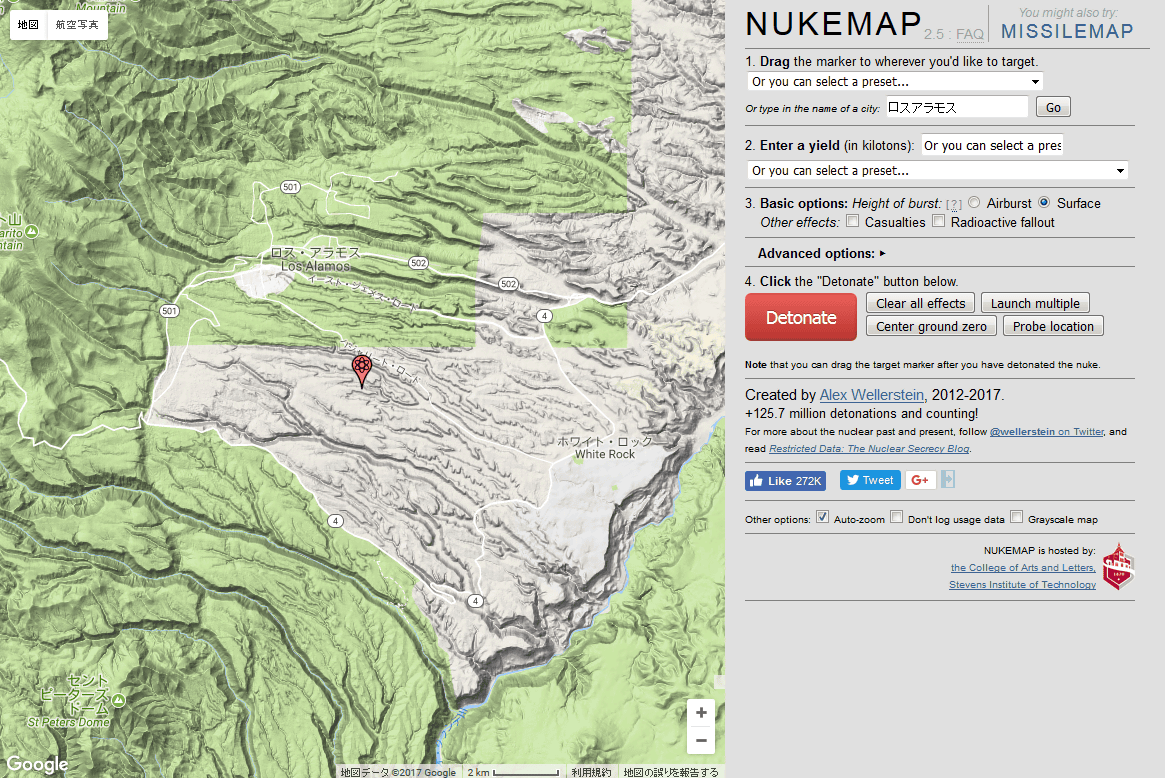
Next, we decide the power of the explosive nuclear bomb.

It is also possible to enter by numeric value, but if you do not know well, you can also refer to the power of successive nuclear bombs by clicking the red frame part. The most powerful thing is the smallest among the bombs created in the United States called "Davy Crockett", and there are other bombs created in the United States that are also operated as MIRV warheads of Minitman III intercontinental ballistic missilesW 78"And the names of" Little boy "and" Fatman "dropped in Hiroshima and Nagasaki in Japan.

Next is optional. "Height of burst" indicates the height at which the bomb explodes, and you have to choose between "Airburst" and "Surface". In addition, "Casualties (casualties)" and "Radioactive fallout (radioactive fallout)" can be selected as options.

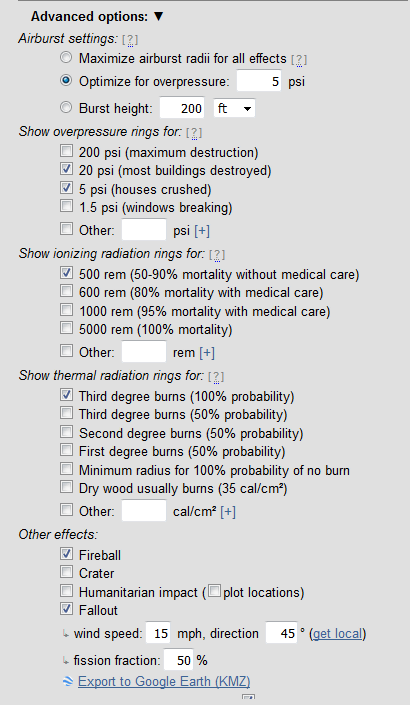
Furthermore, when you click the black triangle of "Advancex options" which is arranged small under it ... ...

You can set details on explosion in the air, the power of shock wave caused by explosion, ionizing radiation, thermal radiation, as well as wind direction and wind speed during explosion.
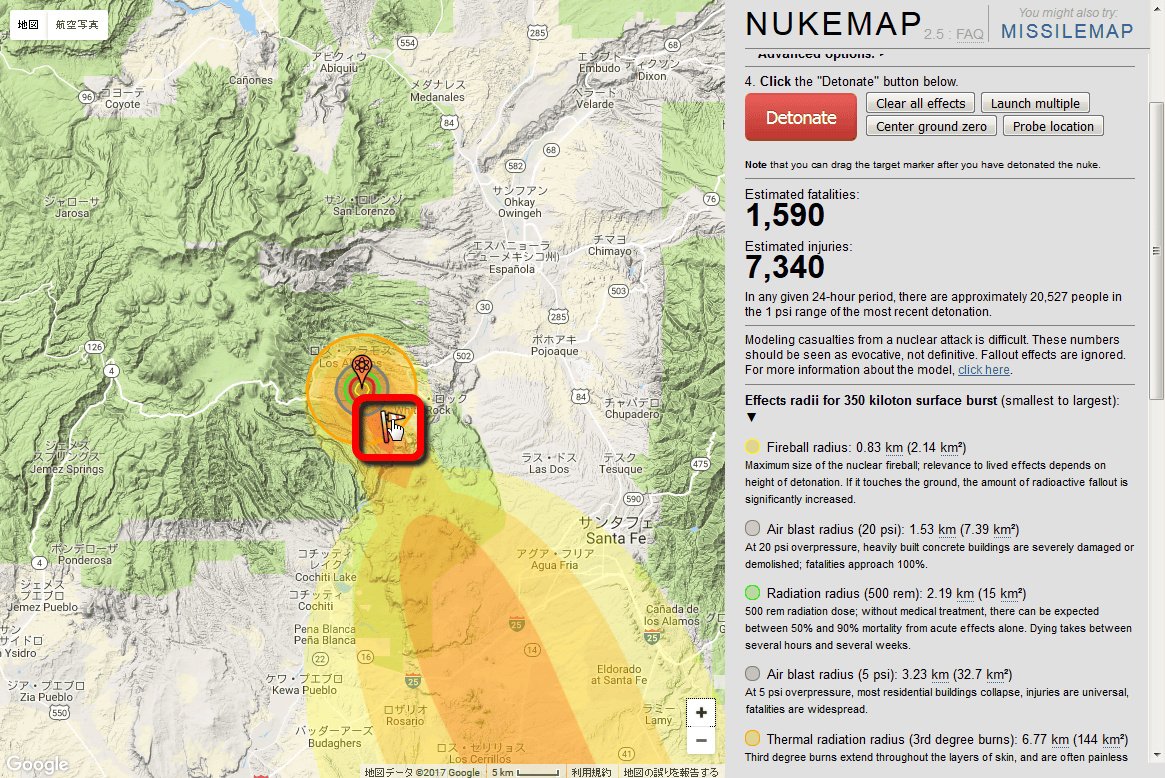
When all settings are completed, click "Detonate".

The simulation result will be displayed on the map.
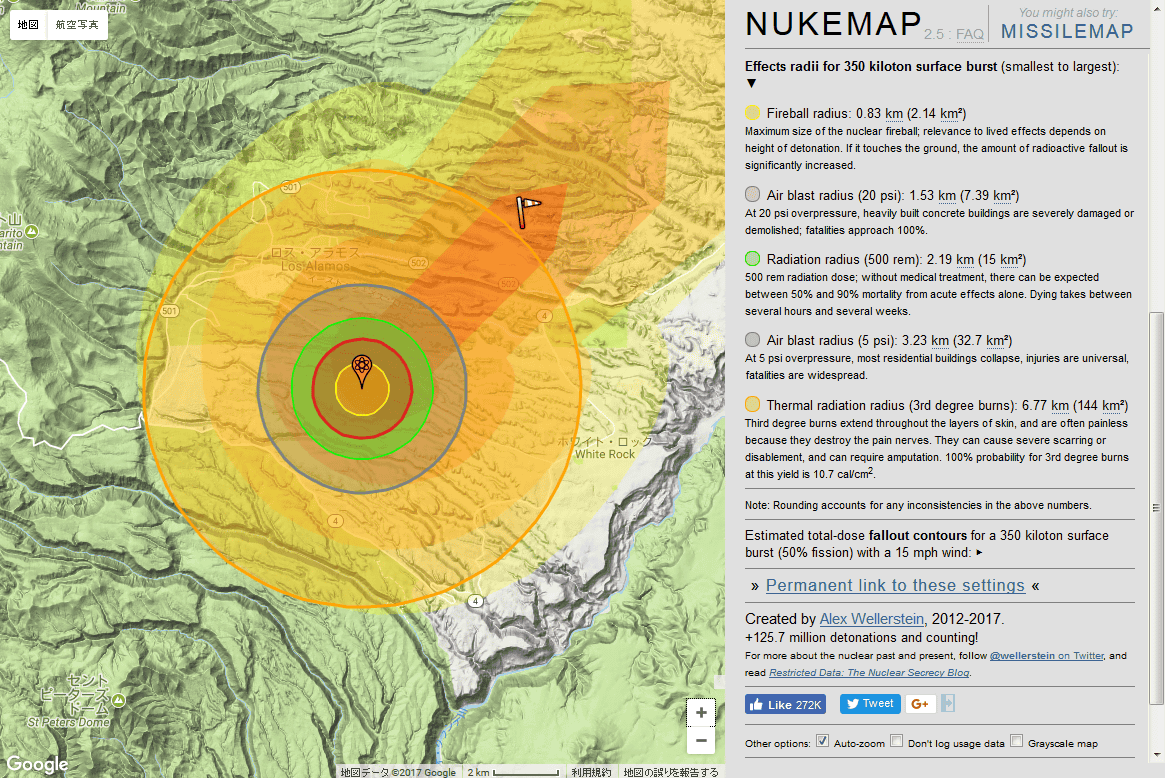
The estimated death toll is 1,590 people, the number of injured people is 7340 people.

The meaning of each color on the map is as follows. The yellow circle is the size of the fireball caused by the explosion. Purple circle is an area where pressure due to explosion exceeds 20 psi, in which concrete buildings are also destroyed, and human beings die nearly 100%. Green colorDose equivalentIs in the area exceeding 500rem, in the absence of medical treatment, the probability of death due to acute effect ranges from 50 to 90%. The blue circle is an area where pressure due to explosion is up to 5 psi, most buildings collapse and many casualties come out. And an orange circle is a person within rangeThird degree burnRange to bear.

For each area where the wind speed of 15 mph (about 6.7 m / s) is blowingAbsorbed doseIs 1 rads for yellow (maximum 275 km from the hypocenter), 10 rads for orange (up to 192 km from the hypocenter), 100 rads for dark orange (maximum 108 km from the hypocenter) up to 9 km ahead of the hypocenter ) Is 1000 rads.

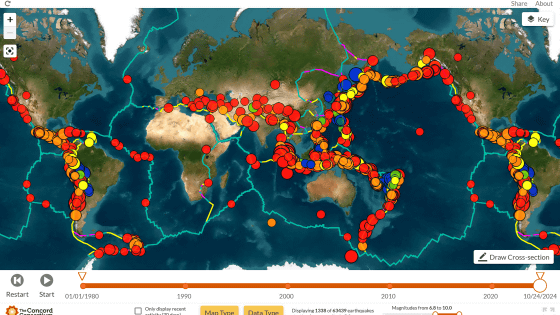
If you display the map in a wide area, you can see how wide the affected area is.
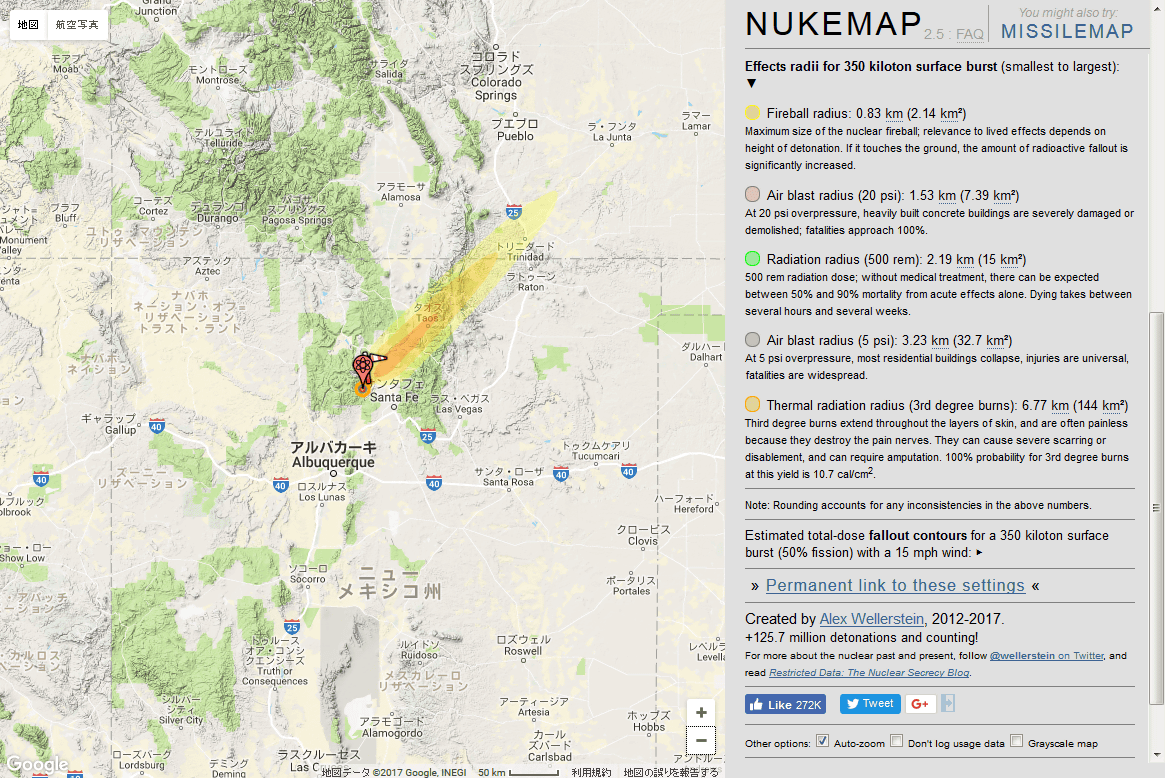
The flag icon on the map can be freely changed in position by dragging and dropping. As the wind direction also changes and the influence range also changes as you change the location, click "Detonate" again to see the number of casualties and others It is necessary to recalculate.
Related Posts:
in Web Service, Review, Posted by logu_ii