AWS announces Amazon Managed Service for Prometheus (AMP), a managed service for the monitoring tool Prometheus
Amazon's cloud service AWS has announced ' Amazon Managed Service for Prometheus (AMP) ', which provides the monitoring tool
Preview Start – Amazon Managed Service for Prometheus (AMP) | Amazon Web Services Blog
https://aws.amazon.com/jp/blogs/news/join-the-preview-amazon-managed-service-for-prometheus-amp/
Getting Started with Amazon Managed Service for Prometheus | AWS Management & Governance Blog
Prometheus is a system monitoring tool developed by SoundCloud that was donated to the Cloud Native Computing Foundation (CNCF) in 2016 and became an open source project. Prometheus uses a pull-type architecture that collects data from monitored objects, and is characterized by its ease of construction. We have a track record of introduction in large-scale services such as Yahoo! JAPAN and AbemaTV.
A preview version of 'Amazon Managed Service for Prometheus (AMP)' provided by AWS for Prometheus was released at Amazon's technical event ' AWS re: Invent '. AMP has full compatibility with the same metrics and PromQL language as regular Prometheus, and is compatible with over 150 Prometheus Exporters. Since AMP is executed across multiple Availability Zones , it is possible to ensure redundancy, which is an issue when operating Prometheus. Cortex also provides scalability for large systems.
At the time of writing, AMP is a preview version, and the supported regions are limited to Europe (Ireland), Europe (Frankfurt), US East (N. Virginia), US East (Ohio), US West (Oregon), but AWS If you have an Oregon account, you can use it without applying.
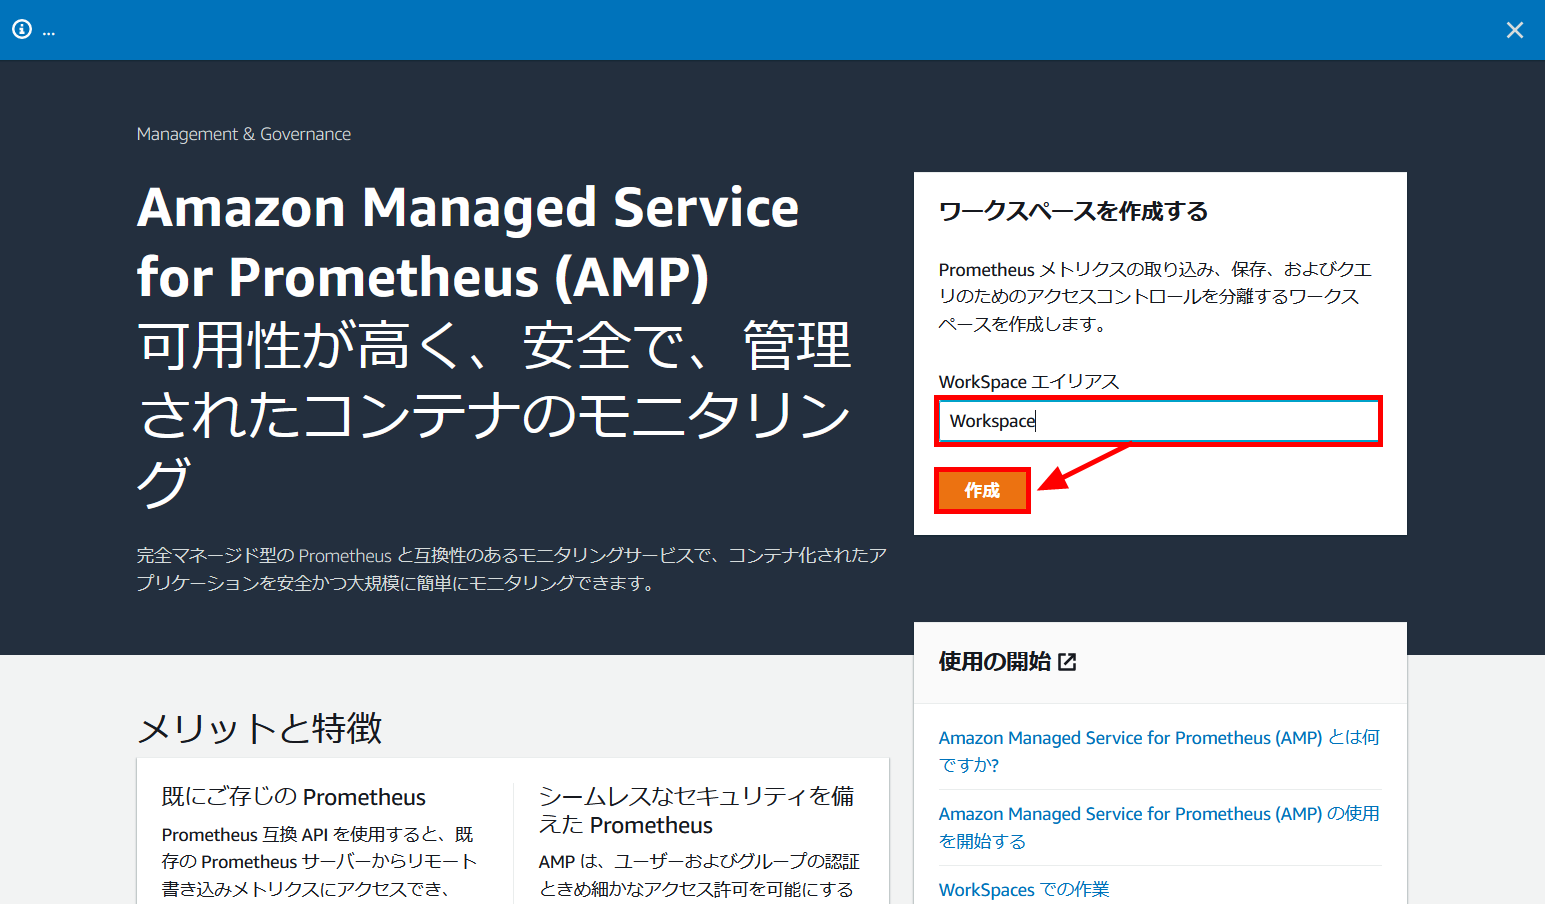
Amazon Managed Service for Prometheus (AMP)
https://console.aws.amazon.com/prometheus/home/
First, access the above URL while logged in to AWS, enter the workspace name and click 'Create' ...
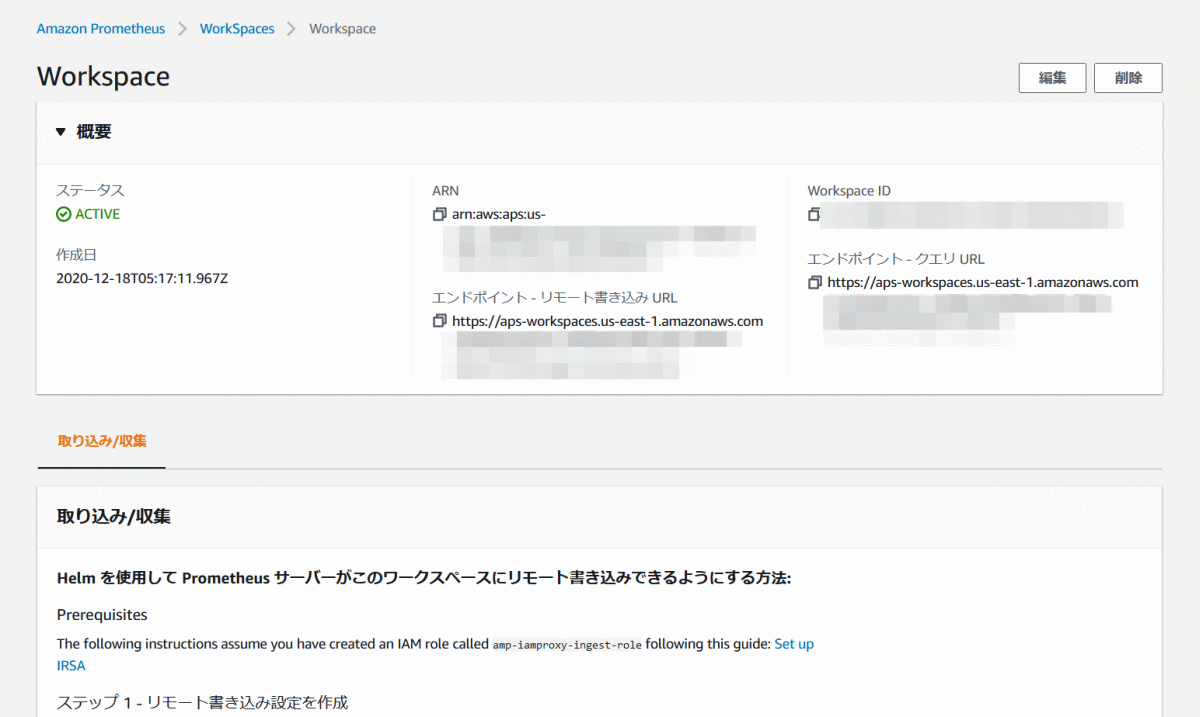
The workspace has been created. You can send metrics from your existing Prometheus server to the write endpoints shown here and read the metrics from the query endpoint. In addition, AWS-signed version 4 is required for data transfer, so metrics can be safely transferred even when using Prometheus over the Internet.
At the time of writing the article, AMP itself does not have a metric collection function, so I felt that the nature of AMP was more like 'Prometheus remote storage' than a complete Prometheus managed service. As a usage pattern of AMP, it seems that an approach such as running Prometheus dedicated to scraping on the monitored node and transferring metrics to AMP seems to be conceivable. The cost of using AMP is as follows.
・ First 2 billion samples: $ 0.002 (0.21 yen) / sample
・ Next 50 billion samples: $ 0.0015 (0.16 yen) / sample
・ 52 billion samples or more: $ 0.001 (0.10 yen) / sample
・ Metrics storage: $ 0.03 (0.31 yen) / GB
-Fraction required for query processing (QPM): $ 0.142 (14.71 yen) / QPM
For the first 90 days of using AMP, you can use AMP for free if the following conditions are met.
・ Number of samples: Within 40 million samples
-Total query processing time: within 60 minutes
・ Metric data size: 10GB
At the same time as the announcement of AMP, the AWS managed service ' Amazon Managed Service for Grafana ' of ' Grafana ', which is often used for visualizing metrics of Prometheus, was also announced and can be used in cooperation with AMP.
Introducing Amazon Managed Service for Grafana (Preview) | Amazon Web Services Blog
https://aws.amazon.com/jp/blogs/news/announcing-amazon-managed-grafana-service-in-preview/
Related Posts:


in Web Service, Posted by darkhorse_log