The success or failure of the monthly billing subscription method cannot be evaluated correctly based on the 'user churn rate' alone.

Is the business of
You're all calculating churn rates wrong | CatchJS
https://catchjs.com/Blog/Churn
The churn rate is generally calculated as 'the number of users who canceled in one month / the number of contracted users at the beginning of the month'. Venture capital firm Andreessen Horowitz lists churn rates as one of 16 metrics for assessing Software as a Service (SaaS) startups that offer subscription-based services.
For example, if the churn rate per month is c , the probability that a customer will continue to subscribe for n months can be calculated as (1-c) ^ n . If the churn rate per month goes down, the number of months the user contracts lasts will increase, and it can be evaluated that the service is going well.
However, the churn rate is not constant, as the 'churn rate of users within 1 month of contract' and the 'churn rate of users within 12 months of contract' are significantly different. Also, if you are developing a service such as '1 month free trial', the churn rate will change even more. Therefore, CatchJS argues that the churn rate alone cannot simply assess the success of subscription-based SaaS.
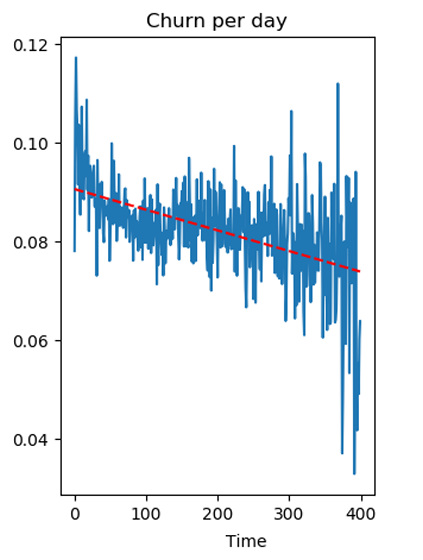
For example, the graph below summarizes the churn rate and the number of days elapsed per day. As the average churn rate (dotted red line) gradually declines, it appears that service improvements are extending the user's life cycle.

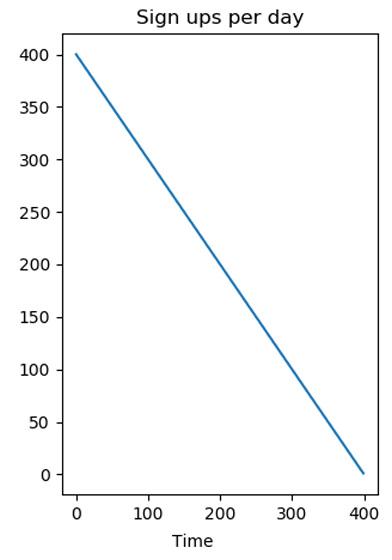
However, in reality, as you can see from the graph that summarizes the number of new registrants and the number of elapsed days per day, the number of new registrants has been declining. As a result, this subscription-based service is definitely dying in business.

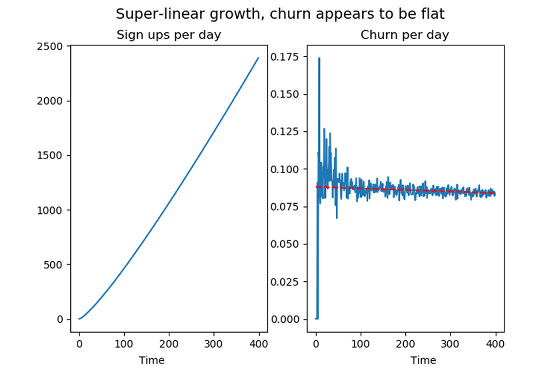
On the other hand, for the following services, the daily churn rate (red dotted line) displayed in the graph on the right is flat, but the graph on the left shows that the number of new registrants per day has exploded. You can see that there is. Investors who only look at the churn rate graph may blame 'no service improvements', but they can see that they are actually growing as a service.
CatchJS argues that the churn rate calculated by 'the number of users who canceled in one month divided by the number of contracted users at the beginning of the month' is by no means a perfect metric for the SaaS business. He said that the health of a SaaS business is determined not by 'how long customers can be retained' but by 'how many customers can be attracted and retained'.
Related Posts:
in Note, Posted by log1i_yk


