``LOOPY'' review that allows you to easily visualize the feedback structure related to multiple elements for free
The final result of the effect of one element on another element or the first action, such as 'rainfalls → crops grow well → yields increase → prices of crops decrease' It is useful to have a diagram that models the structure when explaining the statistical results. ' LOOPY ' is a web service that allows you to easily create diagrams that model the connections of multiple elements on your browser for free.
LOOPY: a tool for thinking in systems
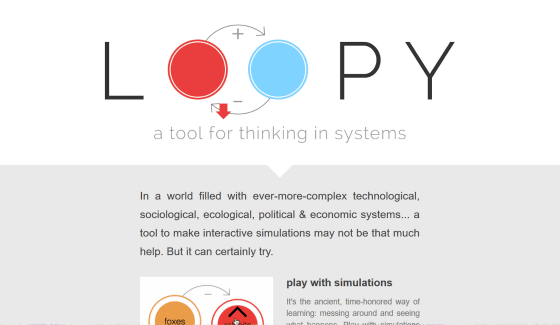
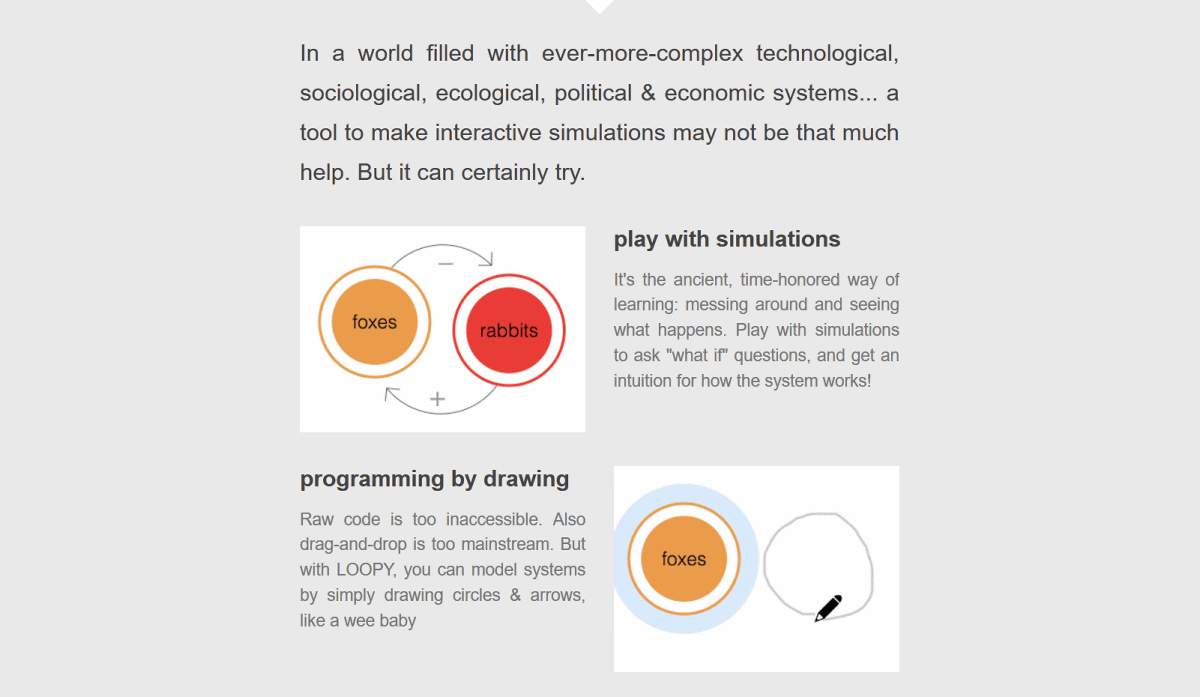
LOOPY is a web service that allows you to easily create diagrams that model related structures and feedback loops by simply drawing circles or arrows on the browser and entering sentences or words.
Clicking 'TRY OUT LOOPY' at the bottom of the top page...
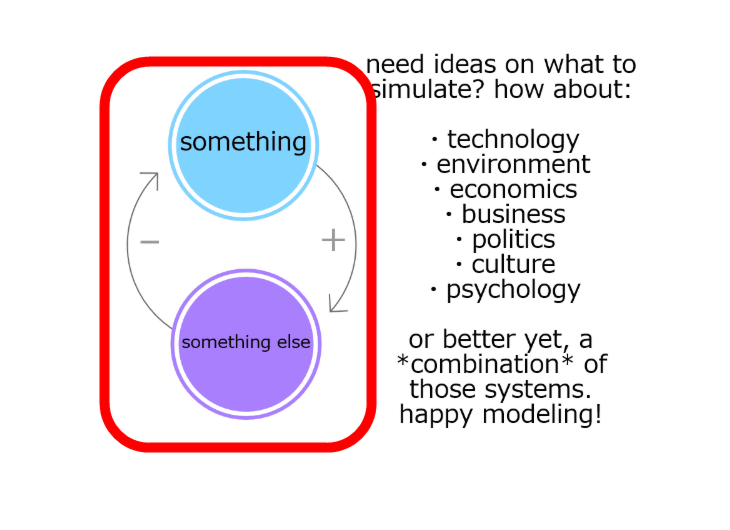
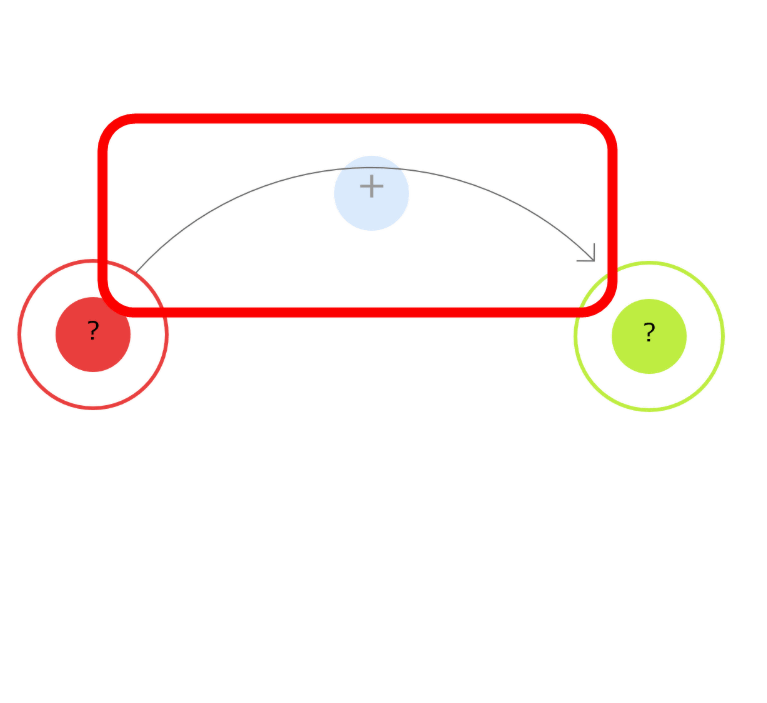
A screen with two circles connected by an arrow is displayed.
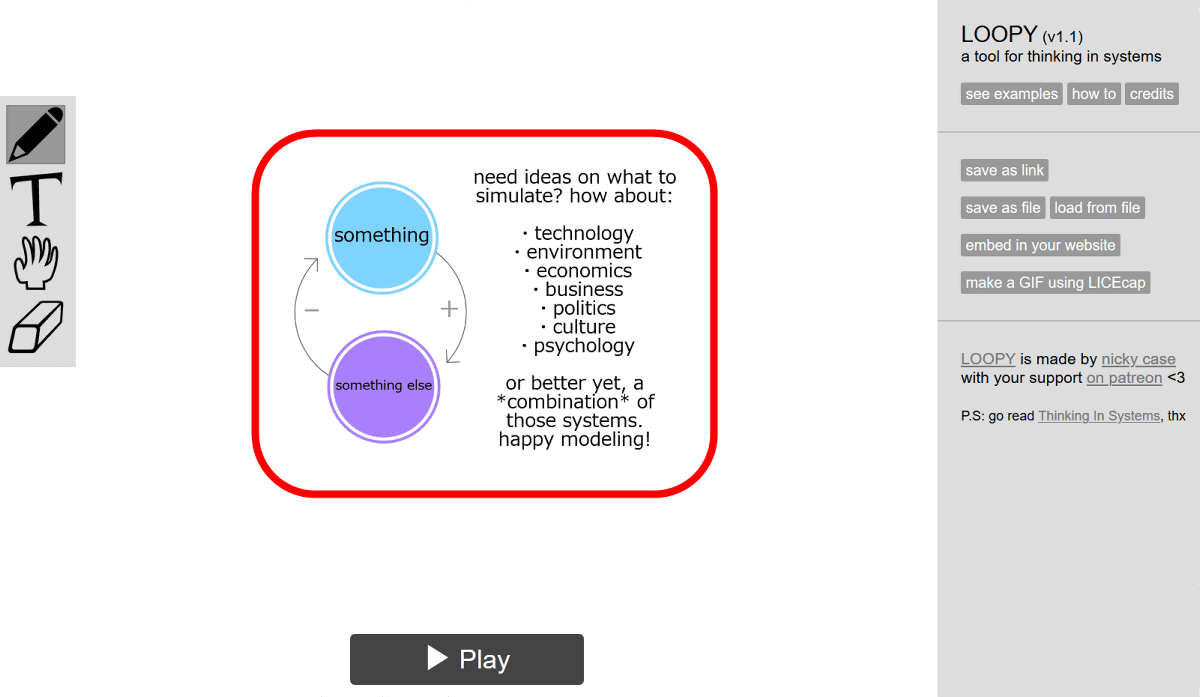
The arrow from the upper circle to the lower circle is '+', and the arrow from the lower circle to the upper circle is '-'. 'When the upper element increases, the lower element also increases. You can see that it represents a feedback loop, 'when the lower element increases, the upper element decreases'.
When you click on the circle, a panel for editing the circle appears on the right side of the screen.
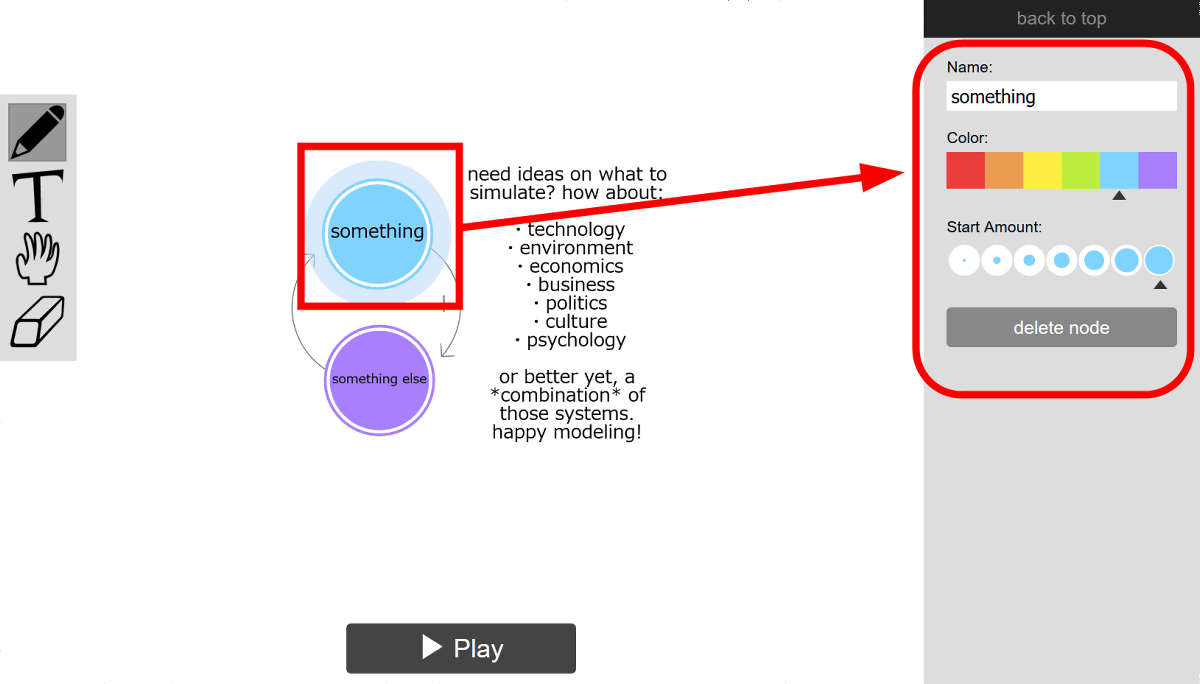
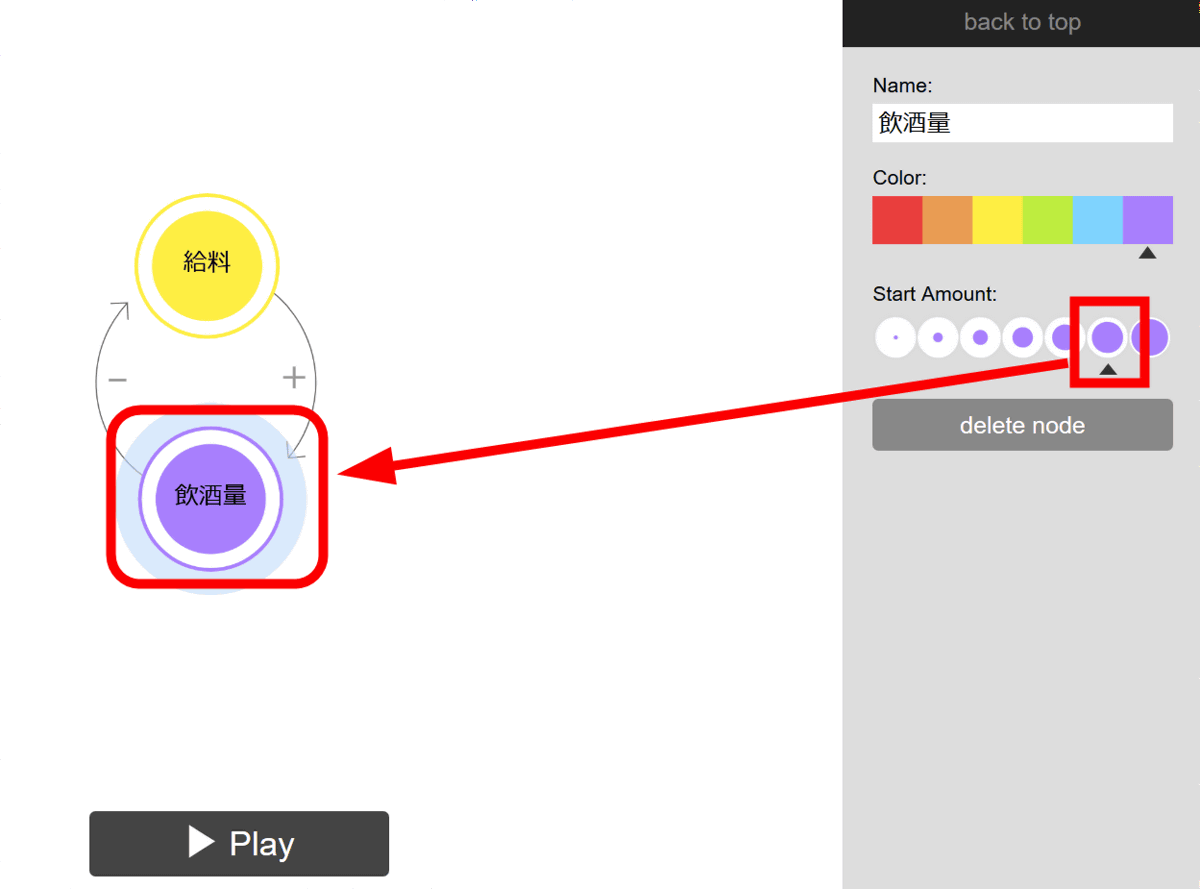
You can edit the name of the element written in the circle in 'Name' and the color of the circle in 'Color'.
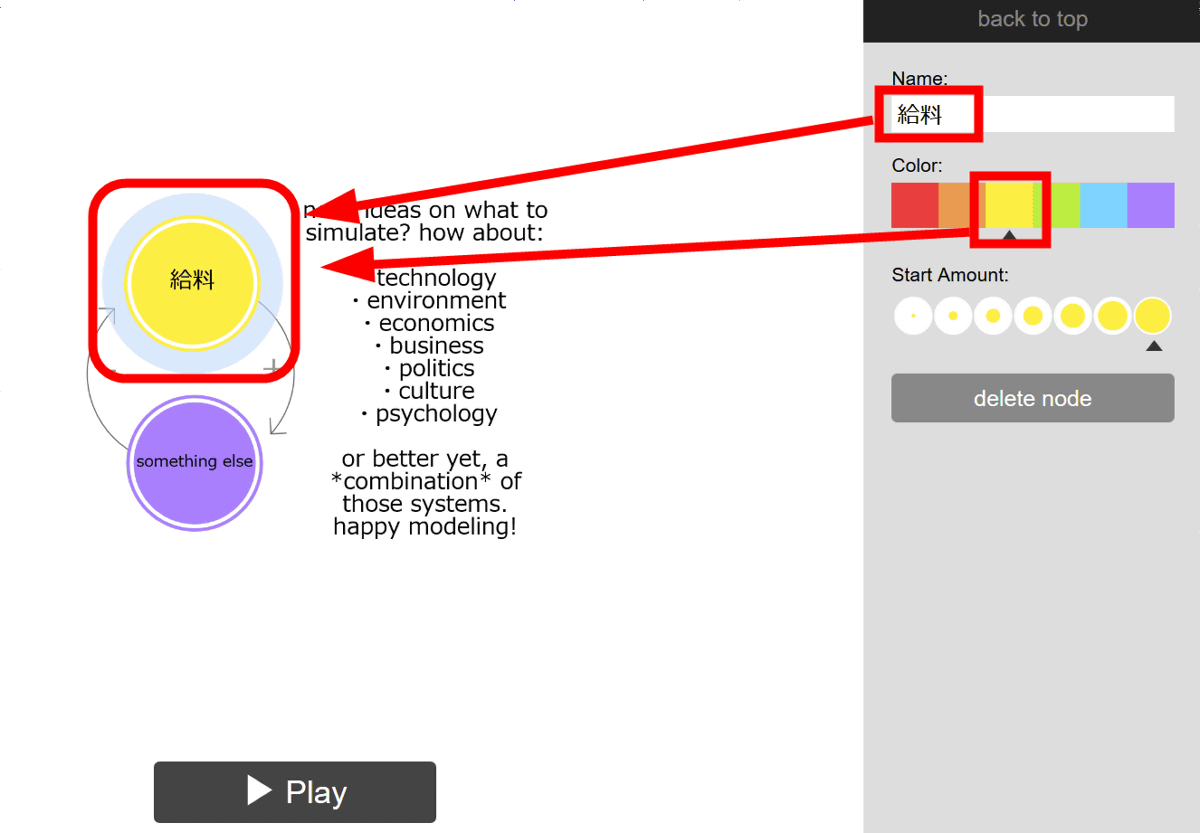
You can also change the size of the circled part.
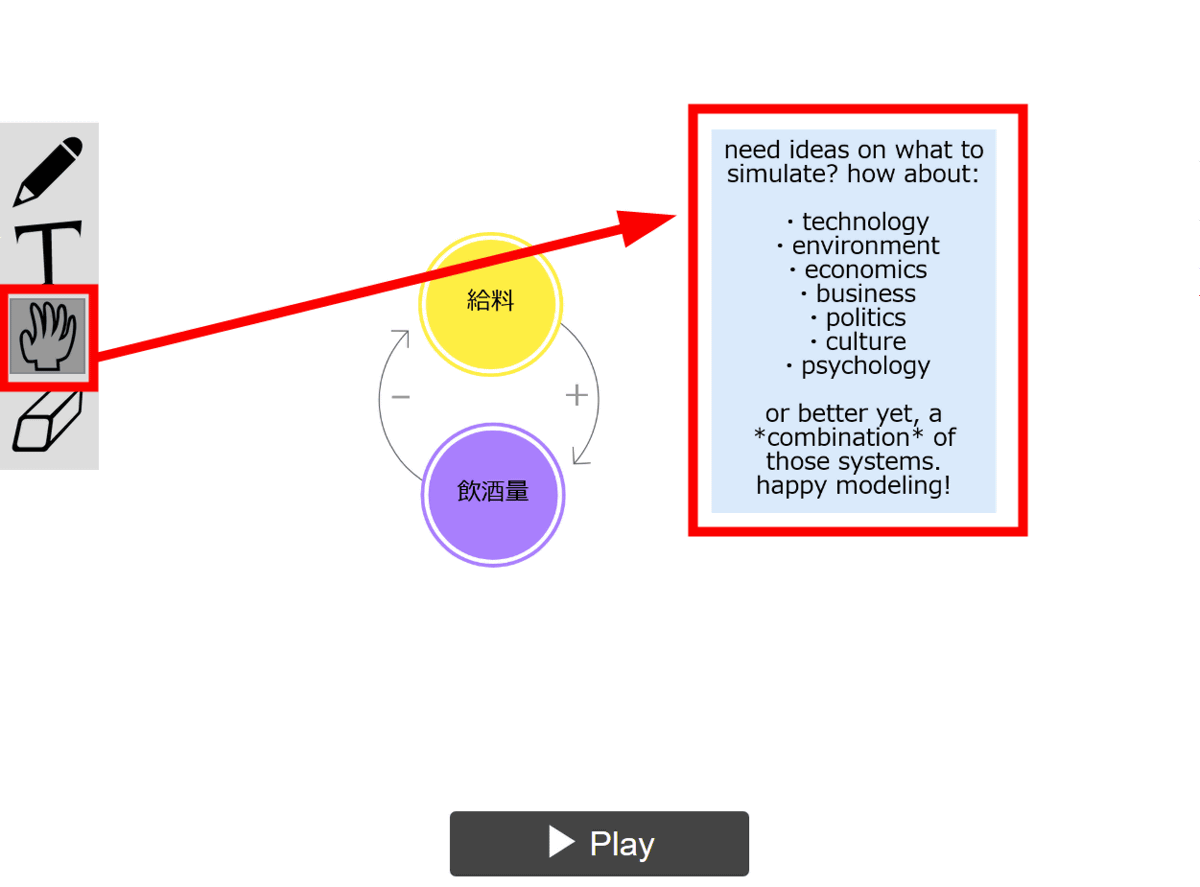
You can move circles and text labels by clicking the hand icon...
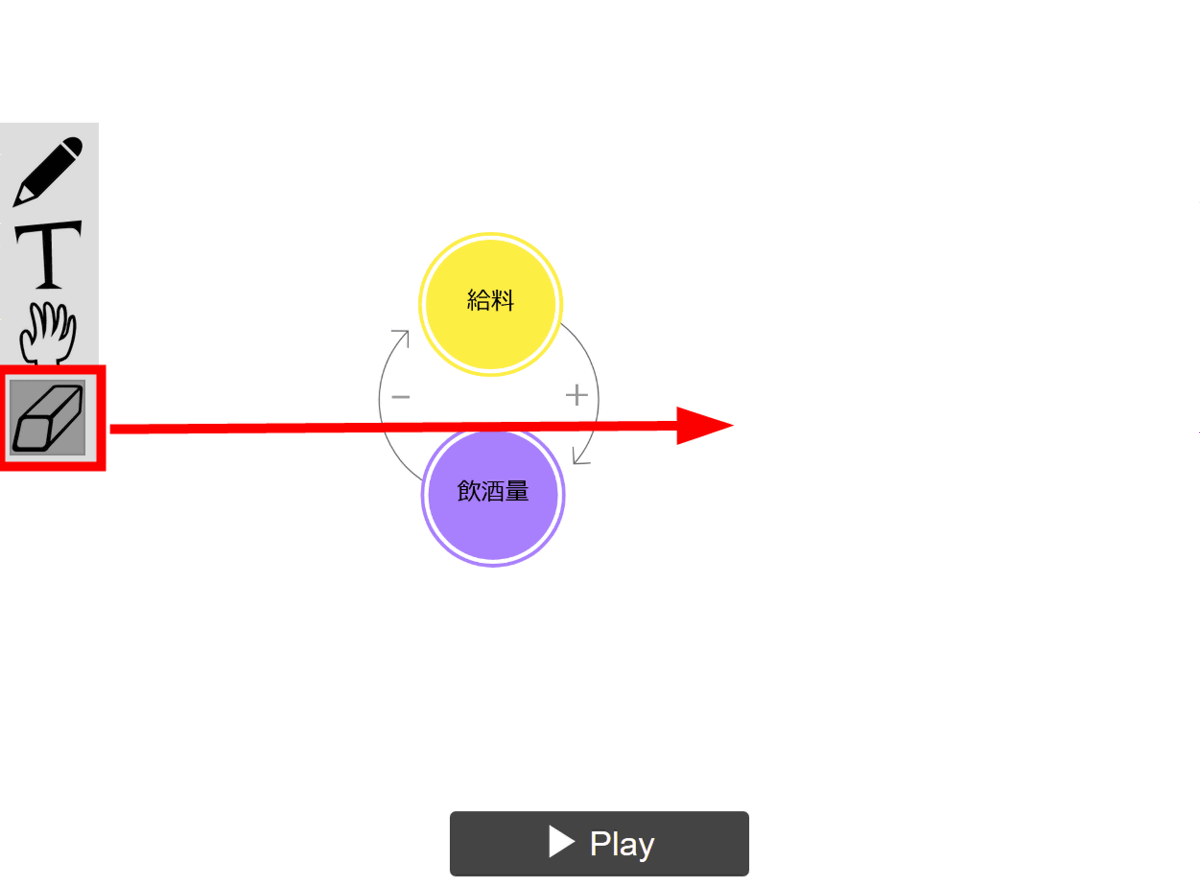
Click the eraser icon and then the circle or label to erase it from the diagram.
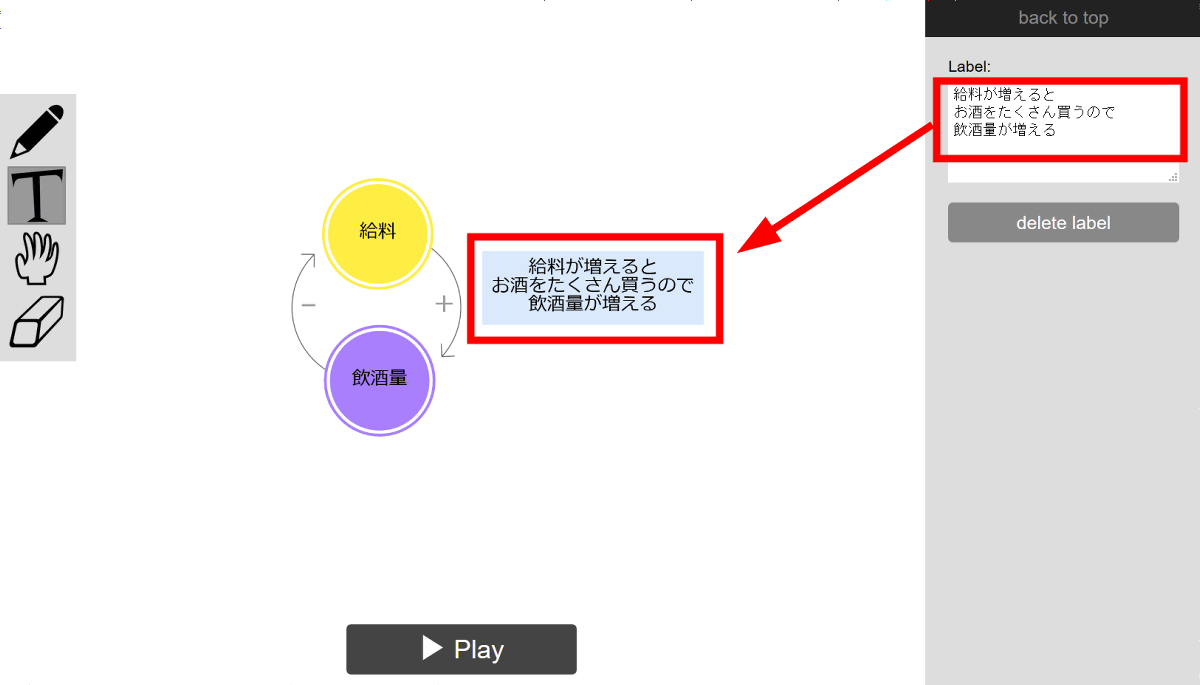
Click the 'T' icon and then double-click anywhere in the diagram to create a label in which you can write your text.
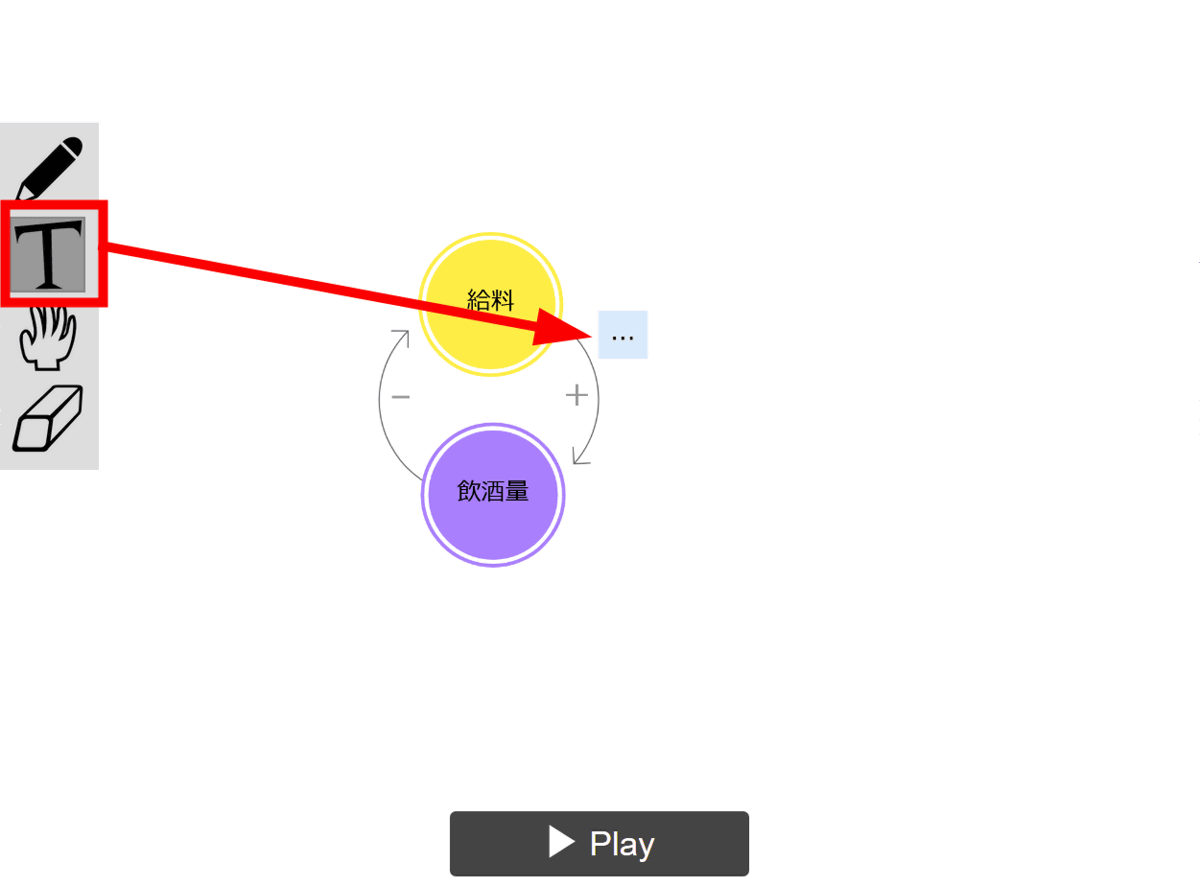
You can freely edit the wording in the label.
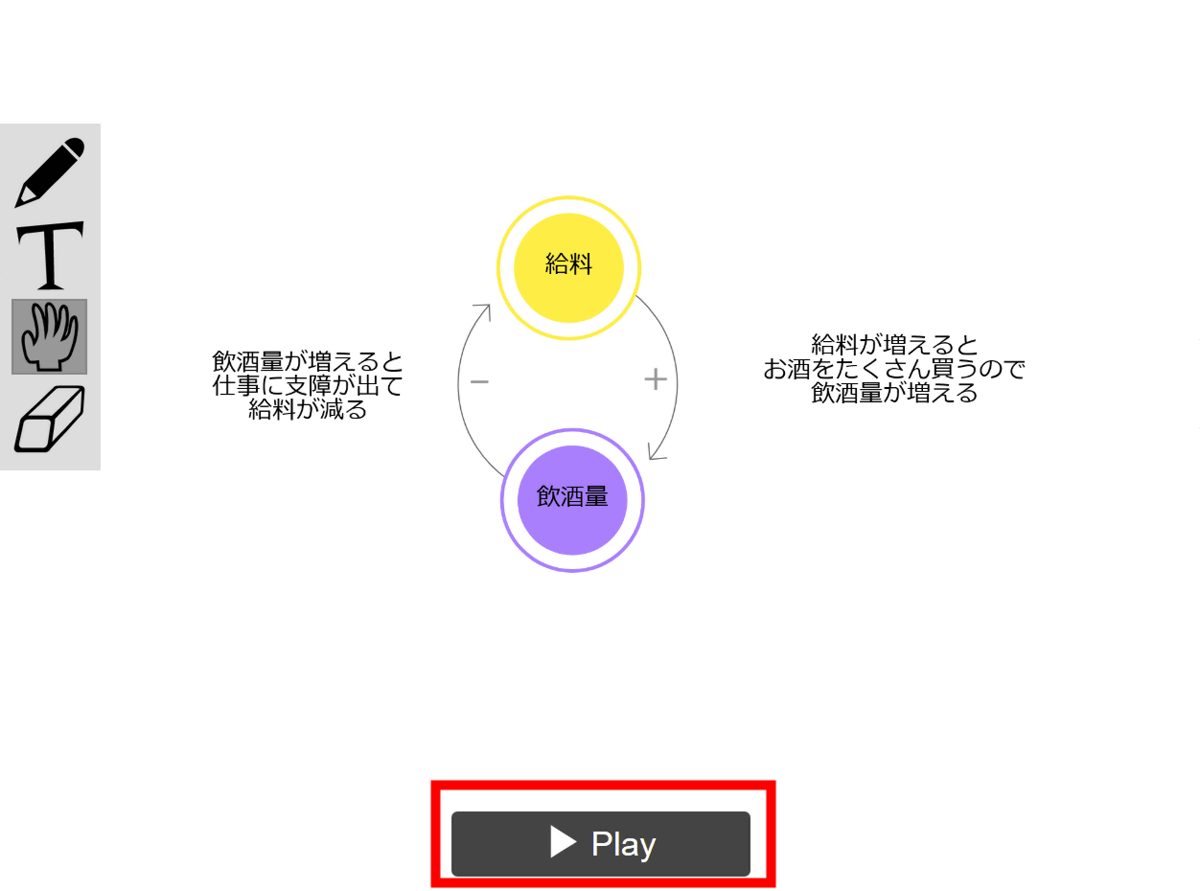
This completes the feedback loop. Click 'Play' at the bottom.
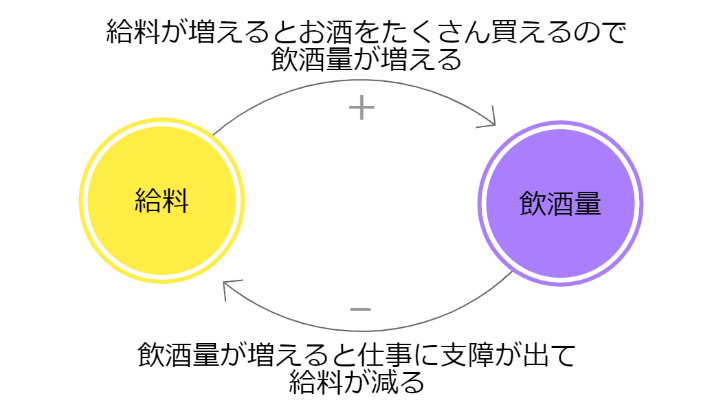
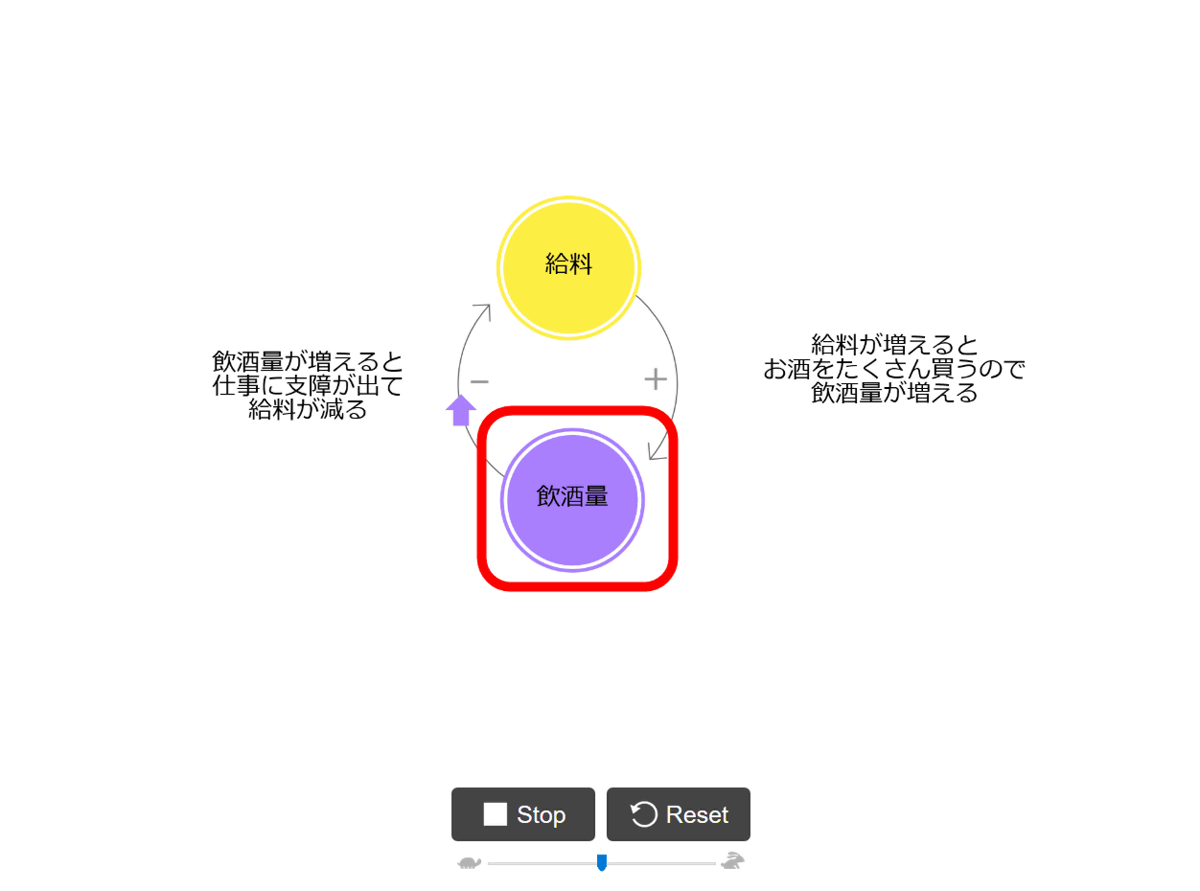
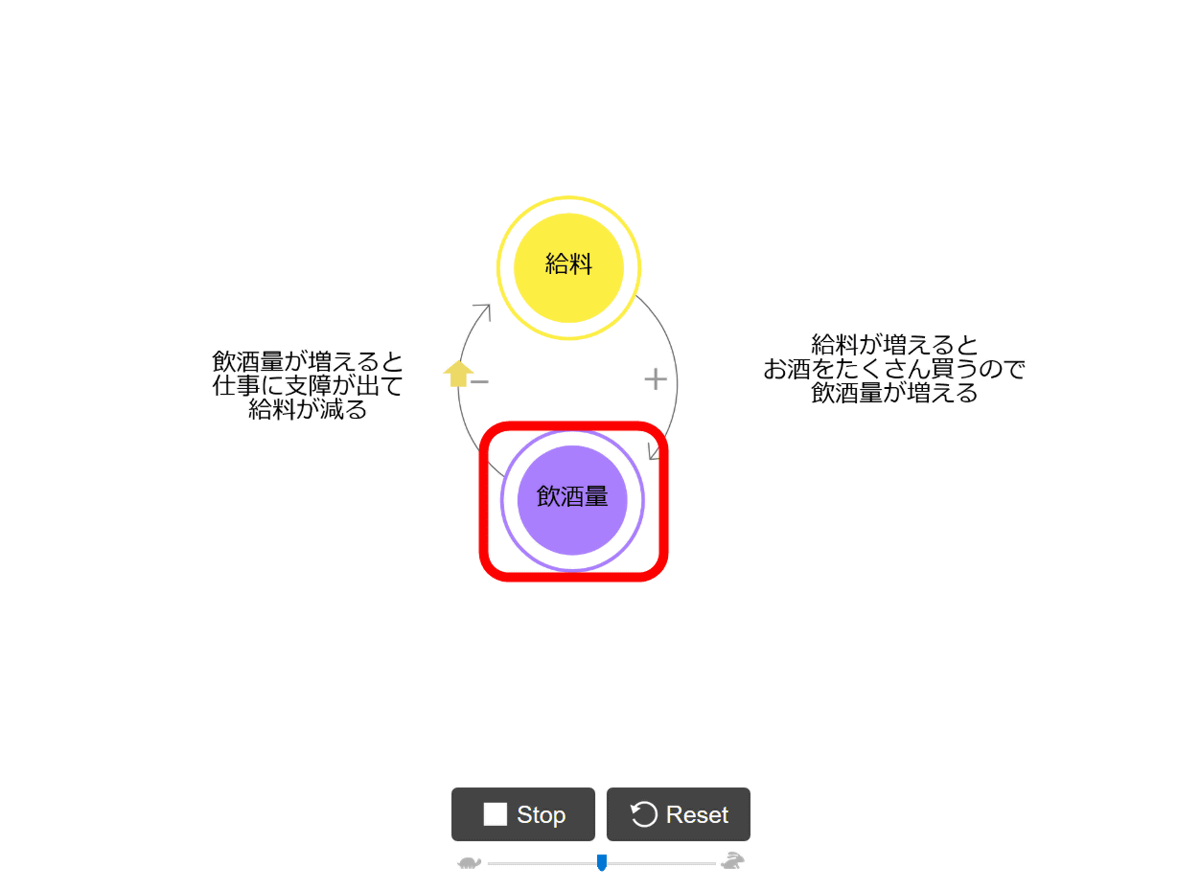
To show what happens when your salary increases, click the top of the circle that says 'salary'...
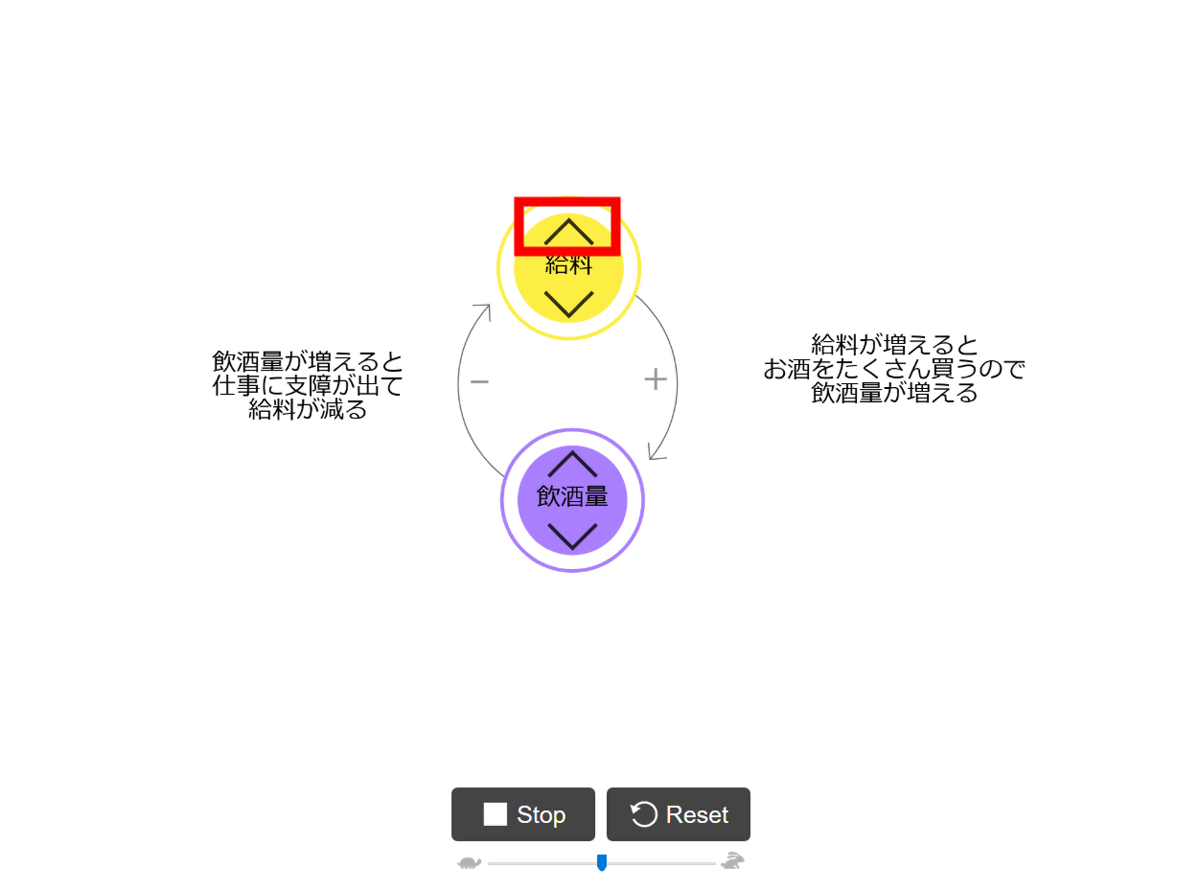
The upward arrow started to move from 'salary' to 'drinking amount'.
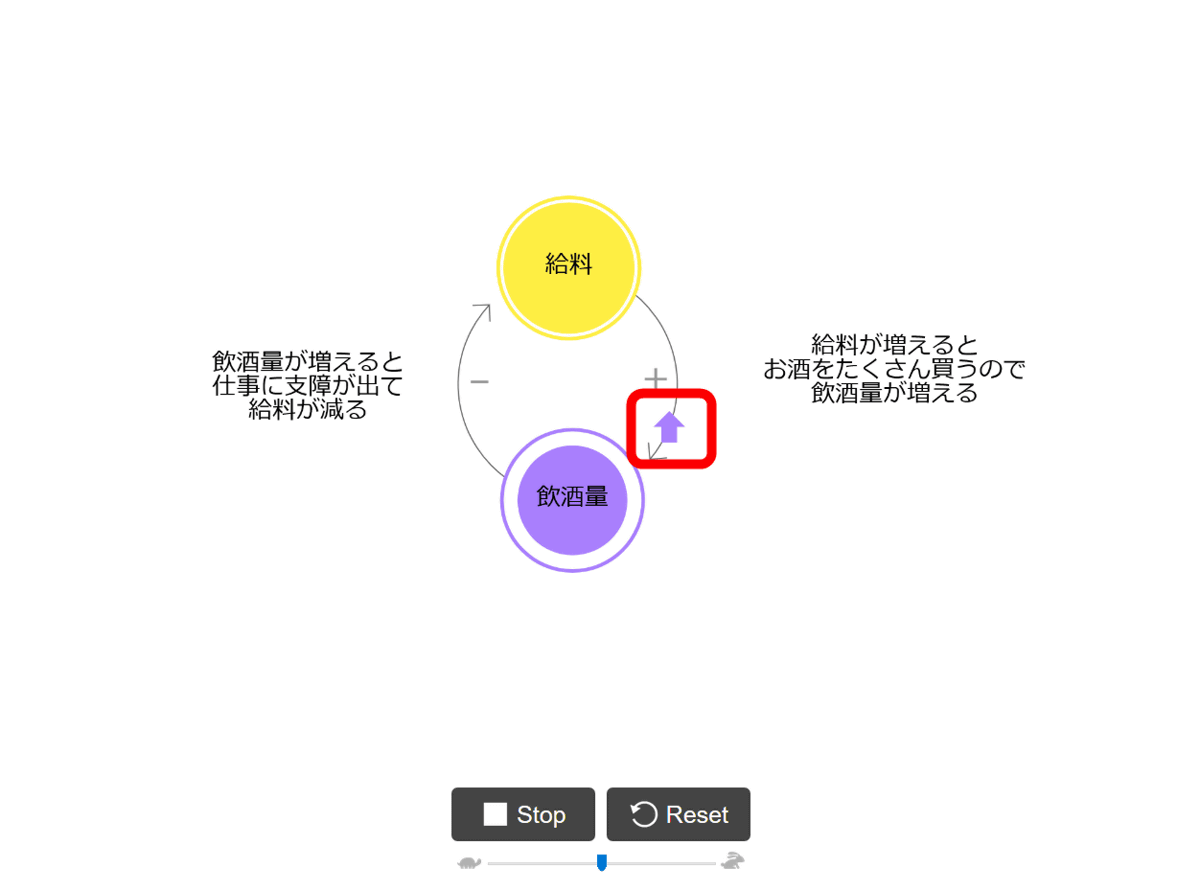
When the arrow reaches the 'drinking amount', the color of the 'drinking amount' circle expands. You can see how the 'drinking amount' increases due to the increase of 'salary'.
This time, the arrow starts moving from 'drinking amount' to 'salary', but the direction of the arrow reverses in the middle. Now it is facing down.
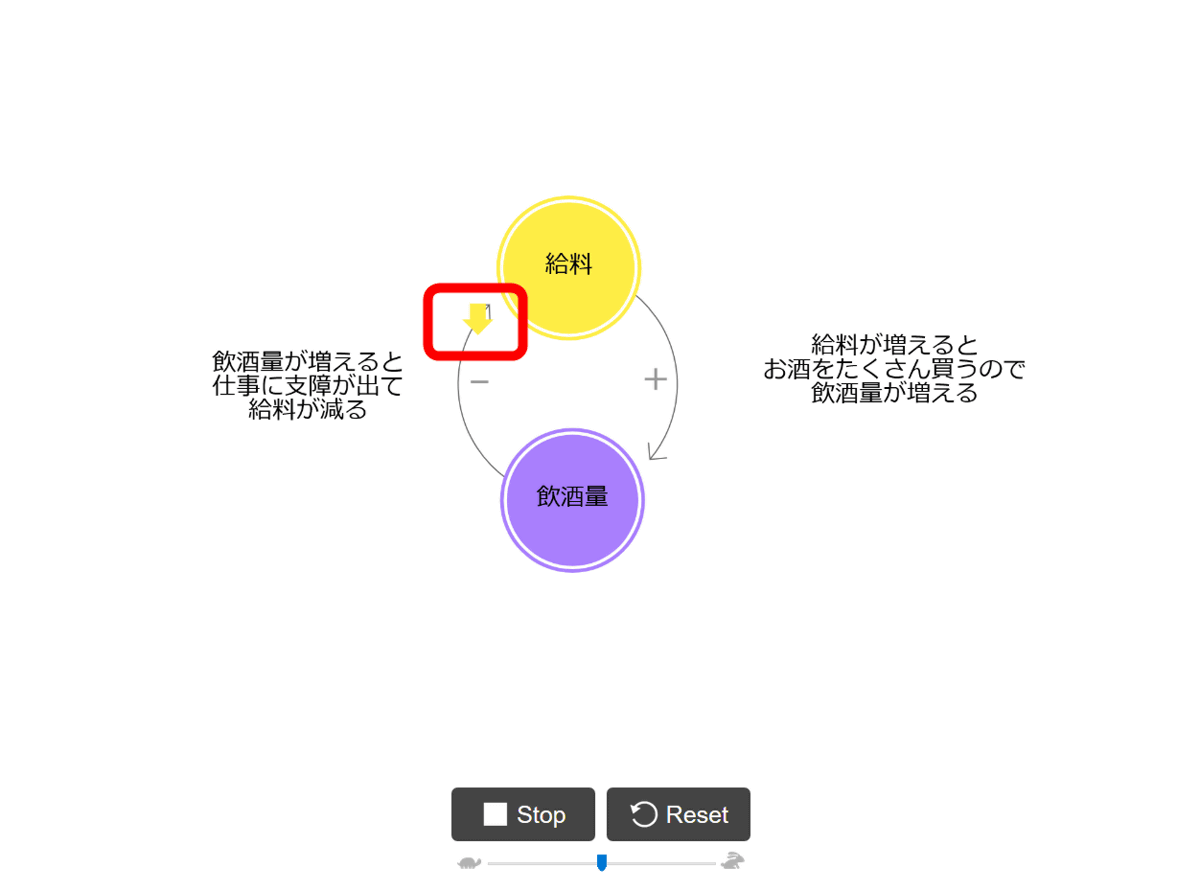
When the downward arrow reaches 'salary', the color part of 'salary' shrinks. By increasing the amount of alcohol consumed, it is now possible to visually understand how the salary decreases.
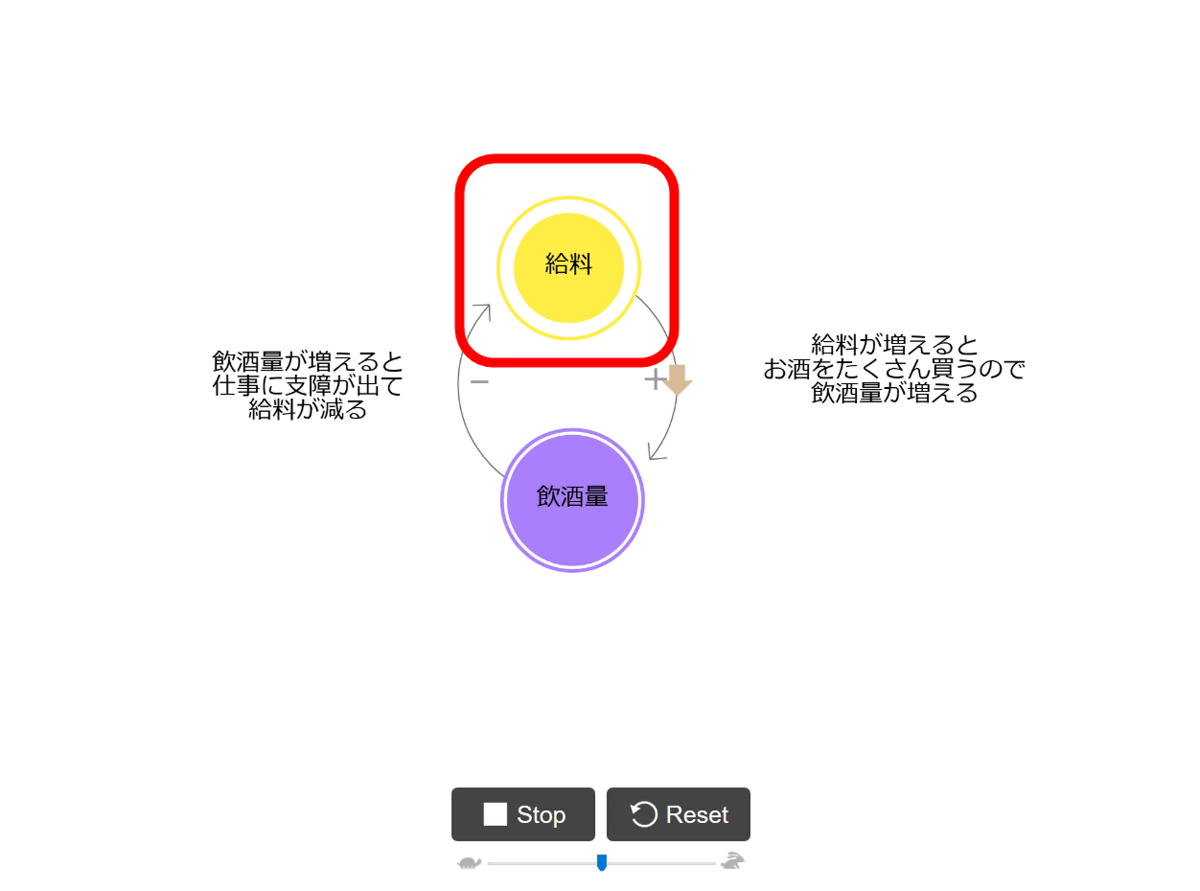
Since the 'salary' has decreased, the arrow towards 'drinking amount' has turned downwards...
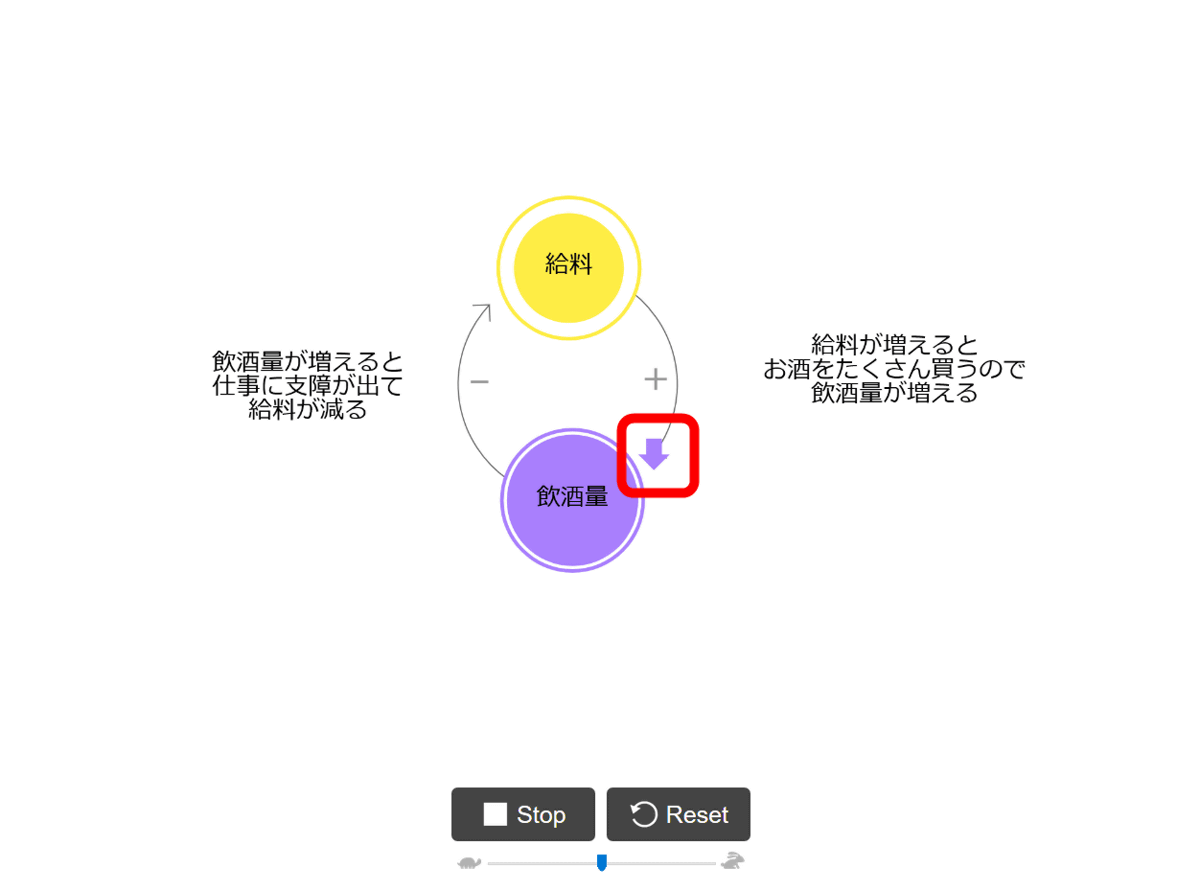
'Drinking amount' also decreased. LOOPY is a web service that allows you to easily create such a loop structure and a model in which multiple elements are connected.
You can also create your own circles and arrows. Click the pencil icon on the right side and draw a circle appropriately freehand……
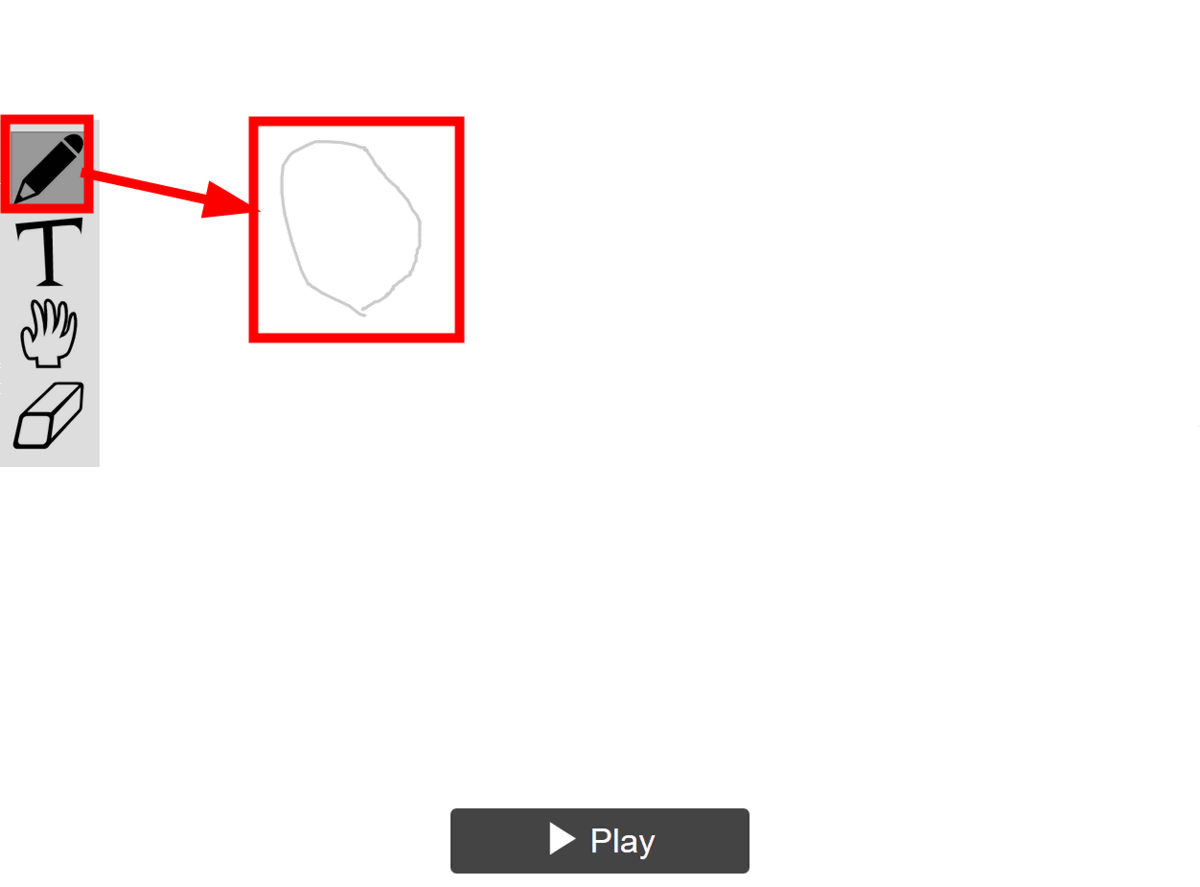
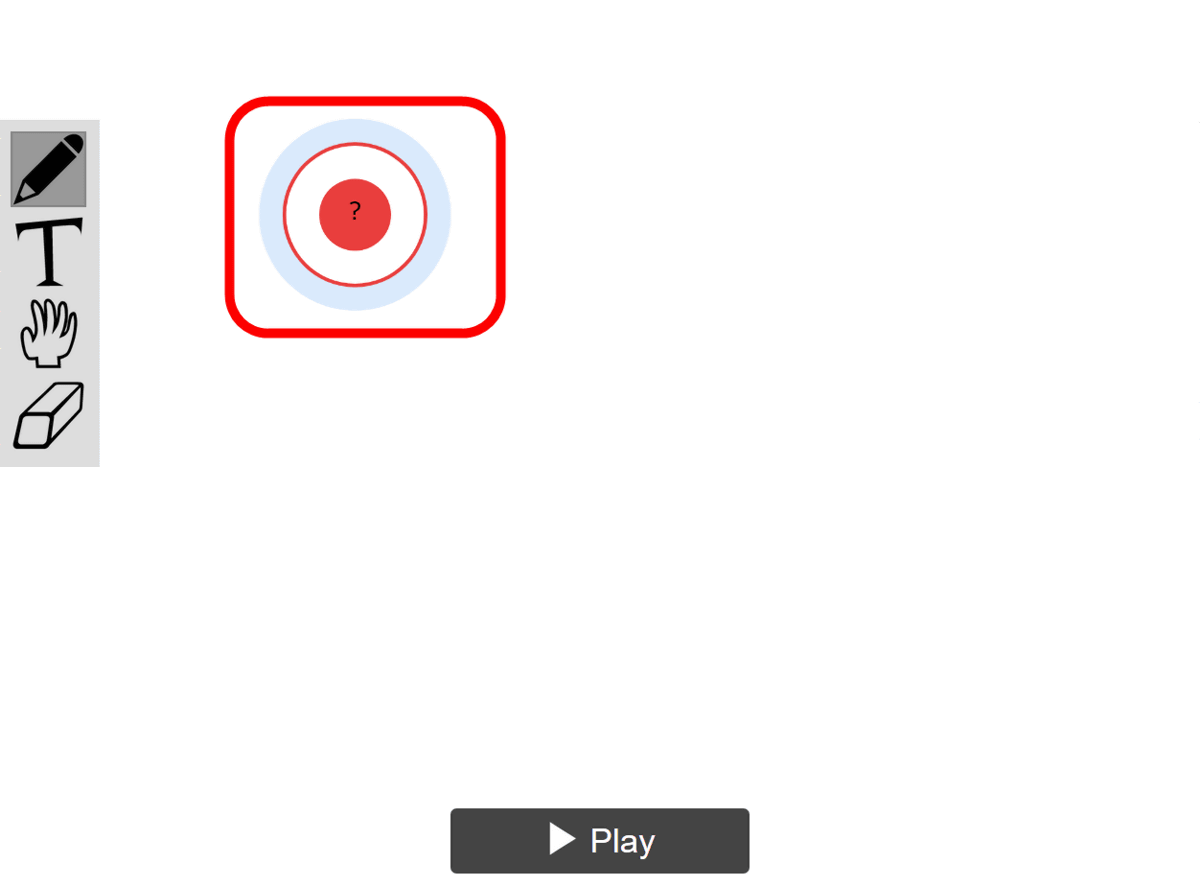
It is automatically converted into a circle that represents the element.
If you click the pencil icon and then draw a line between the circles...
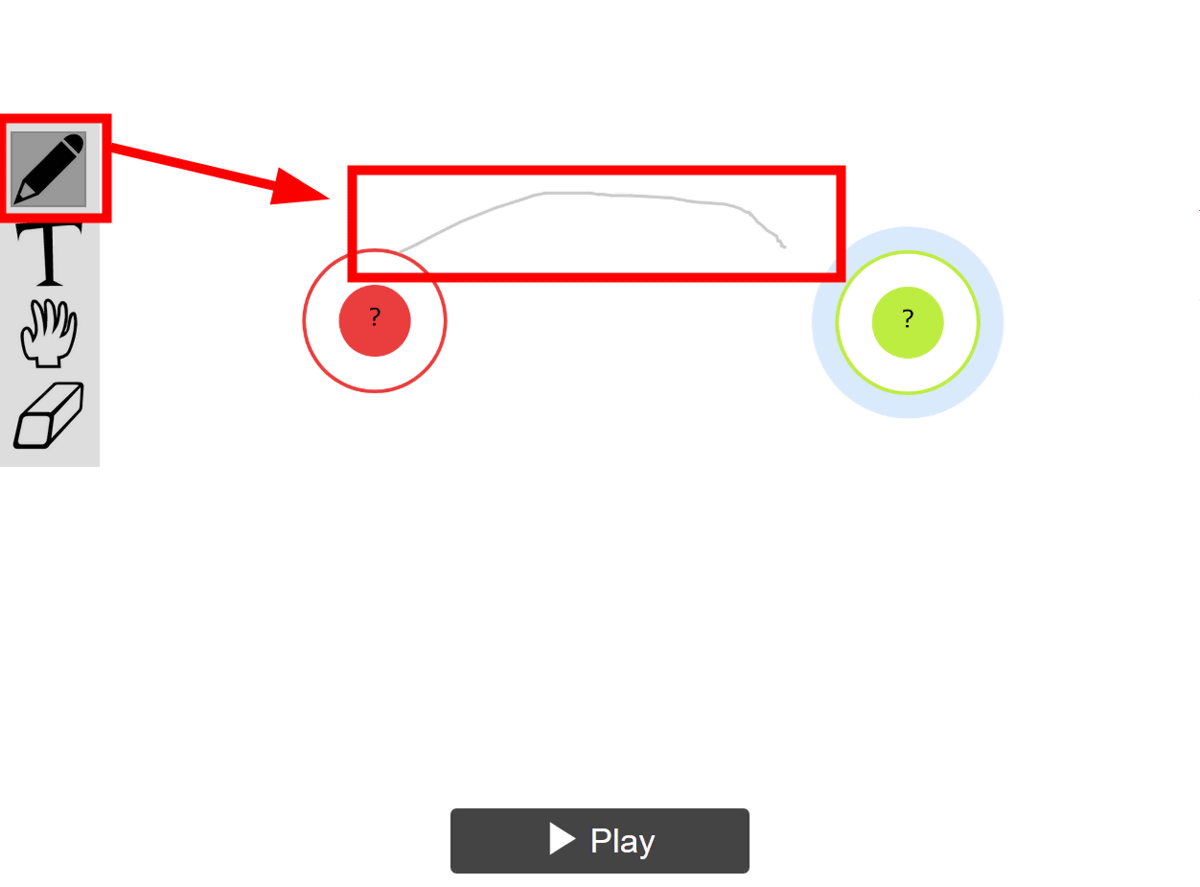
It was automatically converted into an arrow.
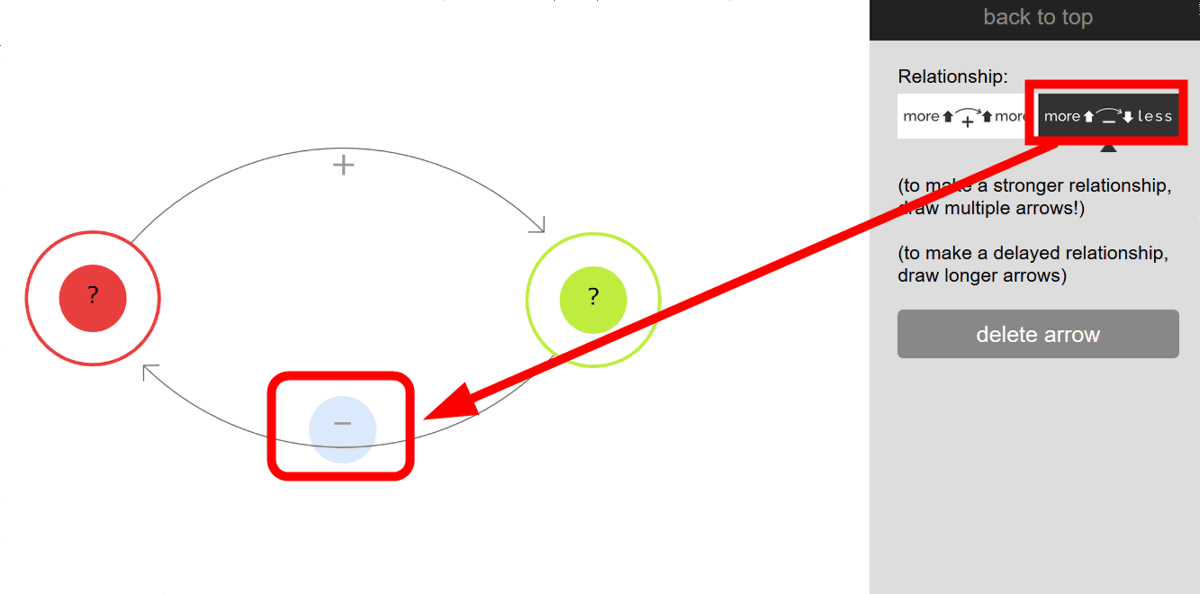
If the start element increases, the next element also increases. You can set it to a '+' arrow, and if the start element increases, the next element decreases to a '-' arrow.
It is also useful for modeling relationships where multiple elements are connected, as they don't necessarily have to be loops.

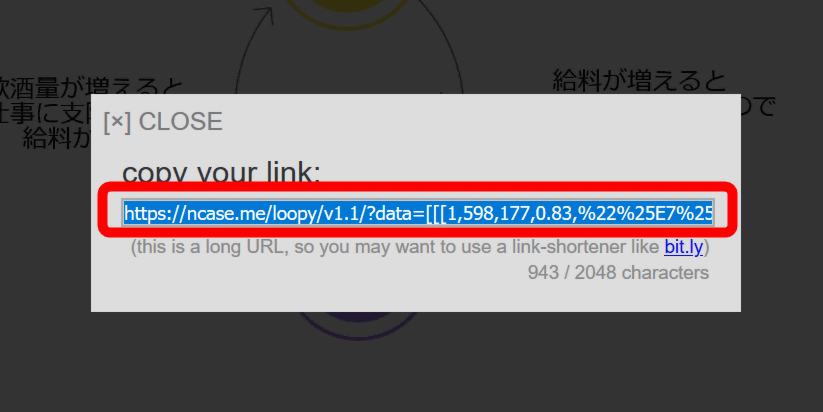
If you click 'save as link' displayed on the right side without selecting an icon...
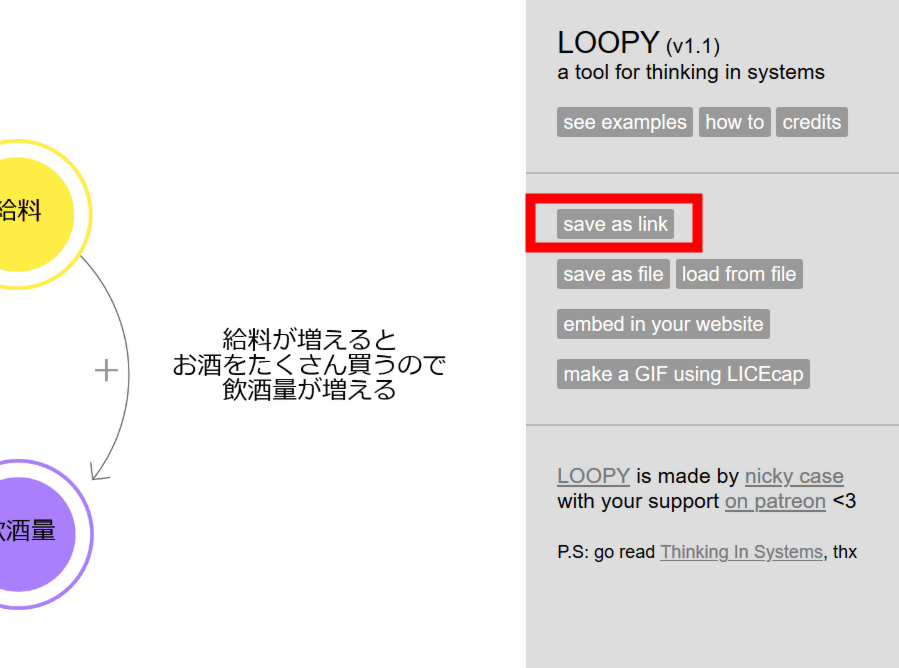
The link of the created model is displayed. If you share this link, you can show the created model to other people, and multiple people can modify and improve the model.
Also, if you click 'save as file', you can save the created model as a file that can be opened on LOOPY.
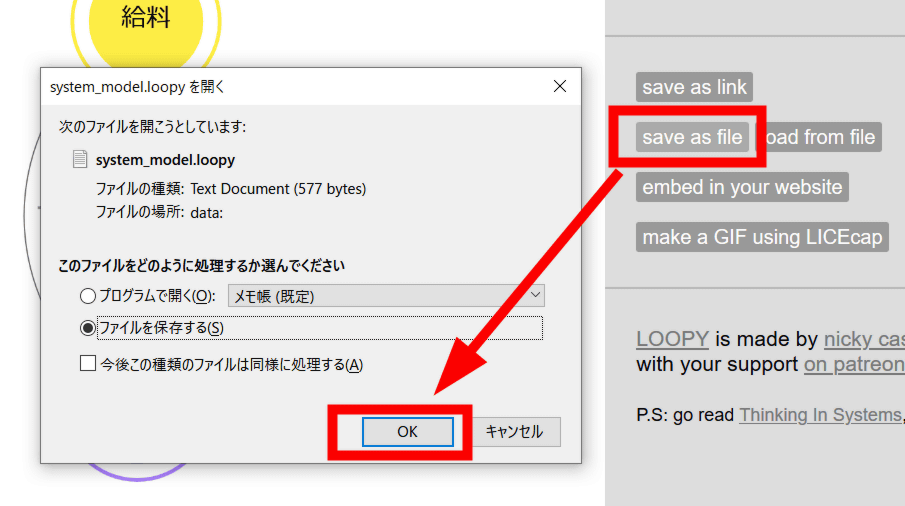
To open the saved file, open the LOOPY model creation screen, click 'load from file', select the file, and click 'Open'...
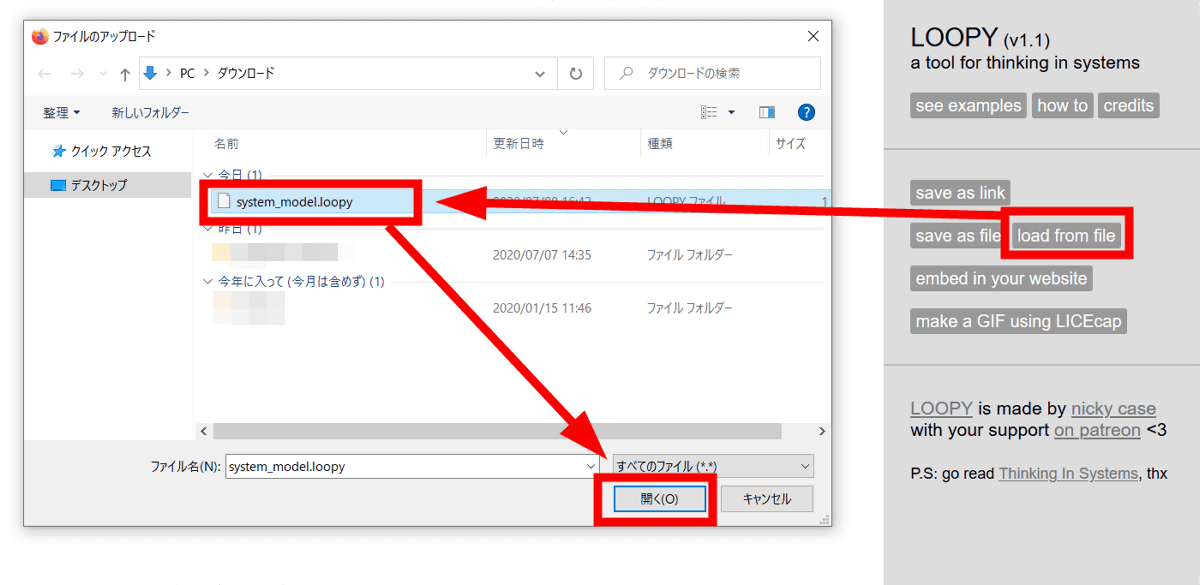
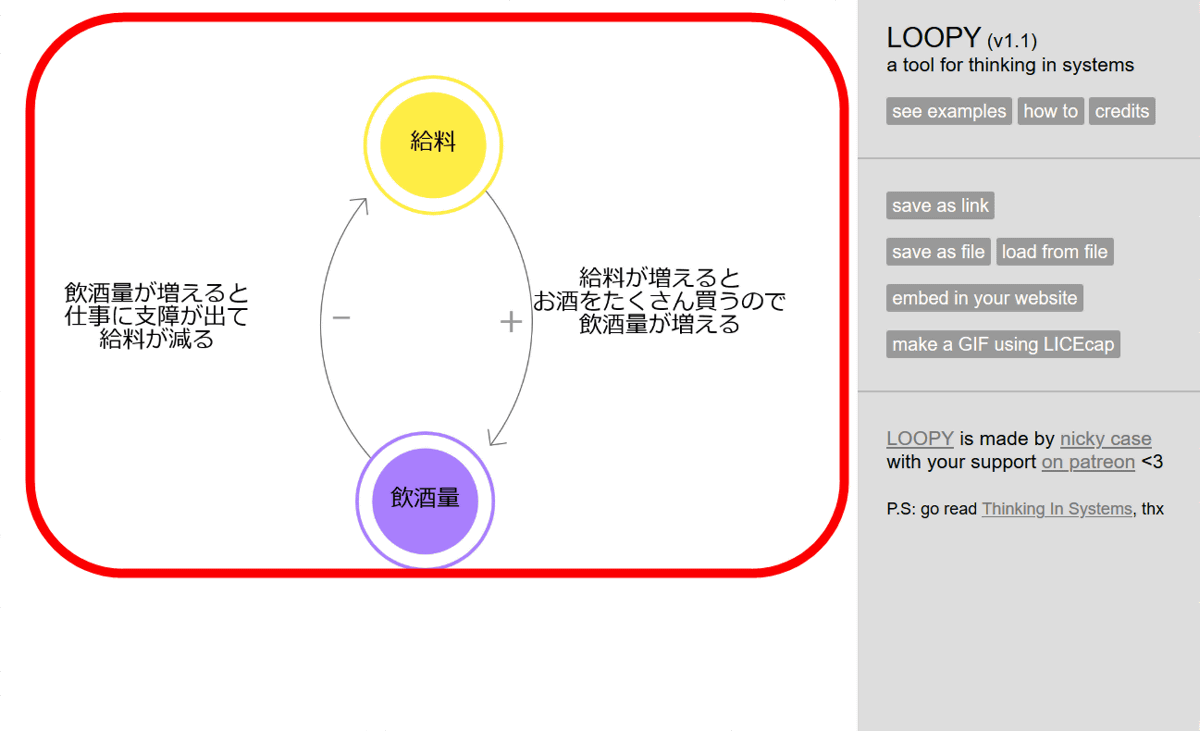
I was able to open the created model.
Click 'embed in your website'...
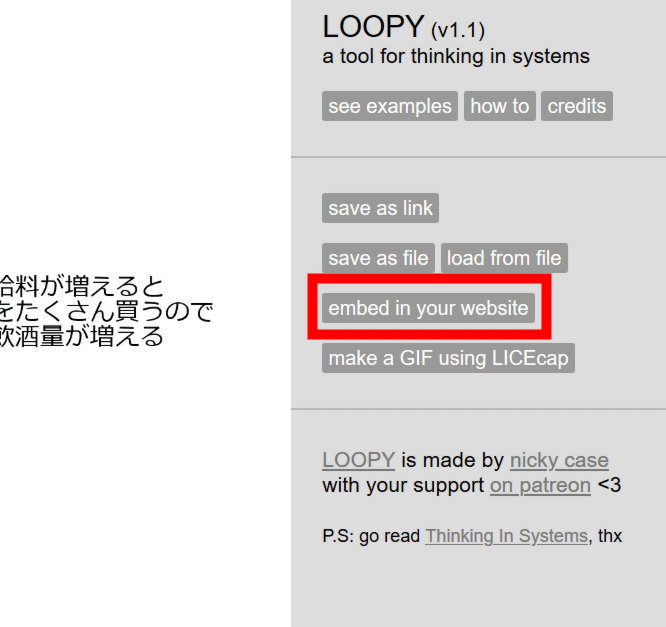
The tag for embedding the created model in the website is displayed.
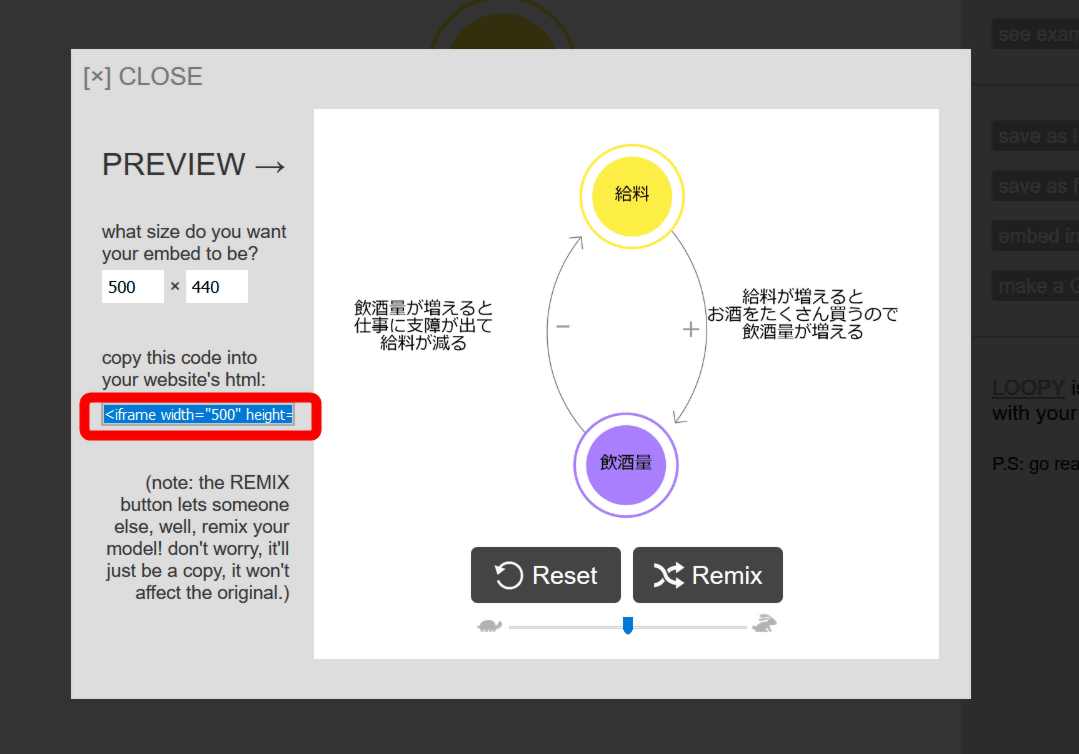
When actually embedded, it looks like this.
Also, it was introduced that it is possible to make a model into GIF animation by using

LOOPY expresses the relationship between elements with arrows, you can easily create a model that shows a feedback loop etc. for free, and you do not need to register an account. It was a convenient service when you wanted to share a little idea or explained something.
Related Posts:


in Web Service, Review, Posted by log1h_ik