Adobe announces report on how'price of goods' changed due to new epidemic of coronavirus
Economic activity has been reported to slow down due to the epidemic of the new coronavirus infectious disease (COVID-19), but on the other hand, online shopping has increased sales and changed product prices. Since 2014, Adobe has been tracking the movement of e-commerce with the
Adobe Digital Economy Index | Adobe Analytics
(PDF file) https://www.adobe.com/content/dam/www/us/en/experience-cloud/digital-insights/pdfs/adobe_analytics-digital-economy-index-2020.pdf
April Digital Economy Index: How COVID-19 Continues to Shift E-Commerce Trends | Adobe Blog
https://theblog.adobe.com/april-digital-economy-index-how-covid-19-continues-to-shift-e-commerce-trends/
DEI analyzes based on anonymized data of 1 trillion website visitor information and 10 trillion product minimum management unit information collected from 80 of the top 100 US retailers .. As a result of a DEI analysis, the use of e-commerce has increased sharply due to the COVID-19 epidemic, and it has been affected by various online shops such as apparel, electronic products, and groceries. In addition, in April 2020, the number of orders for ' BOPIS ', which received items purchased at online shops or EC sites at real stores, increased by 208% from the previous year.
DEI also tracks the 'digital purchasing power' of American users, which also increased 4.1% year-on-year. This indicator means that consumers can now buy for $ 104 (about 11,150 yen) at the same time in 2019, for $ 100 (about 11,720 yen). Digital purchasing power has continued to increase for many years, and is believed to be affected by deflation in the apparel market. 'The longstanding online deflation has alleviated the impact of price increases at COVID-19,' said John Copeland, vice president of marketing and customer insights at Adobe.
The changes in product prices in the three categories of “apparel,” “electrical appliances,” and “food” that showed particularly remarkable changes are as follows.
◆ Apparel
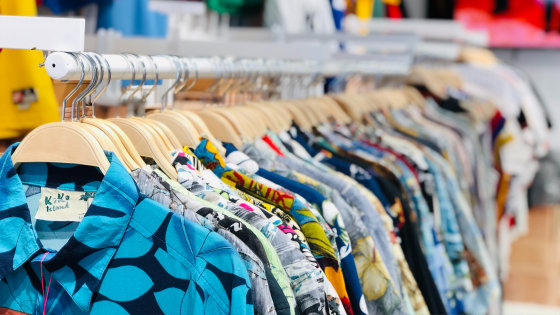
The graph below shows the price of the apparel online market. The horizontal axis shows the time axis from January 2014 to 2020, and the vertical axis shows the percentage change in price from the baseline.

In the apparel market, lockdown of each city forced the closure of real stores, and a big price drop was seen to win online competition. In the apparel industry, the average yearly price decline was 2.9% from March to April, but in 2020 it was four times that of 11.9%. This is the highest number in April over the last five years. However, despite falling prices, the apparel market as a whole increased online sales by 34%.
Also, it can be said that this is within the range of expectations, but the clothes purchased by consumers in April were often 'comfortable home clothes'. Sales of pajamas in e-commerce were 143%, while sales of jackets were down 33%.
◆ Electronics
Since 2014, when Adobe started tracking in DEI, electronics prices have experienced deflation at a steady rate, but COVID-19 impacted online sales by 58%, the first time in years. The price increase happened.
In the graph below, the horizontal axis shows the time axis from January 2014 to 2020, and the vertical axis shows the percentage change in price from the baseline. Purple is the total price of electric appliances, and light blue is the price of the computer.
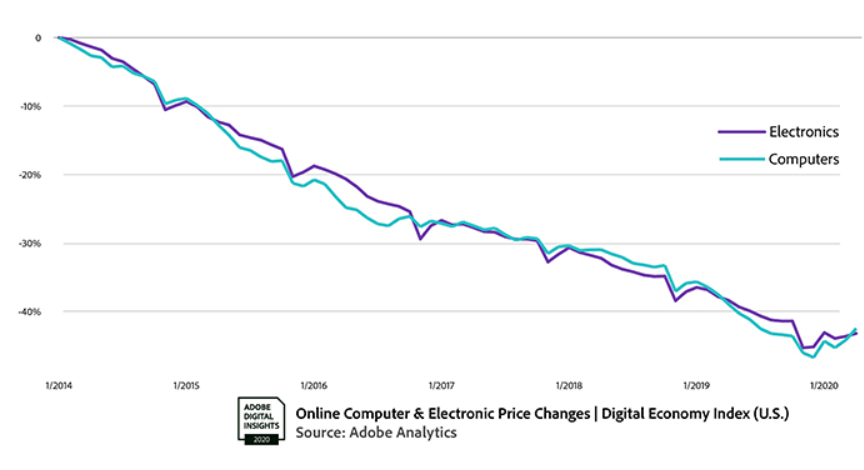
Among electric appliances, the price of the computer, which has especially increased demand, has risen. 'For consumers, online shopping for appliances is unlikely to continue to experience price declines.' 'Supply chain impacts could make prices even worse in the coming months,' he said. I am talking.
◆ Groceries
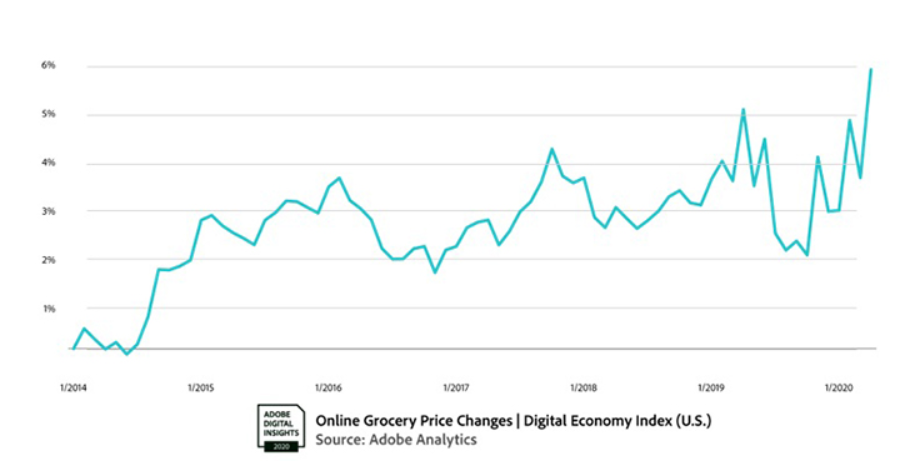
Sales of grocery online shopping in the US reached 110% in April and prices have increased slightly, but they are still about the same level of increase from January to March 2019.
Over the past five years, online shopping grocery prices have tended to fall between March and August and rise between September and December. It is unknown at the time of writing the article how this pattern will change under the influence of COVID-19. “For certain food products, suppliers are increasing costs and we need to keep track of how this translates into e-commerce distribution channels,” says Copeland.
Online sales of alcohol such as wine, beer, spirits, and accessories such as corkscrew accompanying it increased by 74% in April.
Related Posts:


in Web Service, Posted by darkhorse_log