The extent to which plastic pollution by plastics has risen sharply from 60 years of ocean survey data

by
Scientists from around the world have raised the issue of marine pollution from plastic waste and microplastics , but have not been backed up by long-term, ongoing surveys. A paper published in the science journal Nature on April 16, 2019 published the results of a 60-year ocean survey, revealing the increase and trend of marine pollution by plastics.
The rise in ocean plastics evidenced from a 60-year time series | Nature Communications
https://www.nature.com/articles/s41467-019-09506-1
Planet's ocean-plastics problem detailed in 60-year data set
https://www.nature.com/articles/d41586-019-01252-0
It is the research group of Dr. Claire Ostle and others of the Marine Biology Association of the United Kingdom that revealed that plastic waste in the sea has increased rapidly from observation data for 60 years. Dr. Ostor focused on waste data captured by the Continuous Plankton Collector (CPR), which has been implemented continuously since 1931 in the Atlantic Ocean and its vicinity.

by
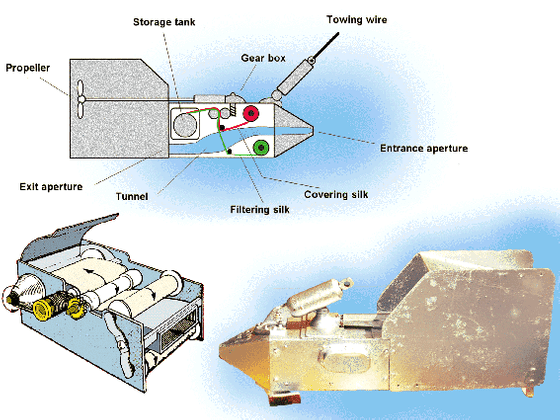
CPR is a device created by the British Association of Marine Biology for the purpose of studying microorganisms in the sea, and has a torpedo-like shape with a total length of about 1 m. After being dropped from the ship into the sea, while moving through the sea while being pulled by a rope about 10 m deep, the floating filter of the inside is used to collect floats with a diameter of 5 mm or more while passing through the sea. Since its operation in 1931, CPR has contributed more than 5.4 million nautical miles (about 10 million km) of distance to the ecology survey of plankton under the sea.

by
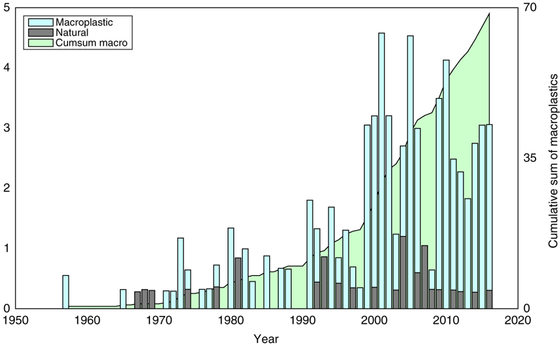
CPR collects not only plankton, but also various floats such as gravel and plant fragments in the sea. The image below shows the amount and breakdown of the floats as a graph. The horizontal axis shows the year of collection, and the vertical axis shows the ratio of waste to the whole. Also, the black part of the bar graph shows the natural product, the light blue part shows the proportion of plastic pieces, and the line graph of the bar graph background shows the total amount of suspended matter.

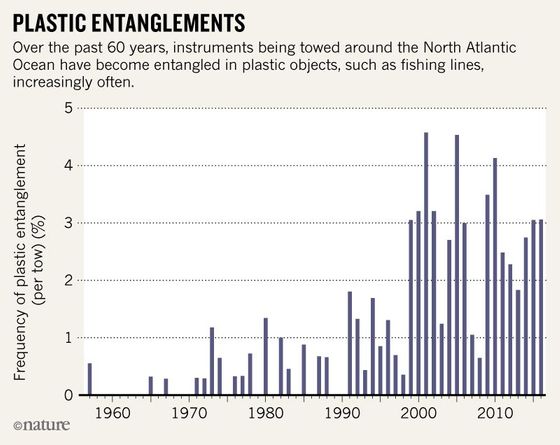
The following graph is the extraction of only plastic pieces from the data in the above graph. Plastic pieces have been found since 1957, but you can see at a glance that they have increased dramatically since the beginning of the 2000s.

Dr. Ostor analyzes that these pieces of plastic are mainly derived from the nets used in the fishery, from the condition of the waste found and the catch of ocean trawlers operating in the northern Atlantic since the 1970s. Did. In addition, Dr. Ostor has also noted that the proportion of plastic pieces to the waste collected in CPR has been decreasing in recent years, and the impact of the fishery on the sea And the progress of fishery technology may reduce plastic fiber waste. ”
Dr. Ostorl, on the other hand, points out that plastic waste is likely to be broken down by UV rays into fine microplastics because CPR can not catch floats smaller than 5 mm in diameter. It was pointed out that just because the number of pieces of plastic collected decreased, the threat of plastic contamination from the sea did not necessarily decrease.
Related Posts:
in Science, Posted by log1l_ks


