Results of thorough analysis from an investor's point of view: 'Which is Uber or Lyft better?'
by
Remarkable progress has been made worldwide in matching the common driver who uses a private car with the passenger and passenger who share it with each other, and the ride sharing service has achieved remarkable progress, and it is widely used as an inexpensive transportation mainly in the West. Above all, Uber and Lyft are the most popular rideshare services in the United States, which is a country where rideshare is spreading. Blogger Benjamin Tzen, who claims to be a high-tech investment geek, analyzes the IPO applications of the two companies that have applied for an IPO one after another in March and April 2019 and thoroughly compares the two companies under the title 'Lyft vs Uber' You are
Lyft vs Uber: A Tale of Two S-1's-Benjamin Tseng
https://benjamintseng.com/2019/04/lyft-vs-uber-a-tale-of-two-s-1s/
S-1 Lyft, Inc.
https://www.sec.gov/Archives/edgar/data/1759509/000119312519059849/d633517ds1.htm
S-1 UBER TECHNOLOGIES, INC.
https://www.sec.gov/Archives/edgar/data/1543151/000119312519103850/d647752ds1.htm
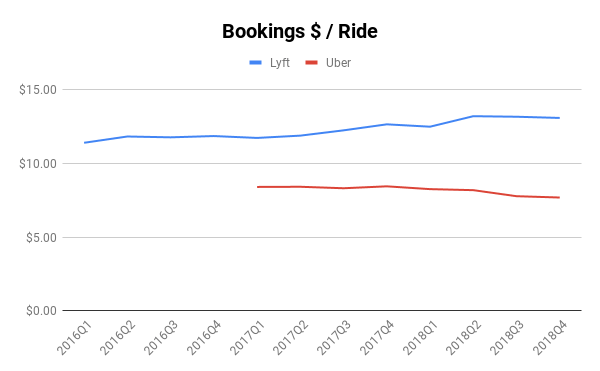
◆ Lyft is more expensive, but passengers pay more to Uber
The line graph below is a graph of the charge per ride reservation, where the blue line is Lyft and the red line is Uber. In the first quarter of 2017, when Uber's data has been collected, the average fare paid by passengers for each reservation was $ 8.41 (approximately 942 yen) for Uber, while Lyft was $ 11.74 (approximately 1315 yen). And $ 3.33 (about 373 yen) is also high. While Uber fell to $ 7.69 (about 861 yen) in the fourth quarter of 2018, Lyft rose to $ 13.09 (about 1466 yen), and the difference has expanded to $ 5.4 (about 605 yen) . 'This is surprising considering that Lyft is separate, while Uber is tax and toll fees, etc.,' he said.
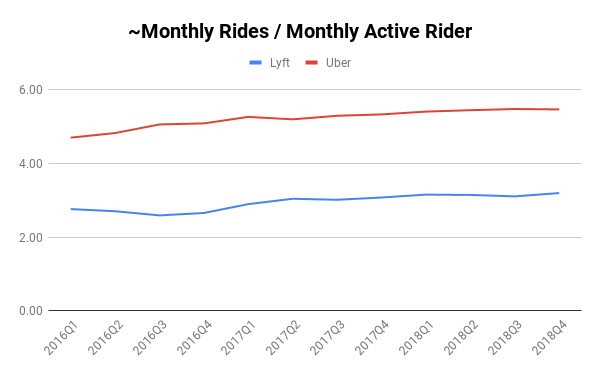
The graph below shows the number of monthly rides per active user and how many times a passenger is using the service each month. Uber is used nearly twice as high as Lyft, so despite Uber's lower fare per ride, the total monthly fee paid by the user is more for Uber.
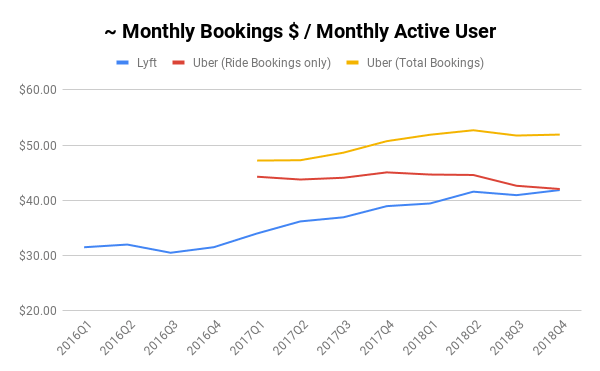
However, this difference is shrinking rapidly. The graph below shows the monthly fee for each passenger, showing that Lyft's blue line is catching up with Uber's red line. The Uber line is divided into two parts, the shipping fee shown in red and the total usage fee shown in yellow, because there are food and drink delivery services such as
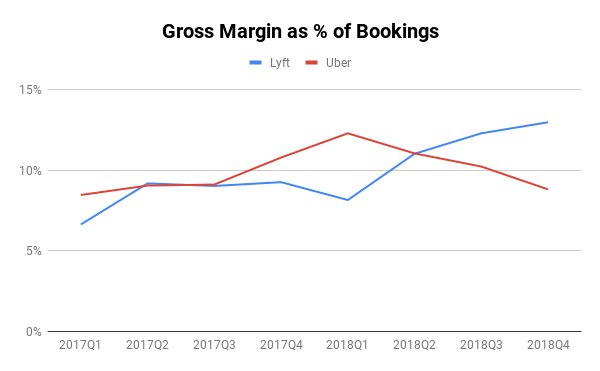
◆ Lyft has a higher profit margin, but it is also possible that a deficit is recorded.
The graph below is a graph of
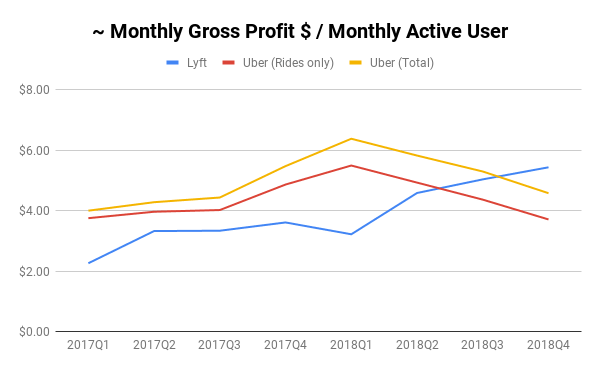
The graph below shows the gross profit per user. Here again, Lyft has begun to make a leap from the first quarter of 2018, while Uber has fallen to the right.
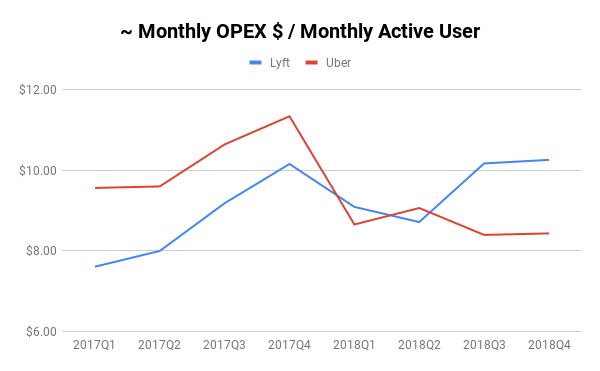
However, the situation looks a little different if you look at the graph below that shows the OPEX (operating cost) per user. Although Uber's operating expenses remained high until around the fourth quarter of 2017, they have been able to achieve significant reductions in the first quarter of 2018. Lyft also saw lower operating expenses at the same time, but it started to rise after the second quarter of 2018, with a difference of nearly 20% in the fourth quarter of 2018.
The graph below shows the amount of deficit per user, and the lower the line, the larger the amount of deficit. If you compare it with the above graph, you can see that the operating cost is squeezing the profit of Lyft.
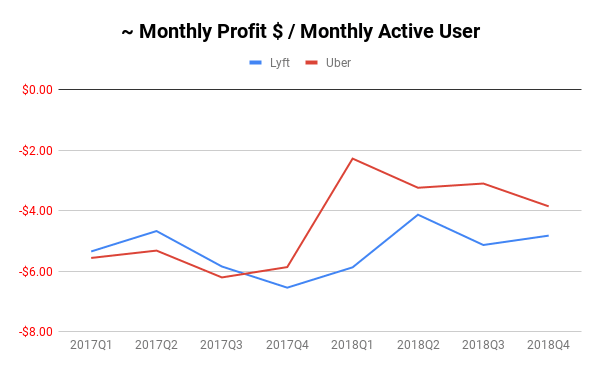
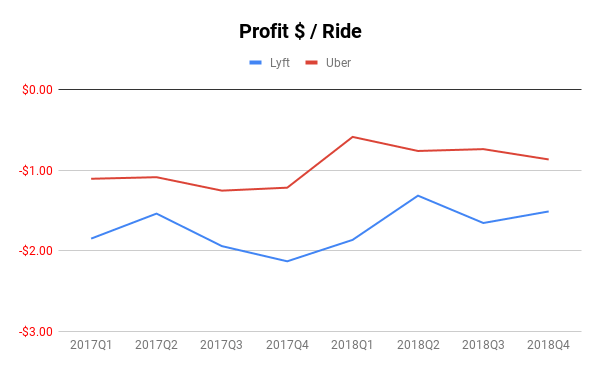
The graph below shows the profit per use. Both companies are in the red, but Lyft consistently has a larger deficit.
◆ What exactly is the cause of the Lyft deficit?
The chart below shows Zenn's growth rate of users in order to find out why Lyft is running a deficit. As you can see at a glance, the growth rates are antagonistic, and there is no difference between the two companies. As a result, you can see that Lyft is not actively investing in acquiring users, or at least that investment has not been successful.
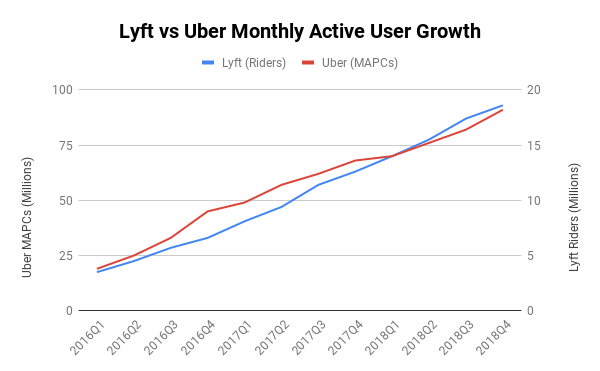
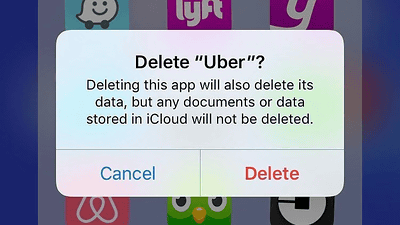
The graph also shows that the '#DeleteUber' movement that occurred in early 2017 has little effect on Uber. The '#DeleteUber' movement is described in detail in the following articles:
Why does '#DeleteUber' prompting Uber to delete his account trended?
As further analysis was done by Zenn, it was noticed that Uber was more than twice as high as Lyft when traveling home. Although it is not clear whether this is the true identity of Lyft's profit but it is not clear whether it is the trueness of the usage because the usage and tax rate trends by region are not clear, there is almost twice the gap between the rates compared in a certain usage. 'This is an astonishing result, and a thorny problem with Lyft,' said Zenn.
◆ Summary
The comparison between Lyft and Uber is summarized in the following five points.
・ Lyft has made remarkable progress by increasing the profit per ride and expanding its share. It seems that Uber leading up is probably walking in the same way
・ Despite Uber's rapid expansion overseas than in the United States, Uber continues to create excellent economics for both customers and passengers
・ The end of 2017 and “something” that happened to Uber at the beginning of 2018 seems to support Uber's good economics. This is probably due to the change of CEO, Zen thinks
・ Uber's new business (especially UberEats) contributes significantly to Uber's finances
・ Lyft needs to do something to improve cost performance in order to continue service
Related Posts:


in Note, Web Service, Vehicle, Posted by log1l_ks