Mathematically analyzing the causes of congestion makes it easy to understand the reason that the time it takes to move by the appearance of an automatic driving car is reduced
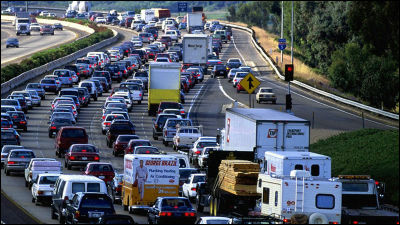
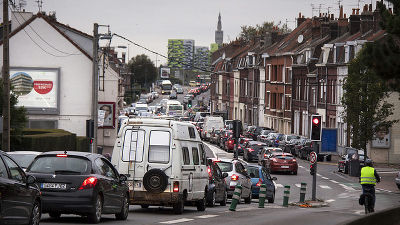
When an automatic driving car (autonomous driving vehicle) spreads, it is thought that waste at the intersection will disappear and efficiency will be improved by eliminating the waiting time . In addition to that, the phenomenon that the overall pace is greatly reduced by overcrowding of vehicles on the road is solved, and by supporting ideal road selection, traffic congestion dramatically resolves It is indicated by mathematical verification of Stanford Artificial Intelligence Laboratory (SAIL) .
Altruistic Autonomy: Beating Congestion on Shared Roads | SAIL Blog
http://ai.stanford.edu/blog/altruistic-autonomy/
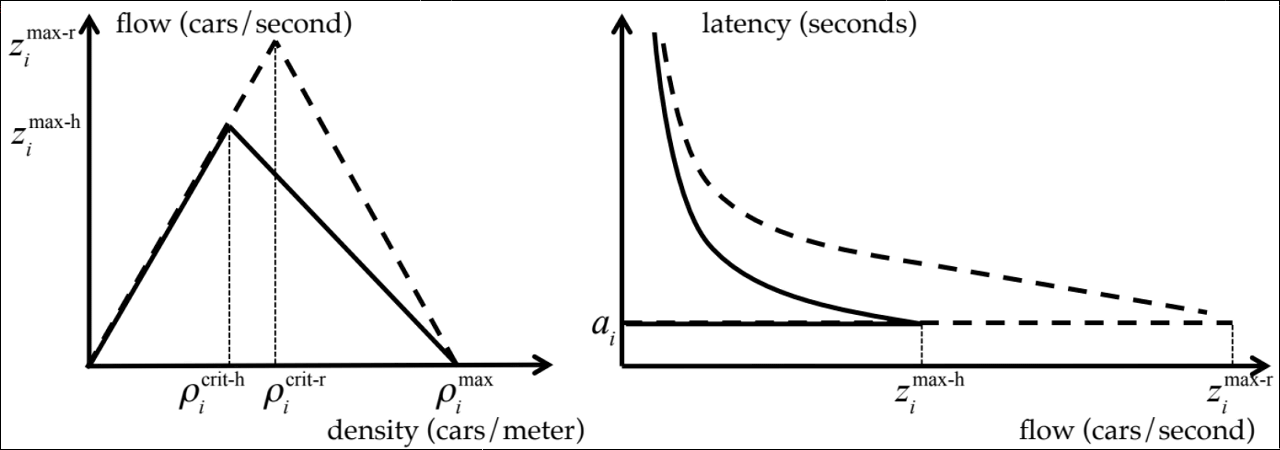
The following graph is a graph showing road traffic conditions created in the Fundamental Diagram of Traffic (FDT) which studies ideal road traffic conditions and the vertical axis shows the number of cars passing through a certain point on the road in one second flow), and the horizontal axis is a plot of the number of cars existing per meter (FDT 1). The graph has a shape like a mountain, it is characterized by becoming a blue part rising to the right shoulder and a red part of the descending right shoulder.
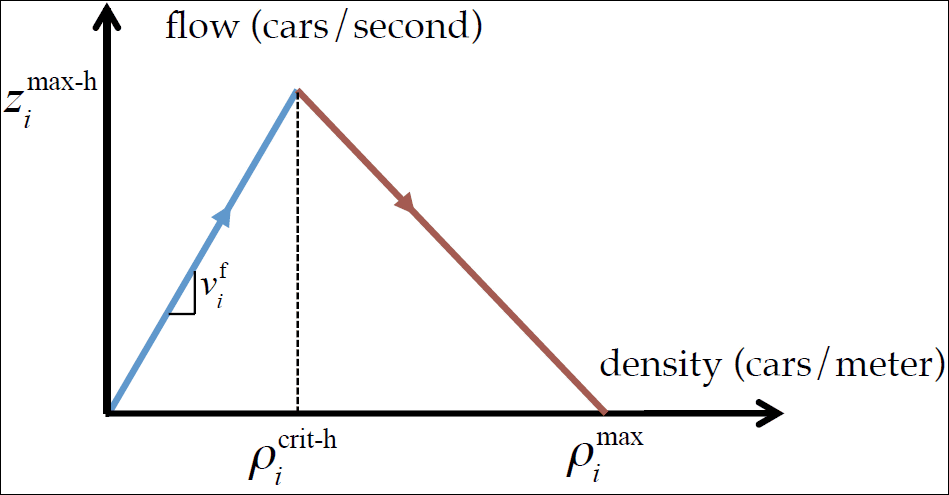
Describing the contents of the FDT 1, the origin is zero state of the car on the road, there is no car running around, so it is possible to run comfortably at the highest speed in Switzerland. Even if the number of cars increases, there is enough space All cars can run comfortably at full speed during the blue part, so flow will also increase in proportion to the number of cars (equivalent to density).
However, when a car runs, it is generally necessary to keep a distance of at least two seconds between the car running in front. This is the minimum required inter-vehicle distance so that an accident will not occur even if the vehicle ahead is suddenly braked, the point where all the cars can not run at intervals of 2 seconds as the number increases and the density increases Point). This is the summit of the mountain of the graph above, and in order to keep two seconds of inter-vehicle distance, the number of cars on the road will have to slow down as the number of cars increases. Therefore, if the density exceeds the saturation point, the flow becomes a state of falling to the right (red part).
The graph below shows the latency (latency) required to move from one point on the road to another point on the vertical axis and the flow on the horizontal axis (FDT 2). In the blue part, the latency is constant as the front car can run at the highest speed. However, when reaching the saturation point, the latency will rise because the speed decreases. The flow also decreases in the red part after the saturation point, so the graph is hyperbolic. In other words, as the number of cars increases from the saturation point, you will see that the arrival time to the destination will be longer.
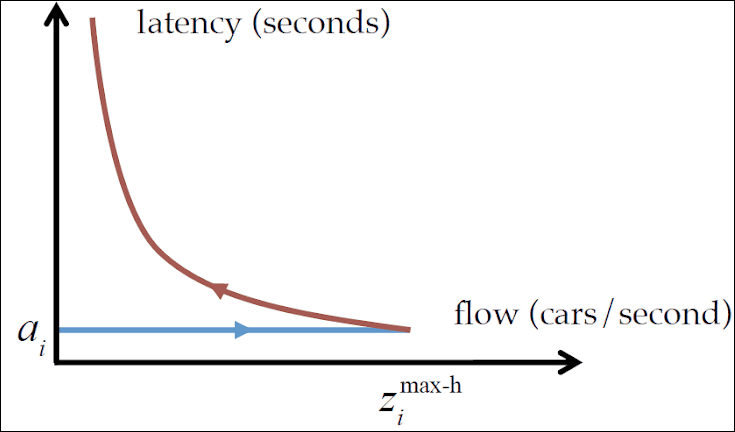
In the real world all the cars do not run at a constant speed and the inter-vehicle distances are also different, so the above two graphs are theoretical values of the ideal state, but as the number of cars increases, at some point they reach the destination suddenly It is easy to understand the feature that the time it takes to start to become longer.
Furthermore, in the real world, more complicated dynamics will work for road traffic because of the "selfishistic" human character. Let's examine the case of traveling from Beverly Hills in Los Angeles to the Valley by car. There are three routes, 25 minutes for shortest route "Clodwater", 30 minutes for "Highway 405", 35 minutes for long distance "Laurel".
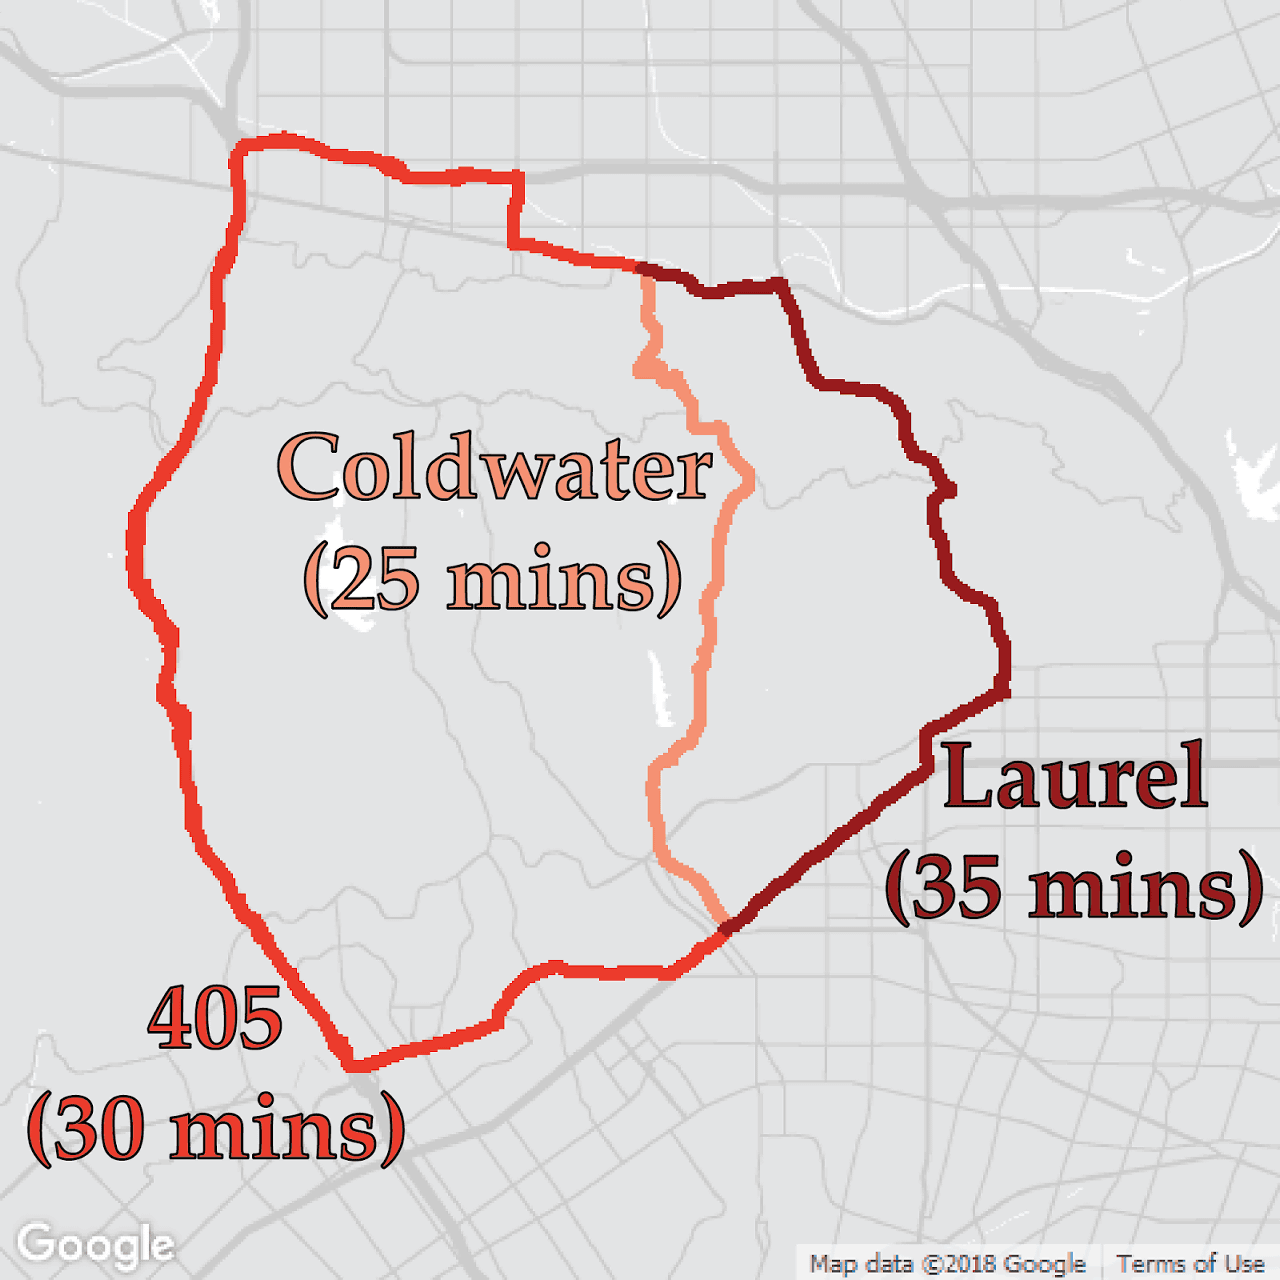
Of course, it is not possible to say unequivocally because there are time zones where traffic congestion tends to be easy for each course, but there are many drivers who choose Clodwater for a few minutes of time. However, everything to think like this is the same, as many drivers choose Clodwater, the density of Clodwater will rise, the saturation point will be exceeded, and the traveling time will eventually become long ... ... on a daily basis It is happening. The important thing here is that the increase in travel time at Clodwater with a lot of traffic is large as a social loss. If there are a few more drivers to choose Laurel, the overall economic losses lost in Clodwater are small, and as a result there may have been a bigger gain at the expense of the driver driving Laurel. Such a phenomenon similar to the commons tragedy on the road is occurring.
As to which way to choose, the driver will also decide by considering the "strategy" of other drivers. Even if you choose any way, if it takes the same time, incentives to switch to other roads will not work and Nash equilibrium will occur. Naturally, Nash equilibrium does not occur in one condition, and there are various conditions.
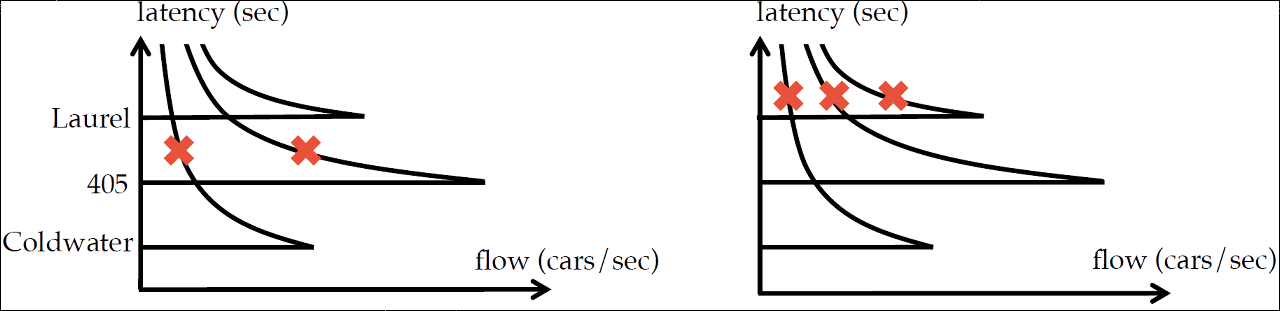
The graph below shows the state of Nash equilibrium. A graph of FDT 2 is plotted for each of the three routes, and "x" in the figure indicates the actual road condition. Nash equilibrium is generated in both cases, but the value on the vertical axis latency is smaller on the left figure, so the arrival time to the destination will be shorter. What matters here is that both graphs are for the case where the same number of cars are running. In other words, even when moving the same number of cars, the time it takes for the destination to arrive will be longer or shorter depending on where the Nash equilibrium occurs.
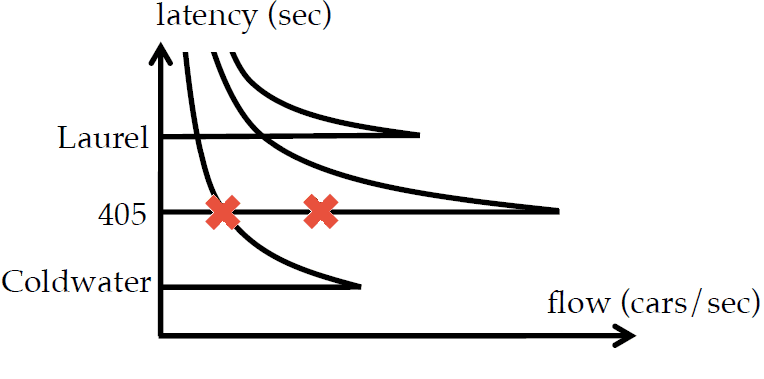
The graph below shows the condition that the latency becomes shorter under the same condition as the above graph. In the state of this graph, line 405 is in a state where there is sufficient vacancy, even if another car is added, it is possible to run at the highest speed. The more drivers who run the large Capacity 405, not Clodwater, which will saturate quickly, the shorter the waiting time is.
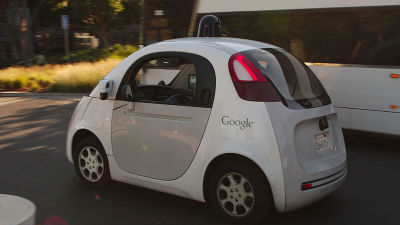
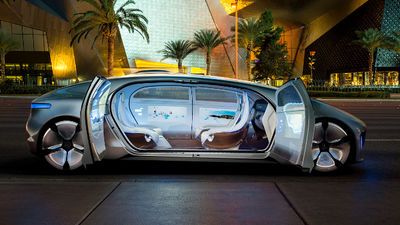
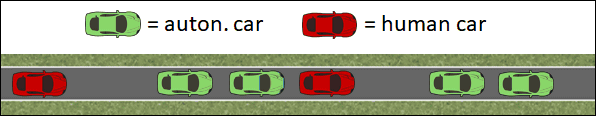
It is clear that the maximum speed at which it can run as described above is related to the crowded condition of the road and the time to maintain the distance between vehicles is important. In this respect, a human being requires a distance of two seconds between cars, but if it is an automatic driving car (autonomous traveling car), driving at a shorter inter-vehicle distance is possible. It is almost certain that it will become possible to travel steadily at inter-vehicle distance less than 1 second if technology increases.
Assuming that all cars on the road are automatic driving cars, the graphs of FDT 1 and FDT 2 change greatly like the broken lines in the graph below. The number that can run comfortably while maintaining the maximum speed increases, and the limit point to reach the saturation point increases.
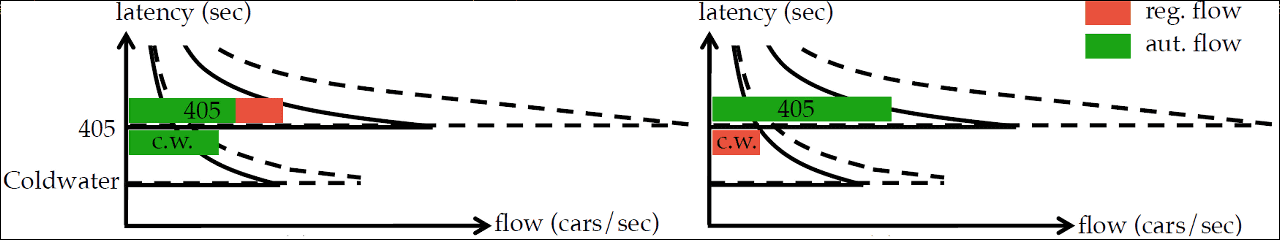
Even on the road with exactly the same Nash equilibrium, there will be a difference in speed tolerance (robustness) depending on the ratio of the general car of the running car and the automatic driving car. For example, the following two FDT 2 graphs show that the same number of regular cars and automatic driving cars are running and the latency is also the same, so arrival time to the destination is the same. However, since the limit on the saturation point is expanded more by simply gathering a lot of automatic driving cars on the 405 on the right, even the capacity on the right, many automobiles can be used without increasing the latency It can be added, and it can be said that it is highly tolerant to speed down. In other words, the situation on the right is more robust and can be said to be "strong in traffic (not easily congested)"
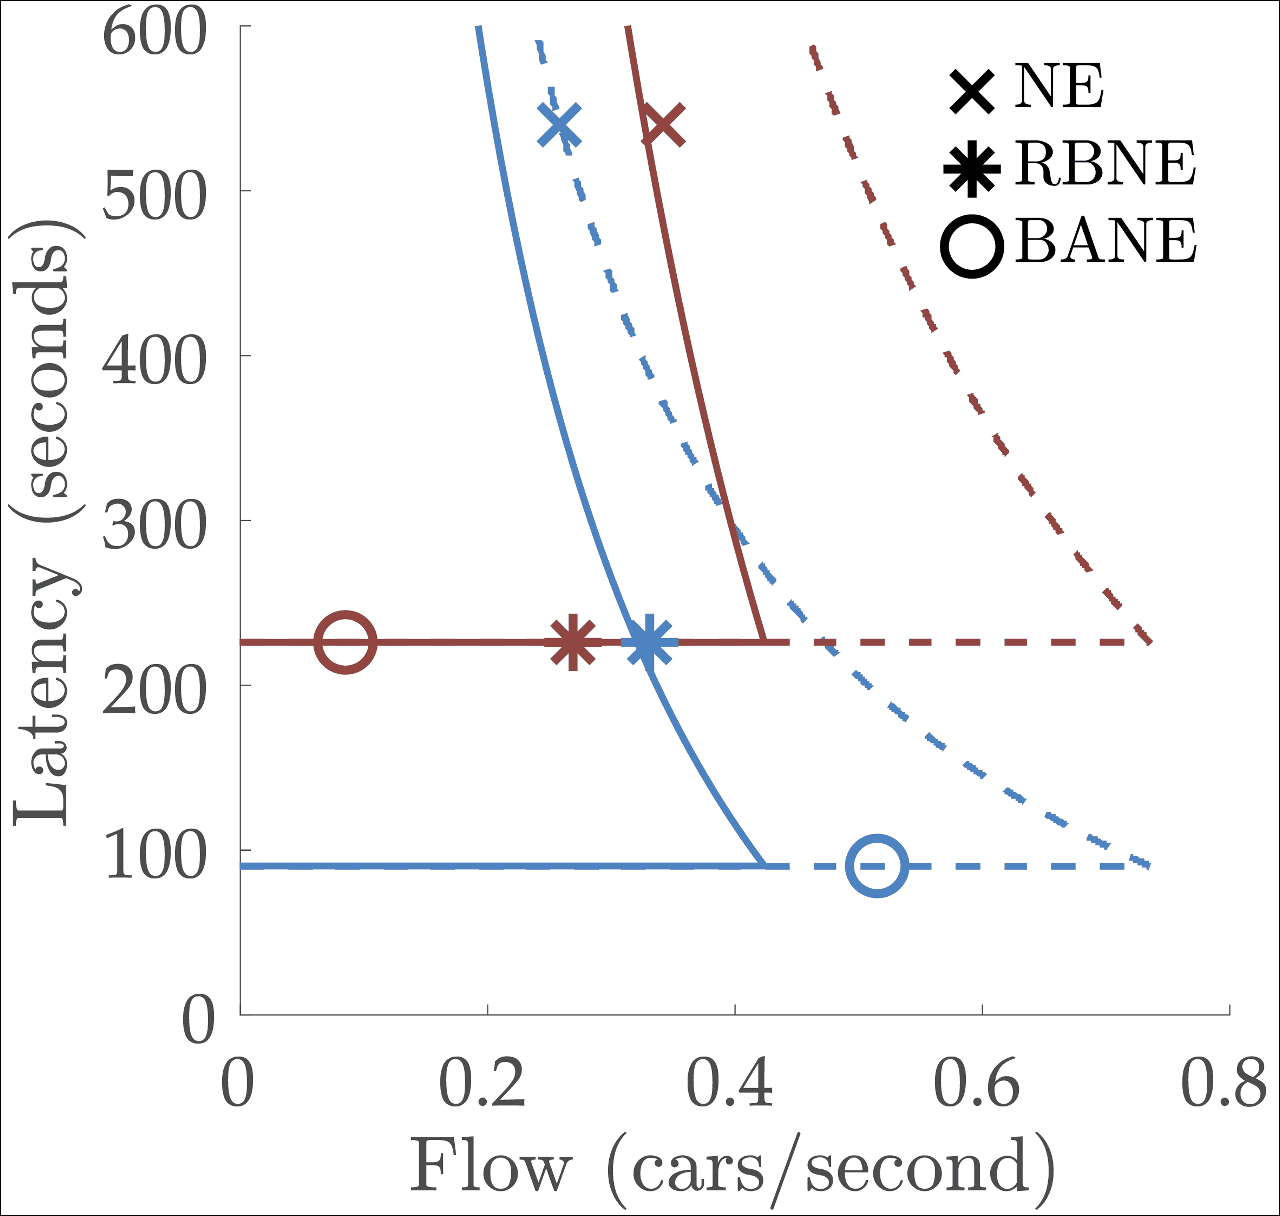
Researchers at SAIL have found that latency can be reduced by inducing a certain Nash equilibrium state (NE) into two conditions, the ideal Nash equilibrium state (BANE) that lowers latency and the state with the highest robustness (RBNE) It seems that we confirmed by simulation that it can be greatly lowered.
As described above, making the best condition that the arrival time will be short as a whole by appropriately distributing cars to each road, regardless of whether it is a general car or an automatic driving car or a mixture of both conditions It is possible. It is a selfish idea that human beings are obstructing to create an ideal state, but as automated driving cars become popular, all vehicles running on the road cooperate, making congestion less You may be able to create traffic conditions with less economical loss.
Related Posts: