A struggle for Google experts to fix Chrome's freeze
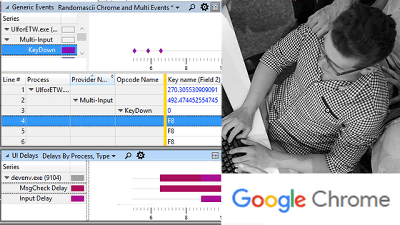
Bruce Dawson who encountered the phenomenon "Chrome freezed while using Gmail despite being a high-end PC loaded with a CPU with 24 cores" until the discovery of the cause The blog posts efforts on it. Dawson is an expert developer who is developing Chrome on Google.
24-core CPU and I can not type an email (part one) | Random ASCII
https://randomascii.wordpress.com/2018/08/16/24-core-cpu-and-i-cant-type-an-email-part-one/
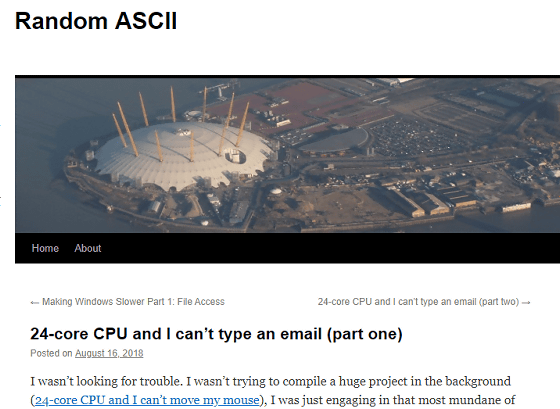
One morning, Mr. Dawson got an extremely everyday "write mail" work in Gmail, but after showing the suspicious behavior that the input character is displayed late, Gmail responded suddenly I encountered the situation that it will be gone.
Mr. Dawson usually sets up an event tracking tool called " UIforETW " in the background as usual, and event information of the past 30 seconds is saved to disk by simply pressing "Ctrl + Win + R" It is supposed to be. By loading the saved event information into the analysis tool " Windows Performance Analyzer " and finding the "stop the message pump in the event loop " which is characteristic when freezing as done in the same blog article , the cause of the freeze You can locate the thread that is.
In most cases, the cause is found by the above method, but this time it did not work well with this method. Chrome is doing a message pump which is proof that the event loop is working even after freezing, and it can not find any thread which is in an infinite loop or does not do anything completely, and Chrome on the analysis tool is " It seemed that it seemed to only seemed to have entered the standby state because nothing was input.

UIforETW also has a "keylogger" function to store the information of the entered key, but by default for security reasons it is in private mode, all inputs are indicated as "1" or "A" It is supposed to be done. Mr. Dawson switched this keylogger function from private mode to full function mode and he said that he waited for a similar freeze.
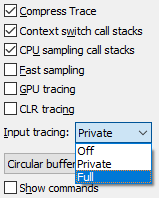
Fortunately (?) The next day another freeze occurred, so Mr. Dawson saved the event information and left the following memo at the same time.
When I entered "defer to those with more scuba experience", Gmail slightly froze behind "those" and then entered "experience".
The PID (process ID) of the Gmail tab is 27368.
The input event of the keyboard seen by the analysis tool is as follows. The timing when the event occurred is indicated by purple diamond in the upper right, and we were able to clearly identify the timing when freeze occurred. And at the timing when this freeze occurred it can also be seen that the CPU utilization displayed at the bottom of the image is almost 0.
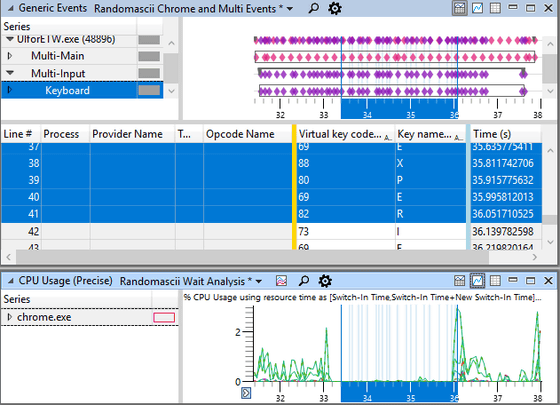
Since the timing of the freeze has been known, if you examine the thread of the chrome.exe process in this period in detail, it turned out that the thread was successfully called 440 times during 2.81 seconds that was freezing It was. 440 times in 2.81 seconds is a calculation that is called once every 6ms, which is a sufficient number of calls to return a normal response. Further investigation of the cause revealed that the same stack was stacked in each call. The corresponding part is expressed as follows in a simple form.
chrome_child.dll (stack base)
KernelBase.dll! VirtualAlloc
ntoskrnl.exe! MiCommitVadCfgBits
ntoskrnl.exe! MiPopulateCfgBitMap
ntoskrnl.exe! ExAcquirePushLockExclusiveEx
ntoskrnl.exe! KeWaitForSingleObject (stack leaf)
Chrome calls VirtualAlloc and that VirtualAlloc is trying to acquire a lock that is an exclusive write authority to rewrite something called "CfgBits". Mr. Dawson initially thought that Chrome called 440 times VirtualAlloc, but in reality VirtualAlloc was only recalled once, furthermore there was a notice that "lock is available" I heard that he was failing to acquire lock 439 consecutive times though. This is because the process that released the lock immediately got the same lock.
The Windows lock is " unfair " which allows the thread that attempted to lock later to lock first, so it is now possible to "keep getting the same lock all the time" like above . And WmiPrvSE.exe which kept getting lock this time was WmiPrvSE.exe, which opened the lock with the following stack.
ntoskrnl.exe! KiSystemServiceCopyEnd (stack base)
ntoskrnl.exe! NtQueryVirtualMemory
ntoskrnl.exe! MmQueryVirtualMemory
ntoskrnl.exe! MiUnlockAndDereferenceVad
ntoskrnl.exe! ExfTryToWakePushLock (stack leaf)
And Mr. Dawson investigated what this WmiPrvSE.exe is using the time. The stack of the part that took a long time was as follows.
WmiPerfClass.dll! EnumSelectCounterObjects (stack base)
WmiPerfClass.dll! ConvertCounterPath
pdh.dll! PdhiTranslateCounter
pdh.dll! GetSystemPerfData
KernelBase.dll! Blah-blah-blah
advapi32.dll! blah-blah-blah
perfproc.dll! blah-blah-blah
perfproc.dll! GetProcessVaData
ntdll.dll! NtQueryVirtualMemory
ntoskrnl.exe! NtQueryVirtualMemory
ntoskrnl.exe! MmQueryVirtualMemory
ntoskrnl.exe! MiQueryAddressSpan
ntoskrnl.exe! MiQueryAddressState
ntoskrnl.exe! MiGetNextPageTable (stack leaf)
"NtQueryVirtualMemory" in the above data is used to scan process memory, but this NtQueryVirtualMemory is called from GetProcessVaData. Mr. Dawson who stepped on doubting this area seems to have created a program that calls NtQueryVirtualMemory and scans the address space of a specific process. Although the program worked properly, scanning the Gmail process took quite a long time, more than 10 seconds, and also triggered freezing of Gmail.
Dawson created a program to scan himself, so he was able to take various statistics. NtQueryVirtualMemory returns a contiguous range of address space with matching attributes, such as reserved or specified protection settings, as a block. According to the survey, the Gmail process had a total of 26,000 blocks, but as I scanned another process with 16,000 blocks, the scan finished in an instant, so the number of blocks was It seems not to be a problem.
Now, looking at the Gmail process with VMMap , it turns out that 361,836 KiB of memory is used in 49,684 blocks in the Shareable category, and that the memory reserved amount reaches 2 TiB .
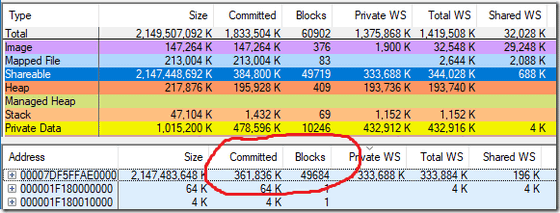
This 2TiB memory reservation is used for Control Flow Guard (CFG). Mr. Dawson recalled that "MiCommitVadCfgBits" was loaded on Chrome's call stack that I confirmed first, and it seems that this CFG has found the cause of this problem.
CFG is for preventing exploit , but the content of 2TiB memory reserved by this CFG is a sparse bit string, and it is managed which address in the 128 TiB memory space for user is a valid target doing. Mr. Dawson runs the virtual memory scanner I created earlier and seems to have examined how many blocks exist in the 2 TiB memory reservation of this CFG and how many of them are executable . Since the CFG memory points to executable memory, Mr. Dawson seems to have expected that one CFG memory block exists for each block of executable memory, but in fact it is in the executable memory 98 block On the other hand, there were 24,866 blocks of CFG memory. In addition, the previous VMMap display was 49,684 blocks, but this counts only the block to which Mr. Dawson 's tool is committed, while VMMap is reserved in addition to the committed block It also counts the blocks that are in it.
Scan time, Committed, page tables, committed blocks
Total: 41.763 s, 1457.7 MiB, 67.7 MiB, 32112, 98 code blocks
CFG: 41.759 s, 353.3 MiB, 59.2 MiB, 24866
CFG memory block when the executable memory is placed it is also arranged, but from the results of the above executable memory is open looks like the CFG memory when it is not open.
In order to confirm this behavior, Mr. Dawson created a program called "VAllocStress" which allocates and releases blocks of executable memory to random addresses. The algorithm of this program is as follows.
1. Turn the following loop a lot
A. Place executable memory at random address using VirtualAlloc
B. Release that memory
2. Then turn the following loop infinitely
A. Wait 500 ms to avoid CPU hog
B. Use VirtualAlloc to place executable memory at a certain address
C. If the time taken for B's operation exceeds 500 ms, a message is displayed
D. Release memory
It was confirmed that when the above simple program was executed and the state of operation was monitored by the aforementioned virtual memory scanner, the CFG memory block became fragmented and it took a long time to scan. Eventually the VAllocStress program froze and said the problem was successfully reproduced.
The cause of the problem is now known, but Chrome will continue to investigate how it was causing this problem. The V8 engine running JavaScript in Chrome uses the CodeRange object for memory management, but the size of each CodeRange object is limited to 128 MiB . Because of this limitation, Mr. Dawson seemed to think that CFG would not be allocated excessively.
However, when multiple CodeRange objects are generated, the story differs. Mr. Dawson's survey reveals that while opening Gmail, CodeRange objects were repeatedly generated and deleted every few minutes. Furthermore, using the debugger, it became clear that WorkerThread :: Start was generating these CodeRange objects, and the whole thing was elucidated.
The complete problem found by Mr. Dawson's investigation is as follows.
1. Service workers are used in Gmail for offline mode.
2. According to the specification of the service worker, the service worker repeats startup and shutdown every few minutes
3. Each service worker gets a CodeRange object, and this CodeRange object secures executable memory in a random place from the 47-bit address space to execute the code generated by JIT from JavaScript
4. CFG memory reservation receives entry when new code is allocated
5. Allocation of this CFG will not be freed forever until the process is over
6. Scanning enlarged CFG memory NtQueryVirtualMemory is very slow
The problem of slow scanning of this CFG memory has been fixed in the Windows 10 RS4 update of April 2018. Also, Chrome's JavaScript engine V8 team has also modified to reuse the CodeRange object that caused the problem. In addition, the two programs "VirtualScan" and "VAllocStress" created by Mr. Dawson in this survey are published on GitHub .
Related Posts:
in Software, Posted by log1d_ts


