It will be like this if you convert visual data such as graphs and charts to sounds and make them even blind persons understand

ByTakumi Yoshida
Electronic devices are built in various things, and enormous data that can not be processed with human hands is now being recorded, enormous data can be transferred in a variety of waysVisualizationAttempts are being made. However, graphs and charts are not useful for visually impaired people, so by changing graphs to music, people with visual impairment will be able to understand changes in values sensuously Efforts are drawing attention.
Listen to these charts turned into music - Quartz
https://qz.com/921662/software-engineers-have-figured-out-a-way-to-turn-charts-into-music-for-the-blind/
Graphs and charts visualizing data are excellent expressions that make it possible to understand how values are changing in a single shot. However, no matter how easy-to-understand graphs and charts are made, graphs and charts do not make any sense at all if the other person has visual impairment.
Data analysis company in North Carolina, USASASSoftware engineer, Ed Samers, who worked at the company, has been facing this problem for a long time "This is how the visually handicapped person see the graphs and charts." Because Mr. Summers was 10 years oldRetinitis pigmentosaIt is diagnosed as "blind" as it is now diagnosed. Mr. Summers said, "The" really unfortunate aspect "that technological innovation has had on the educational setting and the workplace (happened to blind people) is the part that you do not understand graphs and charts," says Mr. Summers, It is pointed out that not knowing graphs and charts in society is a big handicap for the blind.
Under the guidance of Mr. Summers, SAS released a tool called "Graphics Accelerator" in February 2017. You can tell what kind of software Graphics Accelerator is by looking at the following movie.
Turning charts into music, for the blind - YouTube
It is Graphics Accelerator that converts the graph to sound. In the movie, the graph displayed on the left side of the screen is converted into sound.
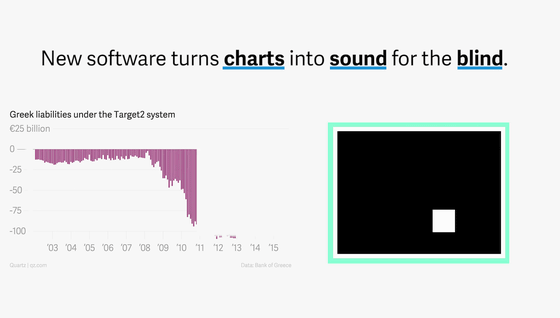
What was displayed on the screen visualized the structure of Graphics Accelerator which converts graph to sound as data point.
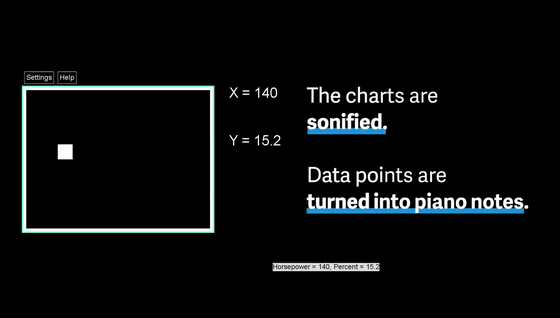
Graphics Accelerator converts bar graphs, line charts, time series graphs, heat maps, scatter charts, histograms, etc into sounds.
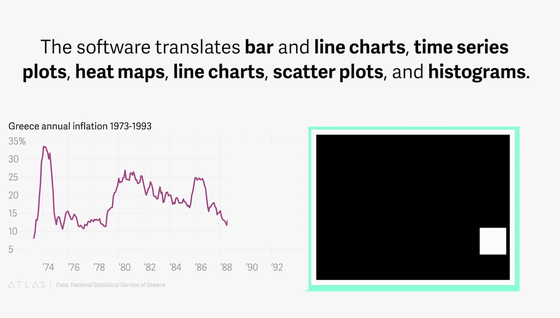
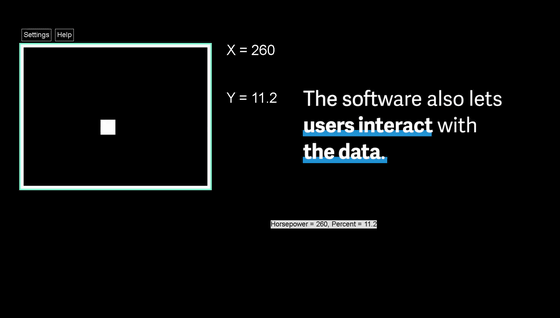
By specifying the X axis and the Y axis, it is a mechanism that sounds, and we decide the sound to ring with graph length etc.
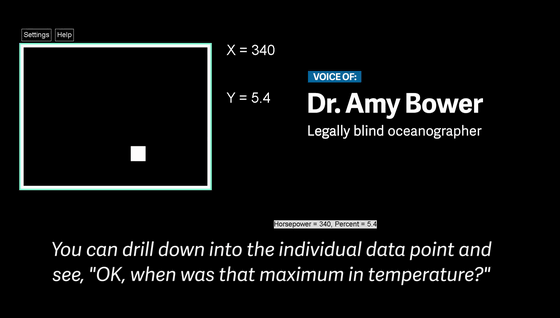
A blind marine scholar, Amy Bower said, "When you use the Graphics Accelerator, even a blind person decomposes individual data points and" When is the temperature the highest? "" Yeah. , It's July 2005, "you can thoroughly break down the data."
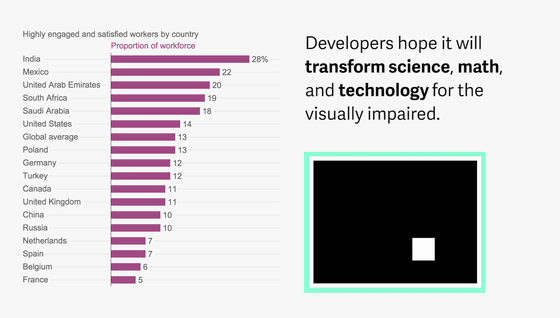
In addition, developers hope that software such as Graphics Accelerator can help visually handicapped people in various fields such as science and mathematics besides data.
SAS Graphics Accelerator, which recognizes graphs and charts on web pages and converts them to sound, is provided free as an extension to Google Chrome and addons for Firefox are also scheduled to be released.
SAS Graphics Accelerator - Chrome Web Store

Graphics Accelerator is an example of sound processing that converts data to sound, and thus art and science. Professor Mark Barorra of the Faculty of Music Technology at the University of Pennsylvania State tells us that the ear is effective for distinguishing patterns and subtle changes and points out the usefulness of tools using sounds for visually impaired people doing.
In addition, software developed by NASA to auditorily recognize X-ray "XSonify"This is an example of a blind astronomer Wanda Diaz Merced and shows that the sound is an excellent source for the visually impaired. Actually the X-ray sounds like the following movie.
X-Sonify, a sonification tool developed by NASA - YouTube
Mr. Merced is a person who has used XSonify to detect X-rays that healthy people missed. The story about Mr. Merced and xSonify can be seen from the following.
Wanda Diaz Merced: Until a blind astronomer comes to hear the stars' sound | TED Talk | TED.com

How a blind astronomer found a way to hear the stars | Wanda Diaz Merced - YouTube
Professor Barorra said, "We are constantly thinking about the usefulness of science and mathematics not only for the eyes, but also for the ears to learn as children learn," and tools like SAS's Graphics Accelerator will be available in 20 or 30 years It seems that it may come to have a very significant meaning.
The SAS Graphics Accelerator has been repeatedly practiced by blind students who attend Governor Morehead School in the suburbs of Raleigh, North Carolina, and has evolved from a prototype to a level that can be used quite a bit And that. However, it seems to be frustrating for children with absolute pitching that the sounds are not perfectly matched, so it seems that adjustment is still necessary.
Related Posts:


