The graph "What the World Eats" shows changes in eating habits around the world over the past 50 years

ByMichael Stern
The everyday meal is indispensable to live, but the food you eat varies greatly from country to country. Graph showing how countries around the world have changed diet in the past 50 yearsWhat the World Eats"Is published by National Geographic and it is possible to see the calorie intake calories and ingested grams by age for each world and country by age.
What the World Eats | National Geographic
http://www.nationalgeographic.com/what-the-world-eats/
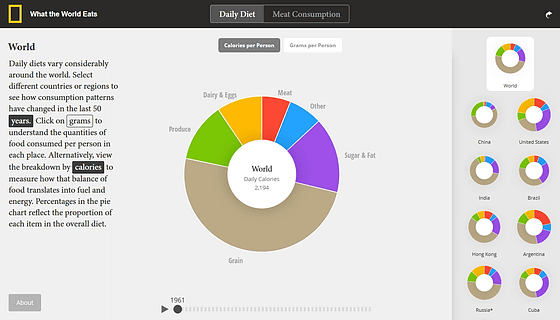
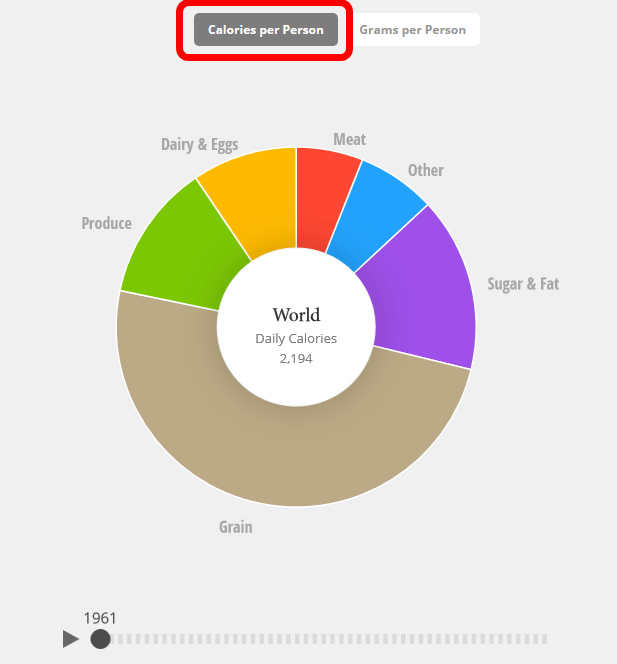
In "What the World Eats" published by National Geographic, you can see a pie chart showing the world food intake situation in 50 years going back from 2011 for 50 years. The first pie chart "Calories per Person" shows the total calorie intake per day totaling all foods. According to this graph, the caloric intake per day at the time of 1961 seems to be 2194 Kcal.
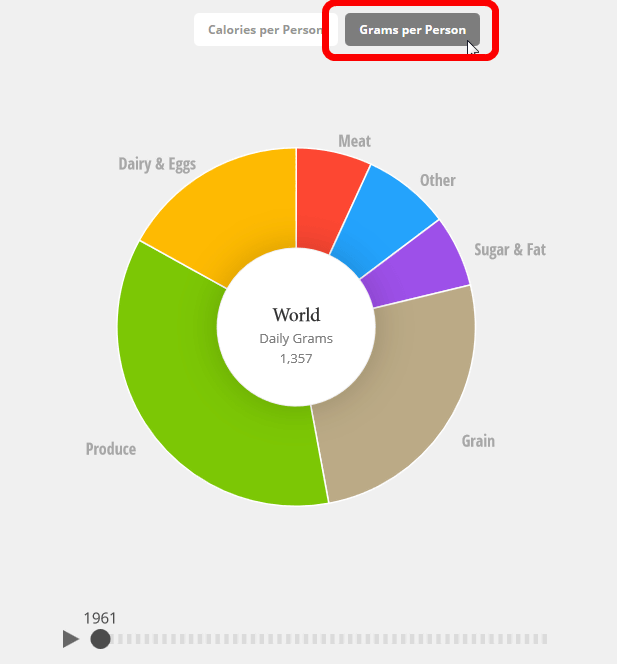
Click "Grams per Person" to display items in the pie chart in grams. Calculating the whole world, you can see that in those days 1961 people were eating about 1.3 kg of food per day.
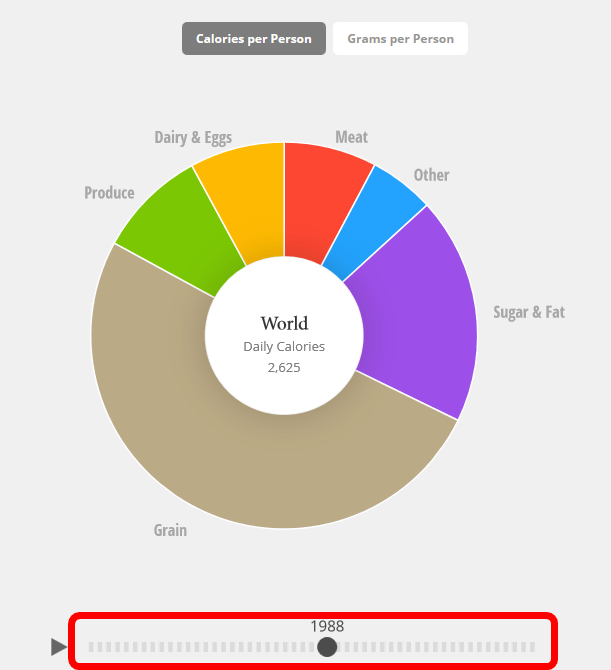
By clicking and moving the cursor under the pie chart left and right, you can switch the age from 1961 to 2011 in 1 year increments. Also, pressing the playback button on the left side automatically scrolls the cursor.
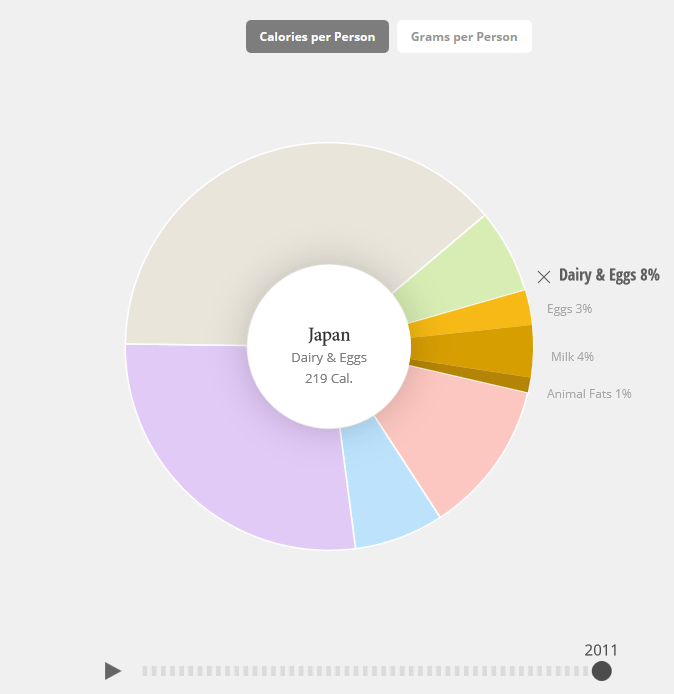
The pie chart is color-coded for each food, and when you drag the cursor to any type of area, the intake per day for each type is displayed in the middle ... ....
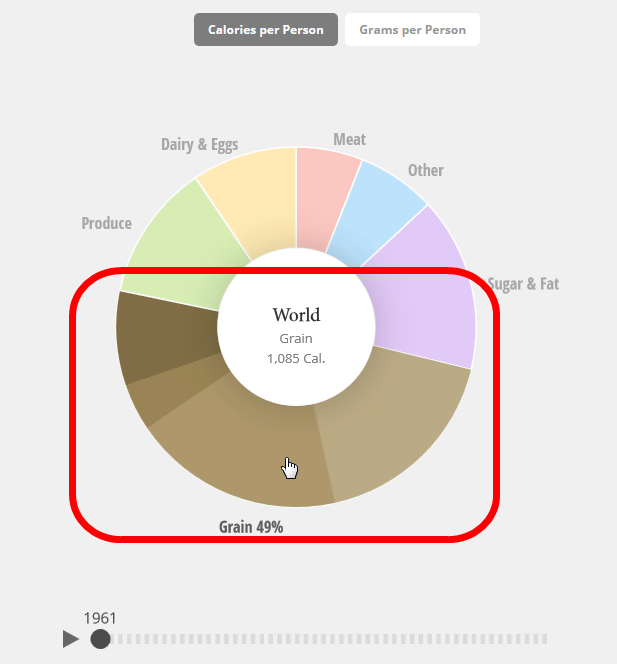
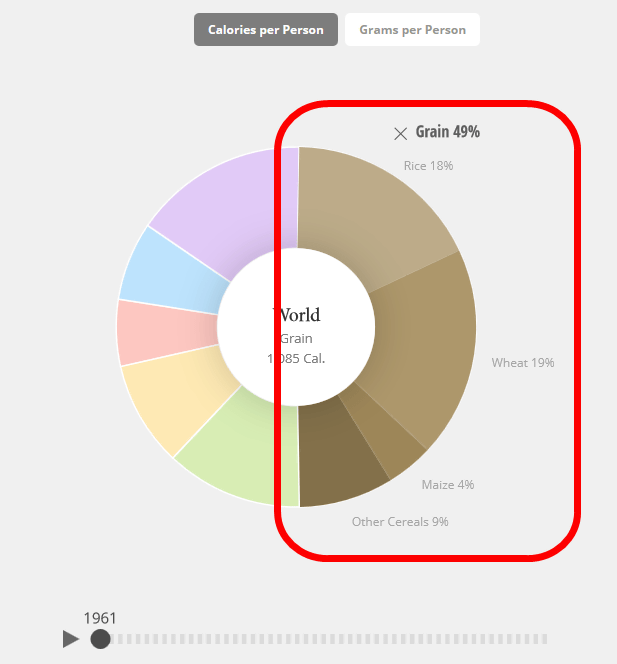
Clicking it will switch to breakdown within classification. For example, in 1961, about half of the food of the day was grain, with 18% of rice, 19% of wheat, 4% of corn, 9% of other grains. It will understand the global proportion of "American school bread faction" every age.
There is a list of countries that can be selected next to the pie chart, and you can see the situation of eating habits in the past 50 years by country by clicking on it by country.
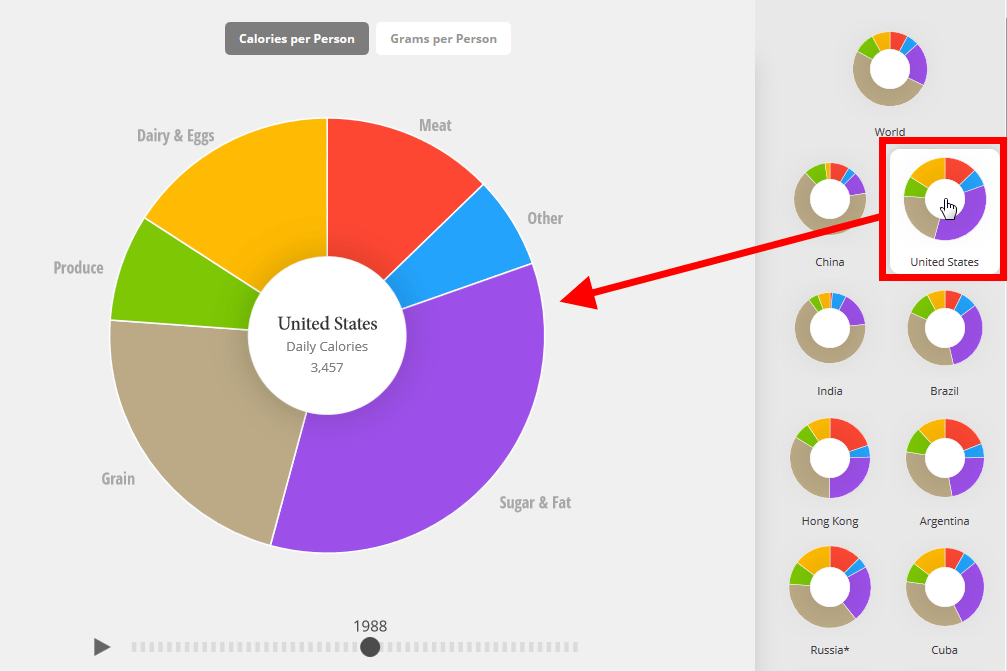
◆ America
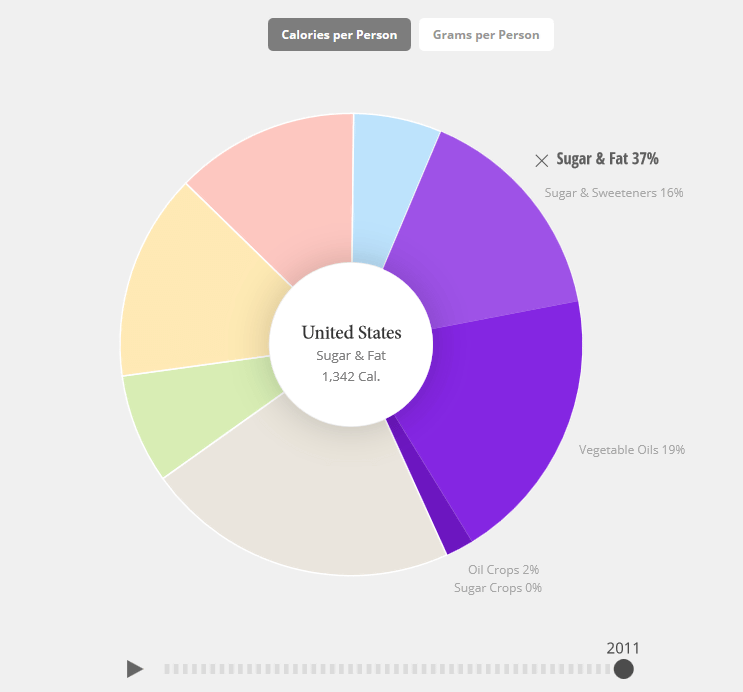
A comparison of American pie charts between 1961 (left) and 2011 (right) is like this. In the United States, the calorie intake per day in 50 years increased significantly from 2882 kcal to 3641 kcal.
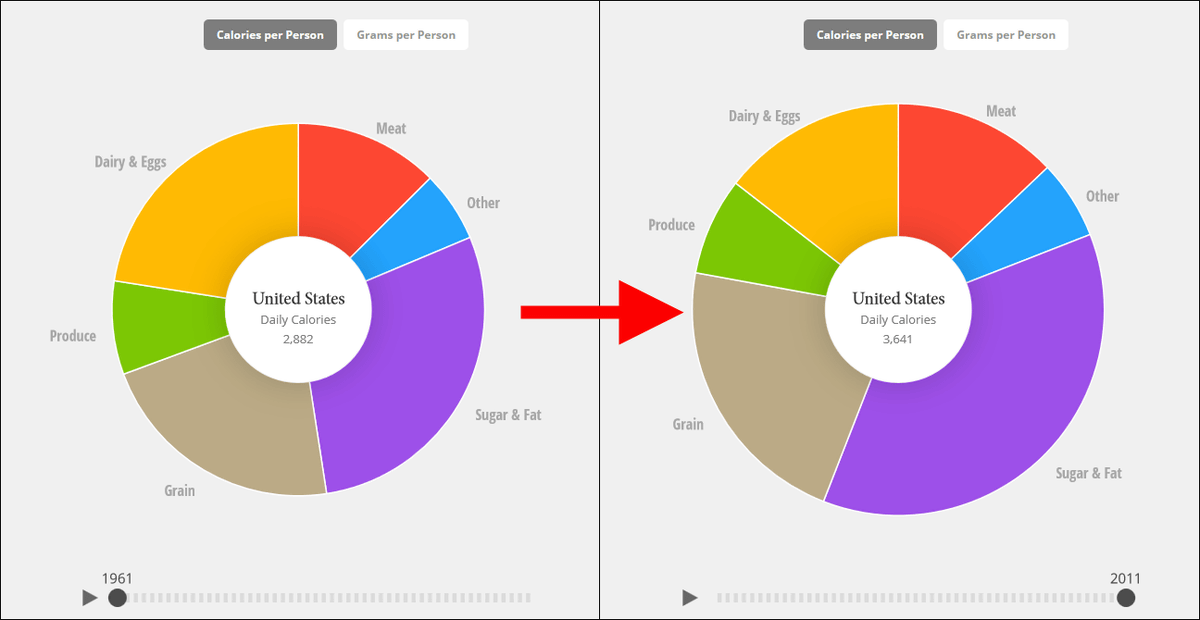
Although the intake of "sugar / fat" has increased by 6 points, the breakdown of breakdown is that surplus consumption of sugar has not increased, mainly due to increased consumption of vegetable oil. America is the country that consumes the most oil seeds in the world and American vegetable oil consumption has nearly doubled compared to 50 years ago.
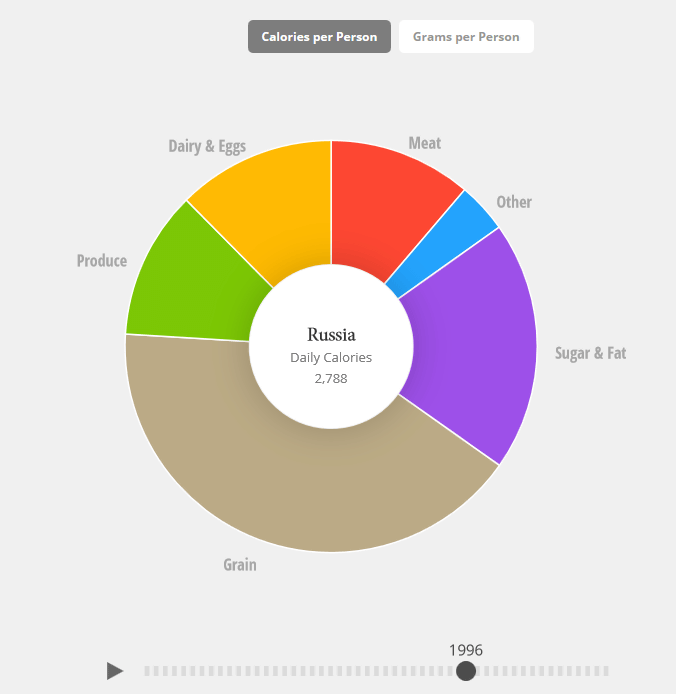
◆ Russia
In Russia, the calorie intake per day increased from 3094 kcal to 3358 kcal in 50 years. The item of "sugar / fat" has increased by 10 points over 50 years, and the items of "sugar, sweetener" and "vegetable oil" were increasing in breakdown.
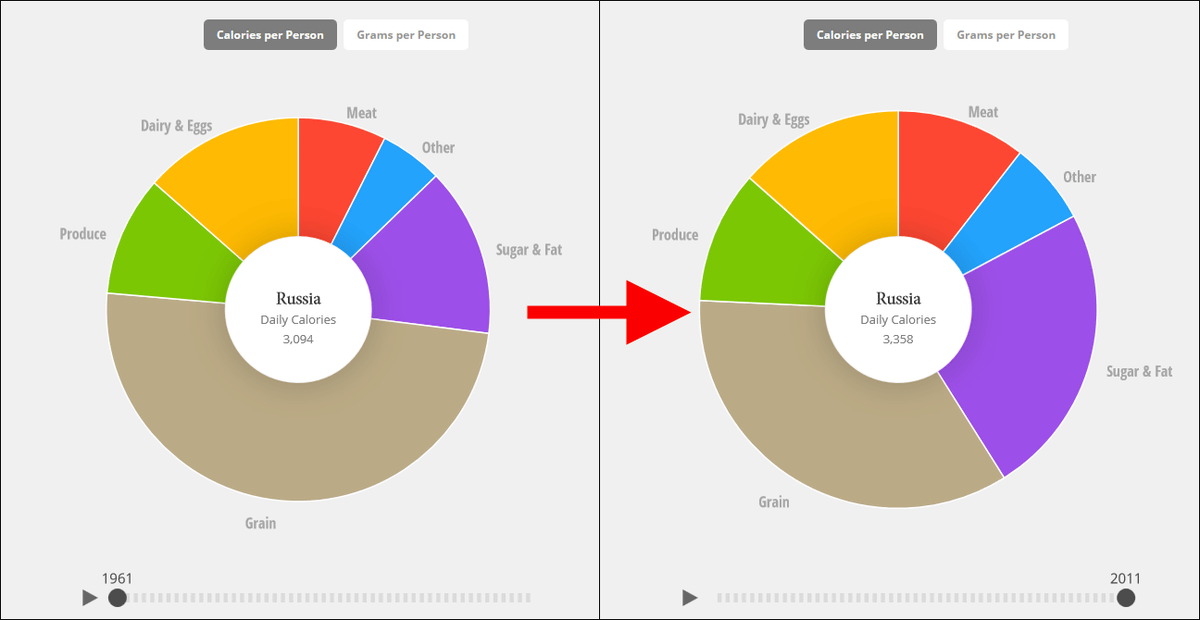
However, there were times when the calorie intake per day was less than 3000 kcal between 1990 and 2000. The confusion caused by the collapse of the Soviet Union is affecting this.
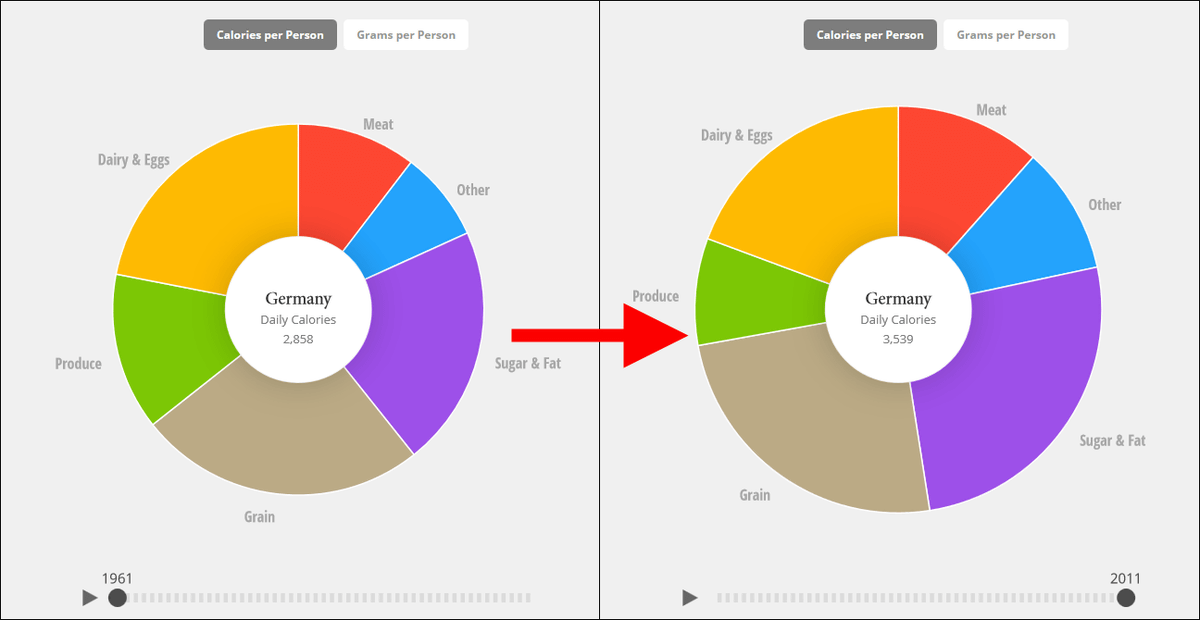
◆ Germany
In Germany, the calorie intake per day is 2858 kcal to 3539 kcal in 50 years, the calorie intake from alcohol records the world's best by surpassing Belgium and Denmark. Moreover, the calorie intake of "dairy products and eggs" is also the best in the world, and it seems that it is one reason that dairy products such as cheese are obtained at low price.
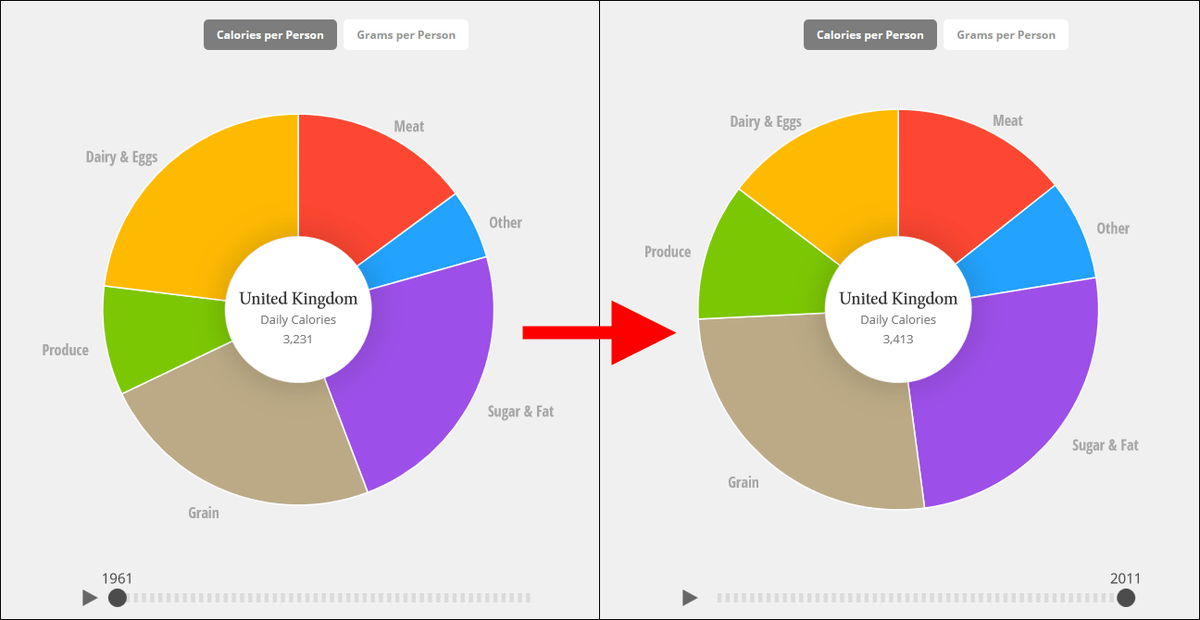
◆ UK
In the UK, the calorie intake per day from 1961 to 2011 has hardly changed. The calorie intake of dairy products · eggs is decreasing, because consumption of animal fat such as butter has decreased, overall consumption of dairy products · eggs is the same as 50 years ago about. Although there is little change in things to eat in half a century,British cuisine taste reputationThere may be an established theory in food culture that has little change may be a factor.
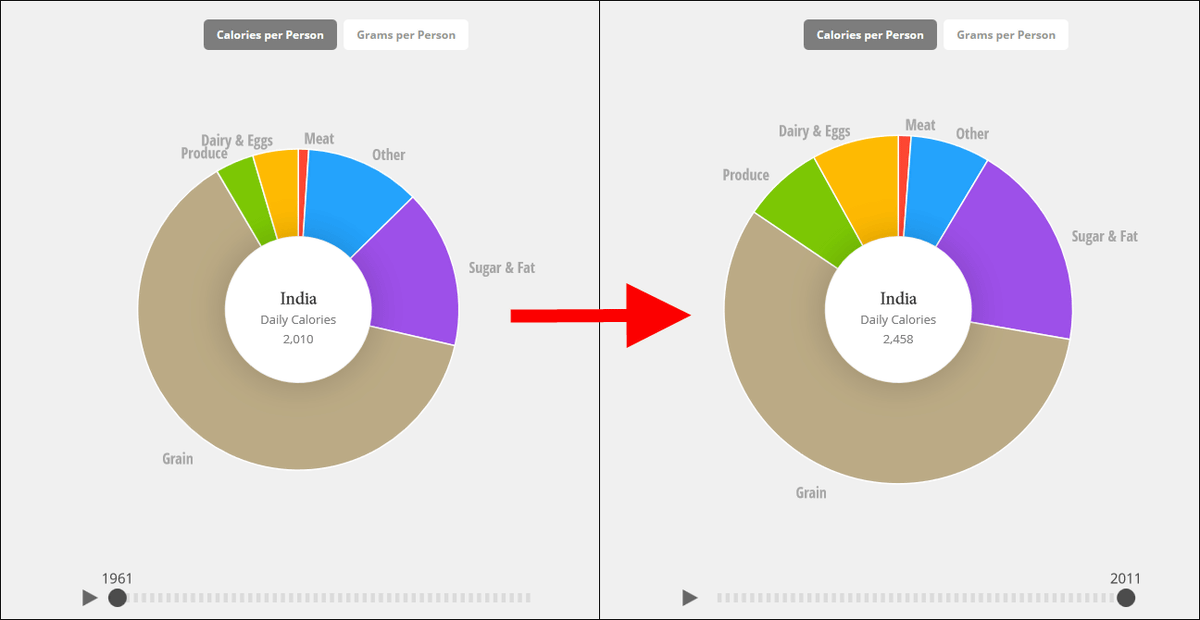
◆ India
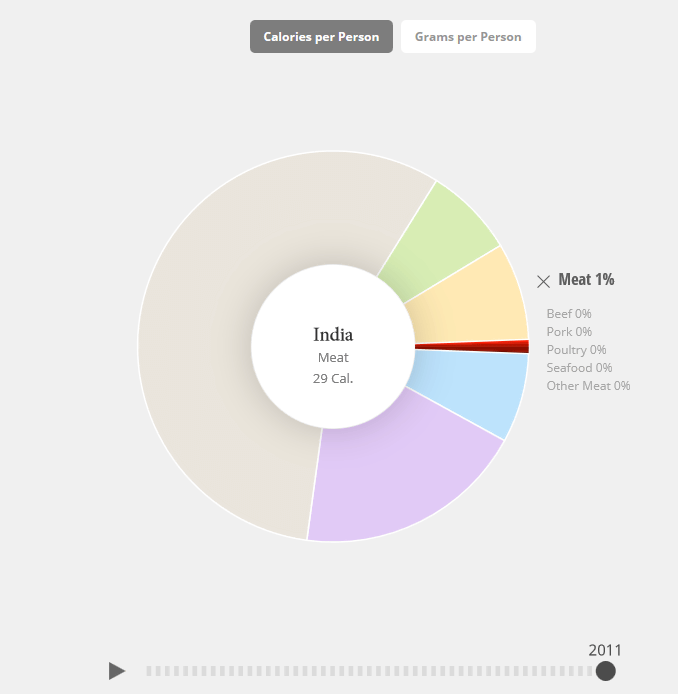
The foods consumed in Asia are different from those in Western Europe compared to other countries. Noticeable in India, as of 2011, 57% of the calorie intake is ingested from the grain. Total calorie content has increased from 2010 kcal to 2458 kcal, but we can see that the calorie intake of Indians is lower than in the Western countries 50 years ago even in the present age.
Looking at the breakdown of "meat", the total calorie intake from meat per day is only 29 kcal, only 1% of the whole. Classifying beef, pork, chicken, fish and shellfishes, and other meats individually means that only 0% of the meat is eaten at the level of "0%", which is not statistically available, and the attitude of a thorough vegetarian state is 50 Unchanged year.
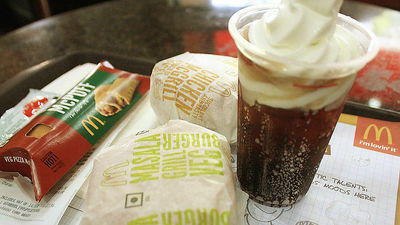
The situation of McDonald 's in India not handling beef and pork is reported by Chariderman.
Indian McDonald's 100 yen Mac style "Happy Price Menu" none of beef and pork review Review - GIGAZINE
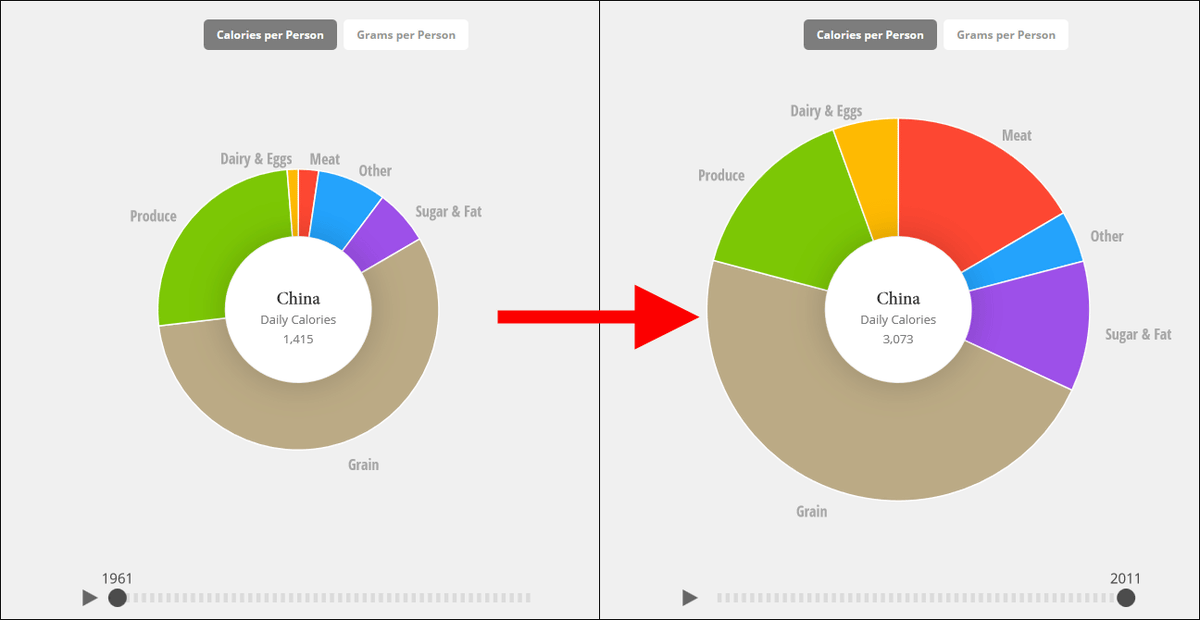
◆ China
In 1961, in China in the day, the calorie intake per day is only 1415 kcal, but in 2011 it has doubled to 3073 kcal on the same level as the developed countries. This is the fastest growth rate in the world, and dietary life shows that the country has become rich.
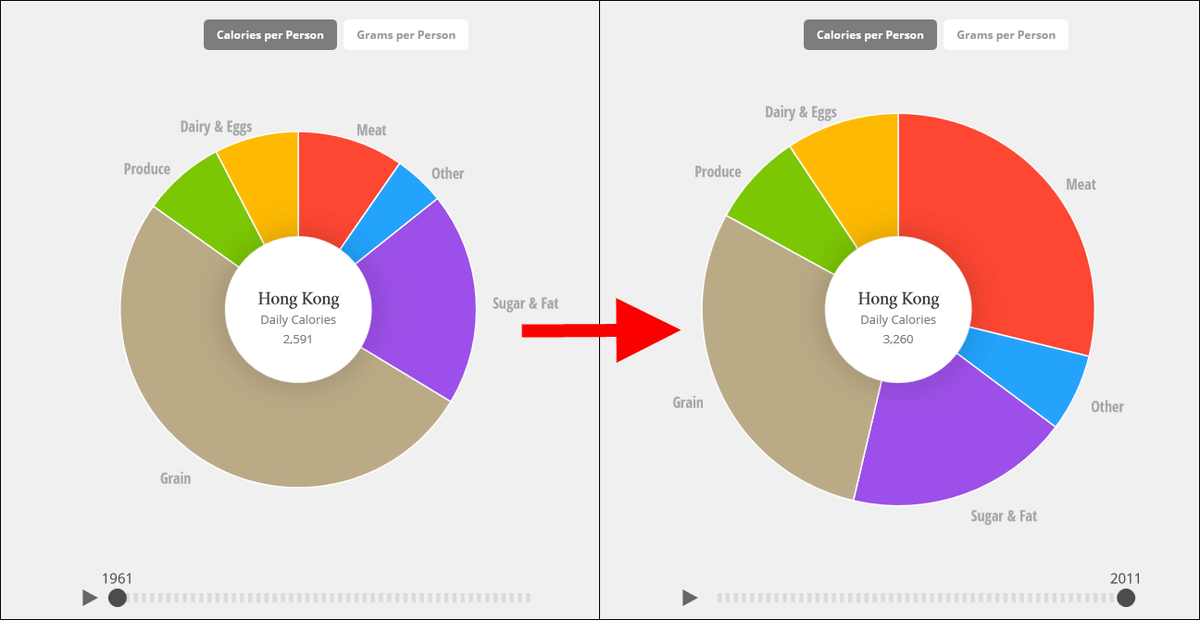
Hong Kong
In Hong Kong, which is located on the same continent as China but has different cultures, diet changes dramatically in 50 years. Especially the intake of meat is the best in the world.
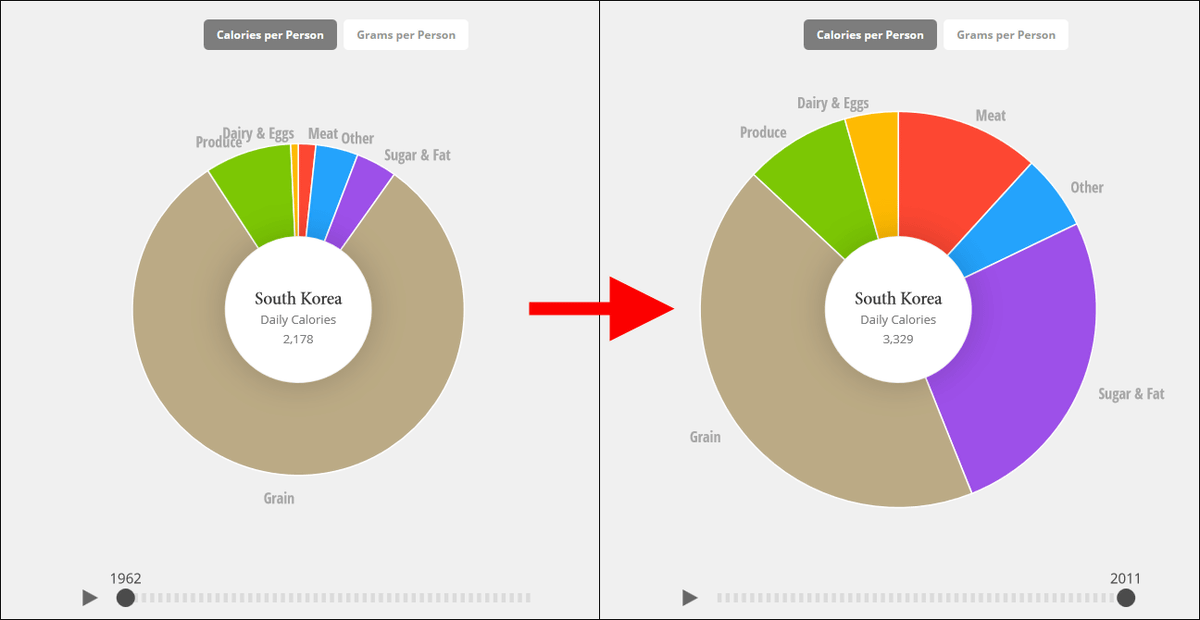
◆ South Korea
South Korea relied on cereals for most of the food in 1961, but the change began after 1970, and in 2011 the calorie intake from cereals drastically declined from 76% to 43%. By that amount items such as meat, sugar and fat increase, realizing a rich diet.
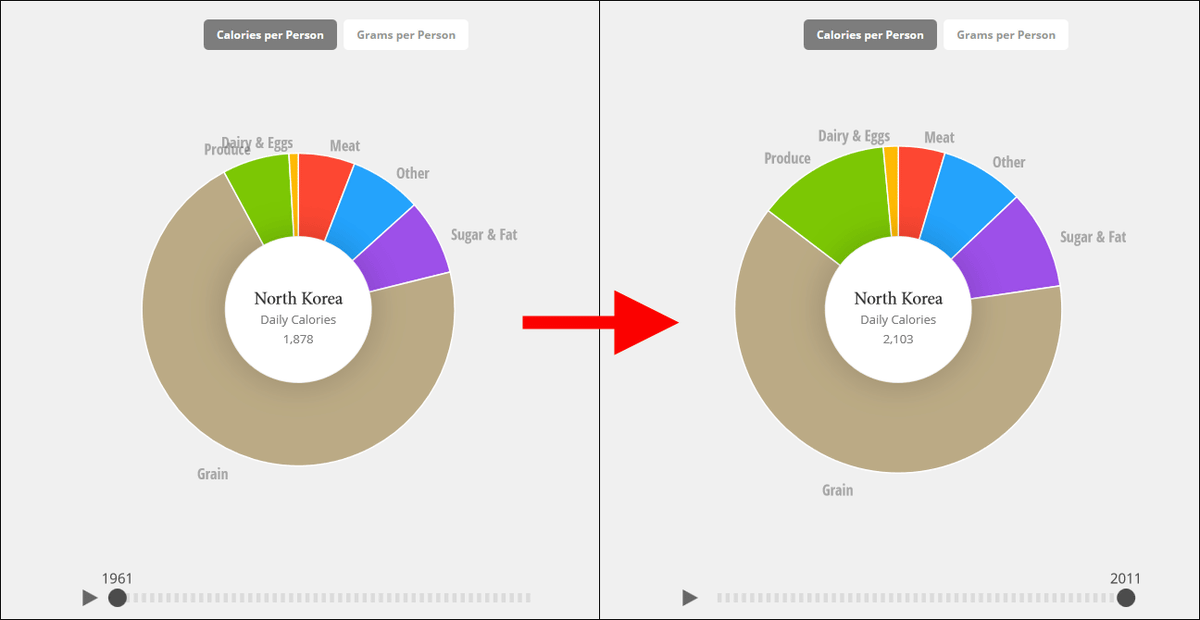
North Korea
The calorie intake of North Korea has remained almost unchanged from 1878 kcal to 2103 kcal in 50 years, and food has also been relied on grain for half a century.
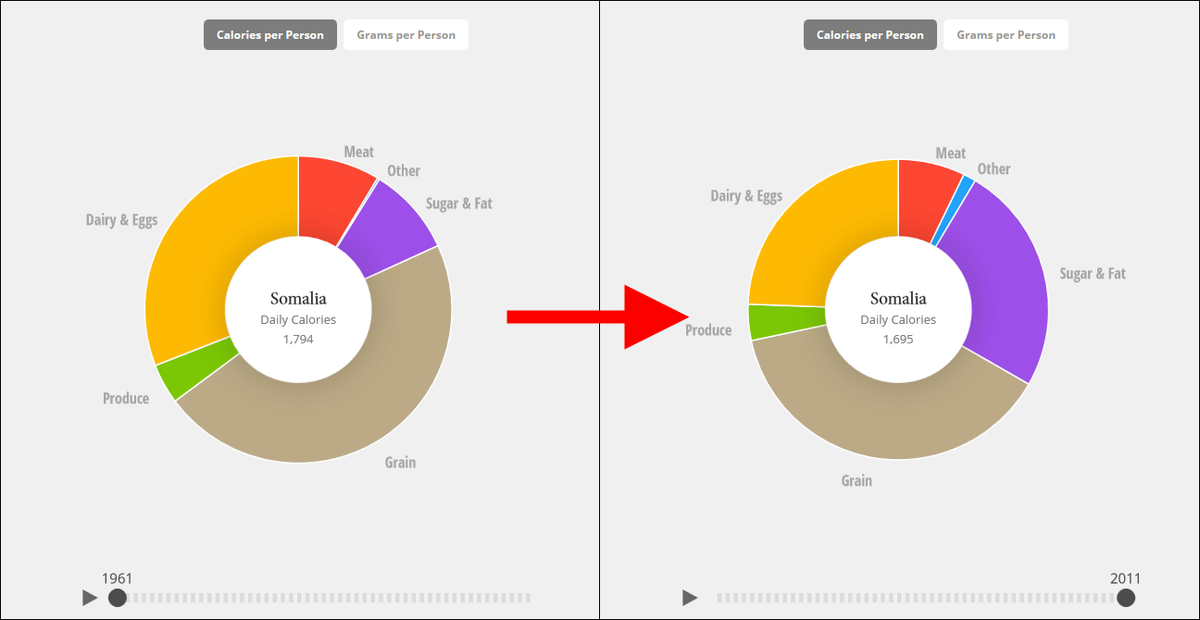
◆ Somalia
In Somalia where the civil war has continued, pirates and robbers will appearIt is necessary to hire a mercenary team of 4 to 6 people including sniper at the time of visa acquisitionIt is as dangerous as it is. From 5061 years after 1961, the calorie intake per day for the people has decreased to 1695 kcal, making it the country with the lowest calorie intake in the world. The main nutrient source of Somali people is milk.
◆ Japan
In 1961, about half of the food was occupied in Japan at that time in Japan, but the meat intake calories doubled by 2011, the proportion of sugar / fat also increased by 12 points from 15% to 27%. Dietary life changed drastically, but the calorie intake is characteristic that it does not change so much from 2523 kcal to 2717 kcal in 50 years.
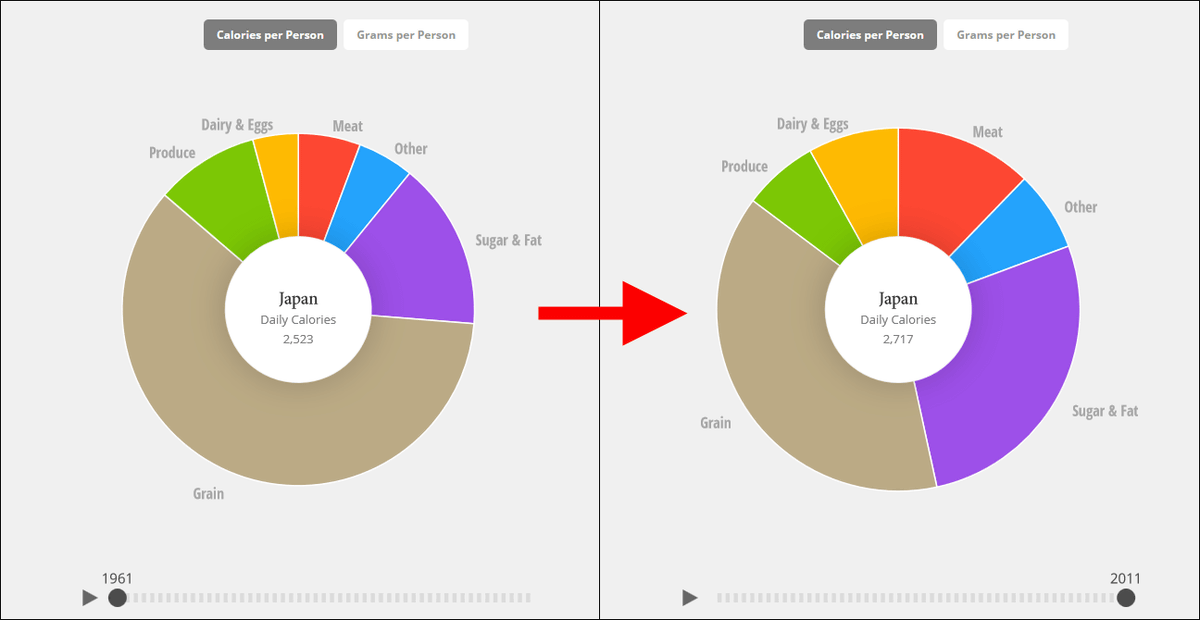
Also, although the calorie intake of dairy products and eggs is also increasing, the amount of eggs that Japanese eat is still less than one-third of average Americans.
Related Posts:


in Web Service, Food, Posted by darkhorse_log