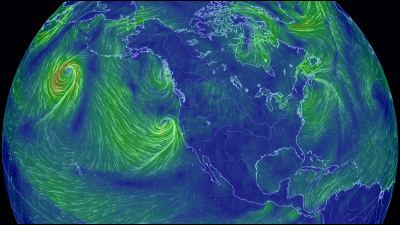
"Earth" that can animate the global airflow, temperature, sea surface temperature etc. on the map

The flow of the wind can not be seen with the eyes, and the movement of the ocean current whose scale is too large can not be felt any more. However, animation of air currents and ocean currents on the map "EarthYou can intuitively understand the dynamically changing air current / ocean current movement that is invisible and invisible on the global scale.
Earth :: an animated map of global wind, weather, and ocean conditions
http://earth.nullschool.net/
This is the top screen of the animation map "earth". It is overwhelmed by the suddenly appearing earth and the green line that moves with the waves in it, but I decide to translate it into Japanese for the time being. Click "earth" at the bottom left of the screen.

Click "Japanese" in the lower right corner of the window that appears

If the notation "earth" has changed to "Earth", it is Japanese.

Click on "Earth" again

The previous window is a screen for setting airflow, temperature etc. to display on animation or color gradation on the map.

In the default setting, "air current" in "ground" is displayed by animation, and the green layer expresses "wind speed" in color depth.

You can change the date and time displayed by clicking the arrow mark in "Operation".

In addition to the ground, you can check the movement of the wind every pressure (hPa). If it is 1,000 hPa it will show about 100 meters above sea level.

It is also possible to change the map projection. Click "E" ......

"Positive pyramid projectionThe map will change to.

"AE" and "Azimuthal azimuthal projection"

"CE" and "Canonical conic projection"

"S" and "Epic projection". If you click on the map, map information such as the position information of the point and the wind speed will be displayed at the lower left of the screen. To delete the map information, click "×" is OK.

If you click "Temperature" of "Layer" ...

The distribution of temperature is expressed in color. You can understand topographical trends such as high temperature around the equator and low inland temperature.

"Precipitable waterIt's like this. It seems that the area just under the equator is relatively wet.

"Feeling temperature" is like this. As Siberia is gray, the sensible temperature is below freezing.

You can also display ocean currents as well as airflow. Click "Sea"

It is not as strong as the airflow, but the ocean current well understands how it moves actively depending on the place.

Clicking "Sea Surface Temperature" ......

Sea surface temperature is displayed in color according to water temperature. The water temperature seems to be mostly determined by latitude.

The animation map "earth"Global Forecast SystemWeather forecast data ofOSCARIt is based on the current data of ocean current, you can intuitively understand the global air current and ocean current. Although I cut off one month to the center exam, it seems that it can be said that it is a very helpful net service for students who are "geography" subjects.
Related Posts:
in Web Service, Science, Posted by darkhorse_log


