'Watch_Dogs WeAreData' that can really monitor the data that moves the modern city in real time with a 3D map like SF
' Watch_Dogs WeAreData ' allows you to view information such as subway movements, mobile network conditions, surveillance camera positions, tweets,
Watch_Dogs WeAreData
http://wearedata.watchdogs.com/

First, let's look at London.

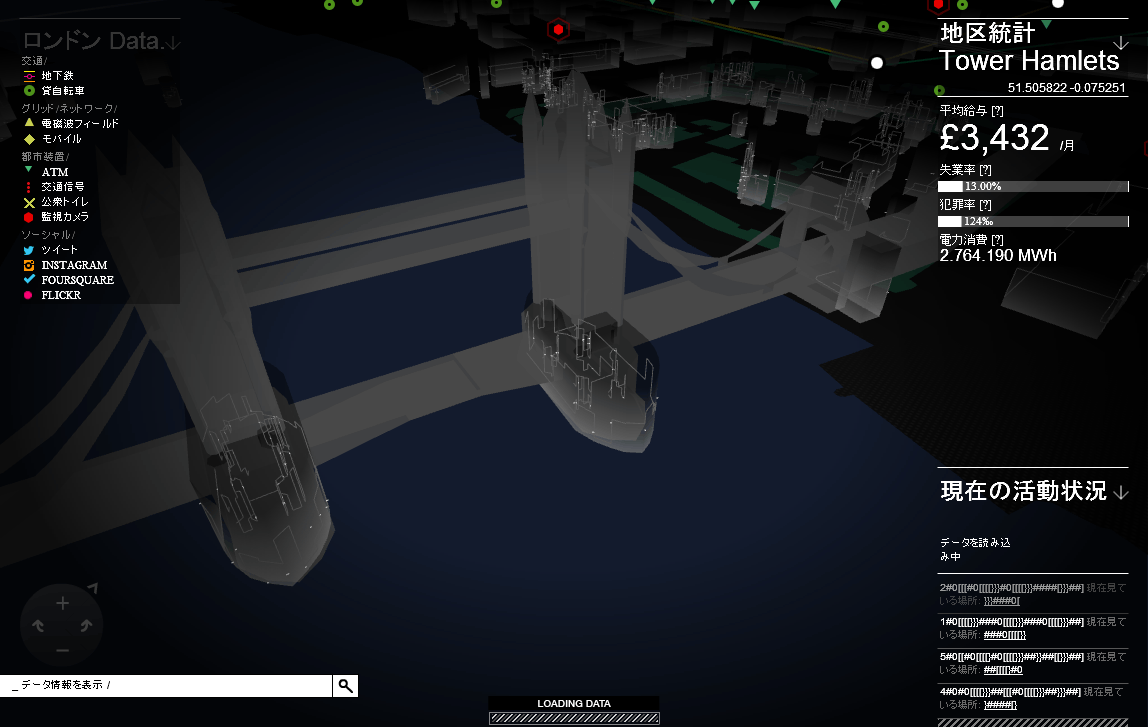
A map of London through the Thames is displayed.
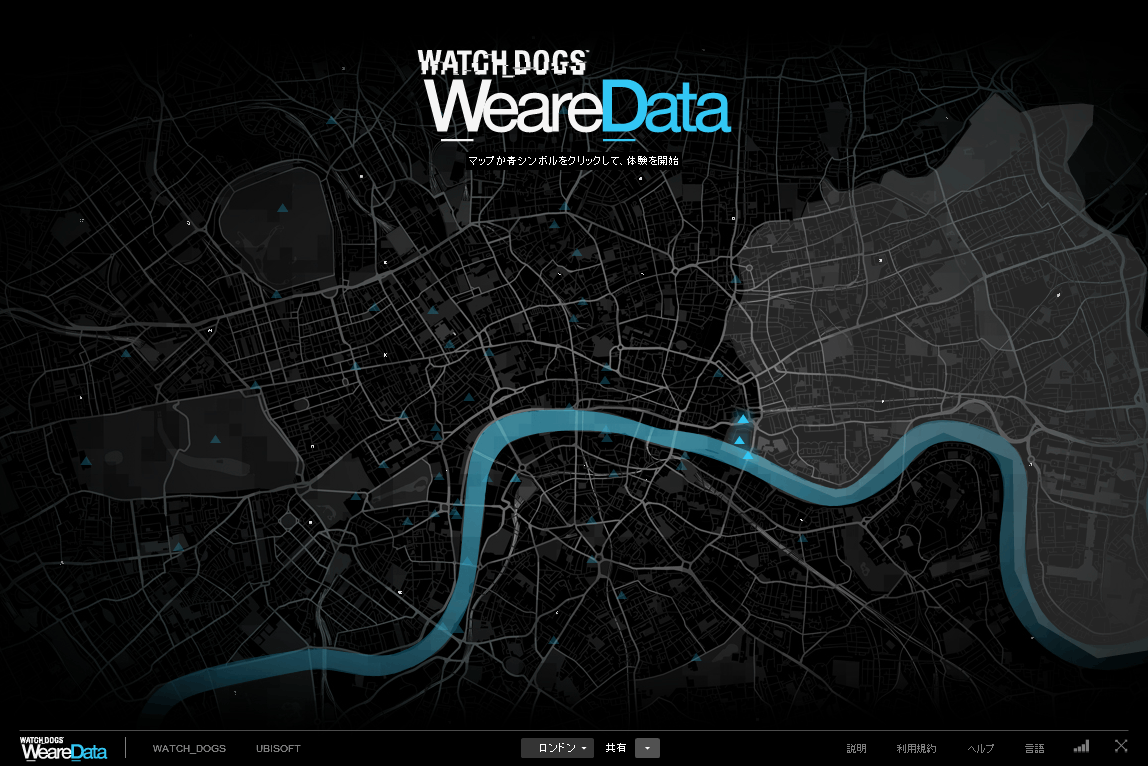
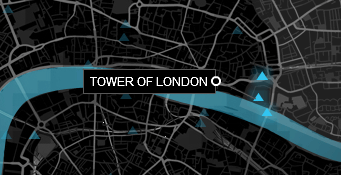
Click The Tower Of London ...
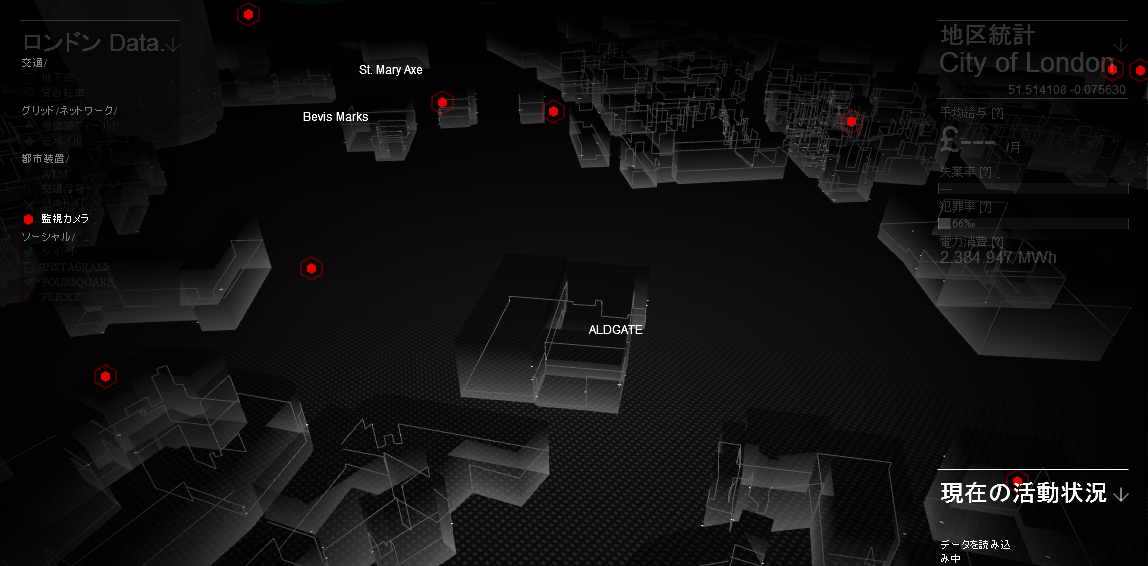
The area around the Tower of London was displayed.
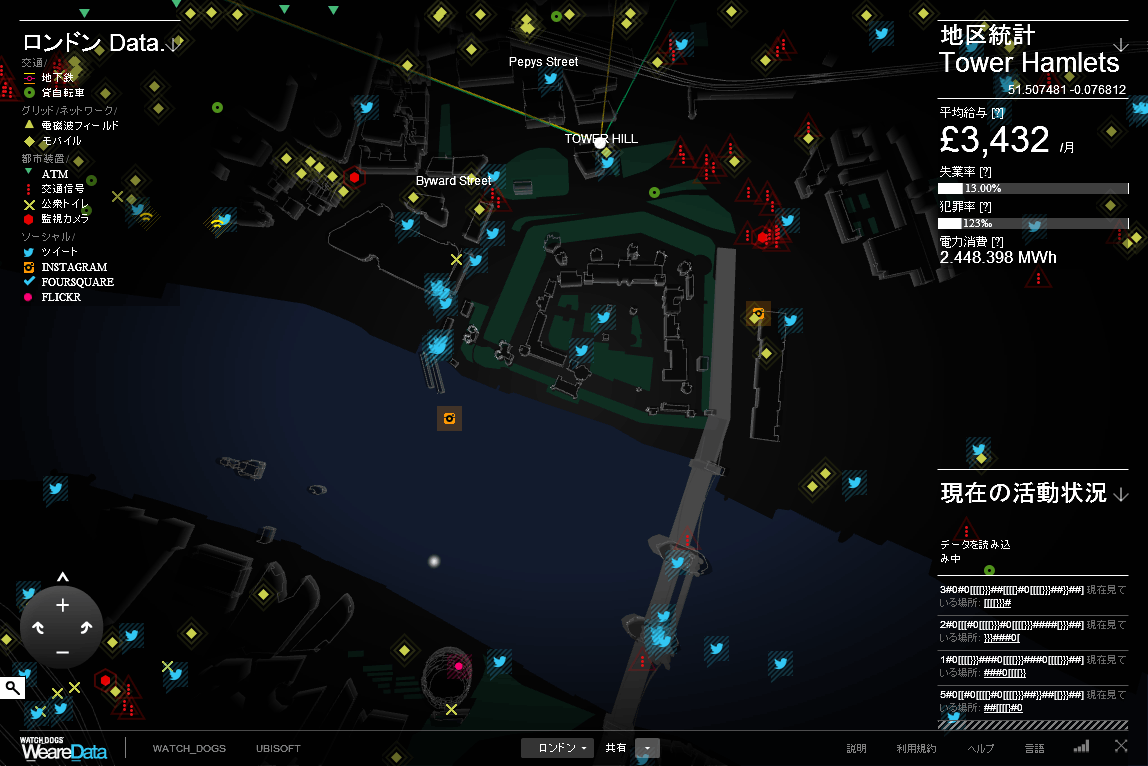
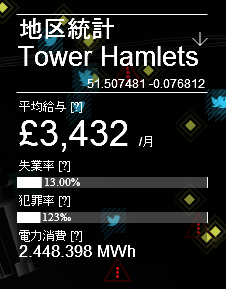
District statistics on the right of the screen. The average salary of the Tower Hamlets London Special Zone is £3,432, with an unemployment rate of 13%, a crime rate of 12.3% and an electricity consumption of about 2.4 million MWh.
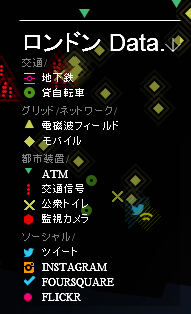
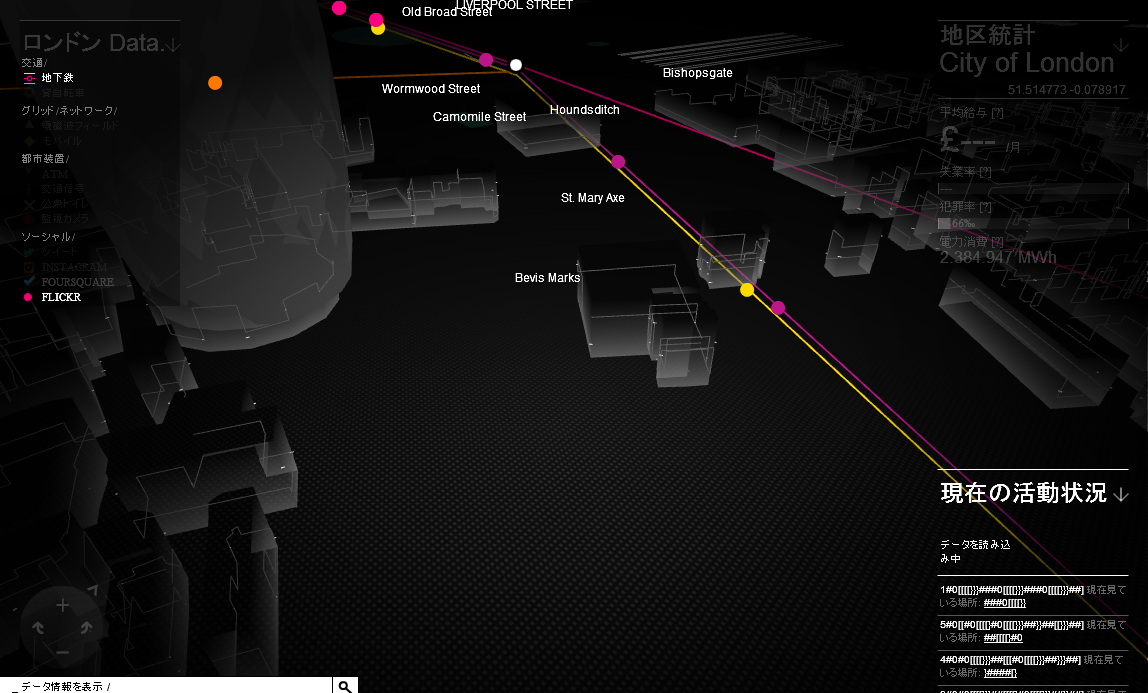
On the upper left of the screen is a list of explanations of the icons on the map. 'Transport' item is subway/bicycle rental, 'Grid/Network' is electromagnetic field/mobile, 'Urban device' is ATM/traffic signal/public toilet/surveillance camera, 'Social' is tweet/
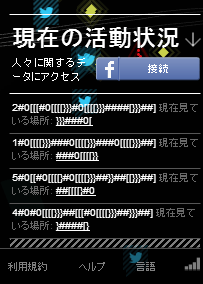
You can also connect to Facebook to see what others are seeing on your site in real time in your feed.
At the bottom left of the screen, there were buttons for zooming in, zooming out, direction change and search buttons.

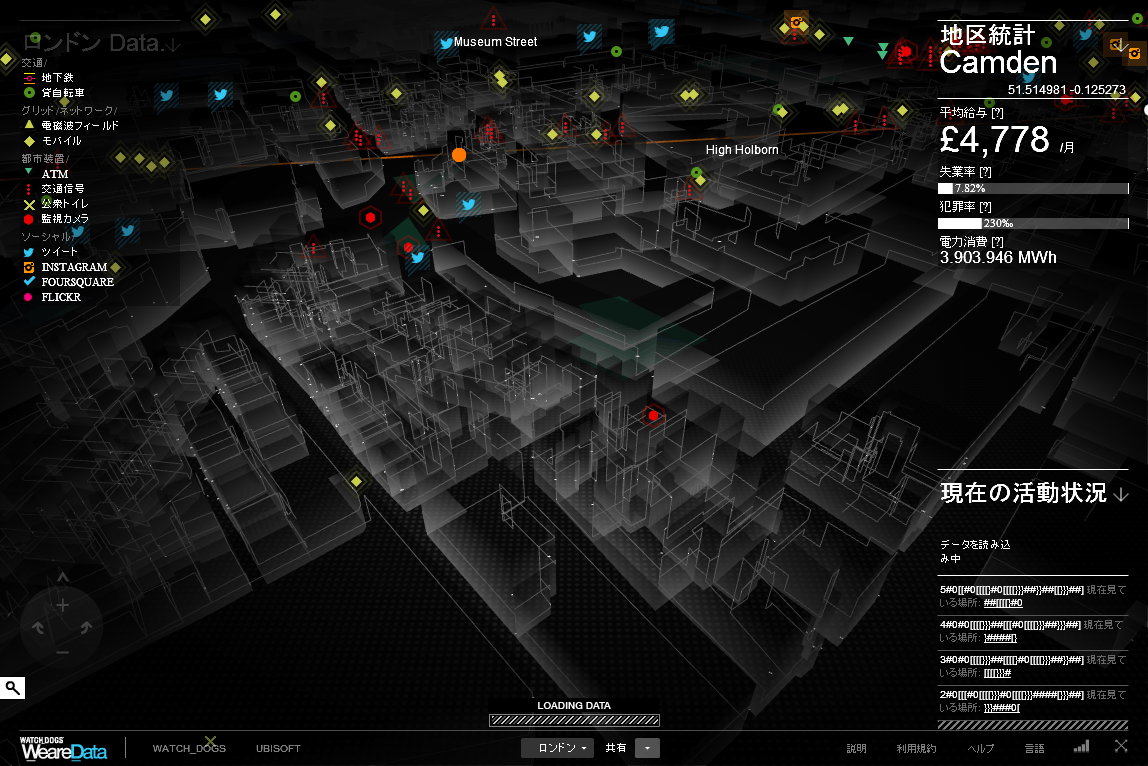
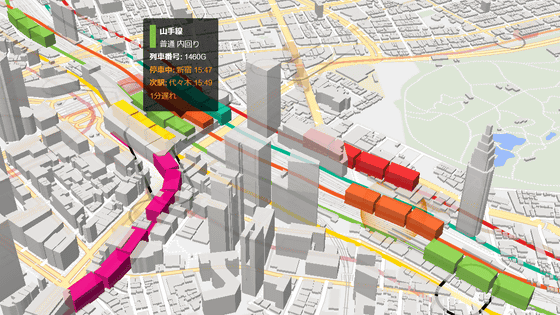
As you zoom in, you can see the city in 3D.
The Tower of London is also on this street.
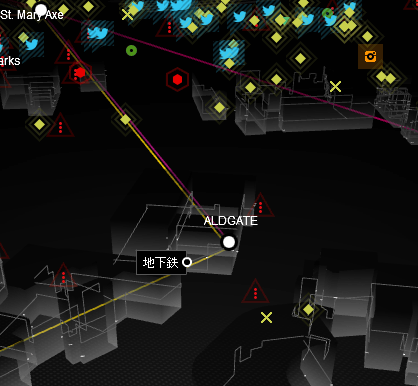
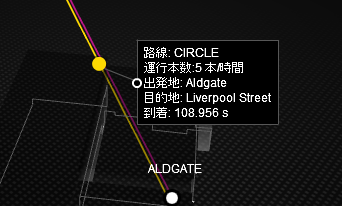
You can also check the subway line by line.
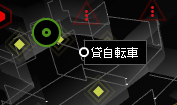
'Bicycle rental' as a means of transportation around town
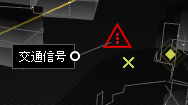
Traffic lights
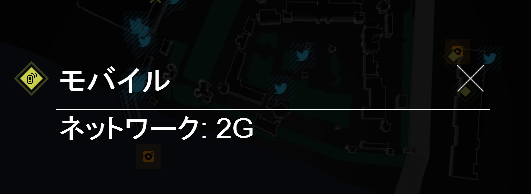
Click the mobile symbol...
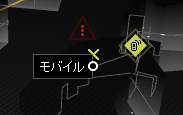
You can check the mobile network status of the location.
The train was able to confirm the movement in real time.
You can choose whether or not to display each icon on the screen, so you can check the current operation status by displaying only the subway.
There is also a surveillance camera icon...
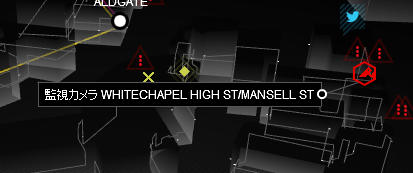
Make sure you understand how many surveillance cameras are installed in the city.
Tap the Instagram icon...
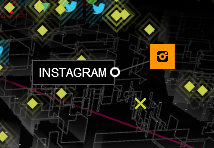
The uploaded photos will be displayed.

Tap the tweet icon.

The content of the tweet was also displayed.

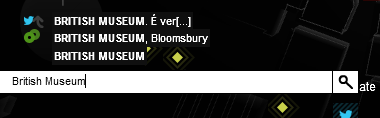
You can move it by moving the screen around, but there is a search field at the bottom left of the screen, so you can move it from here to any place you like.
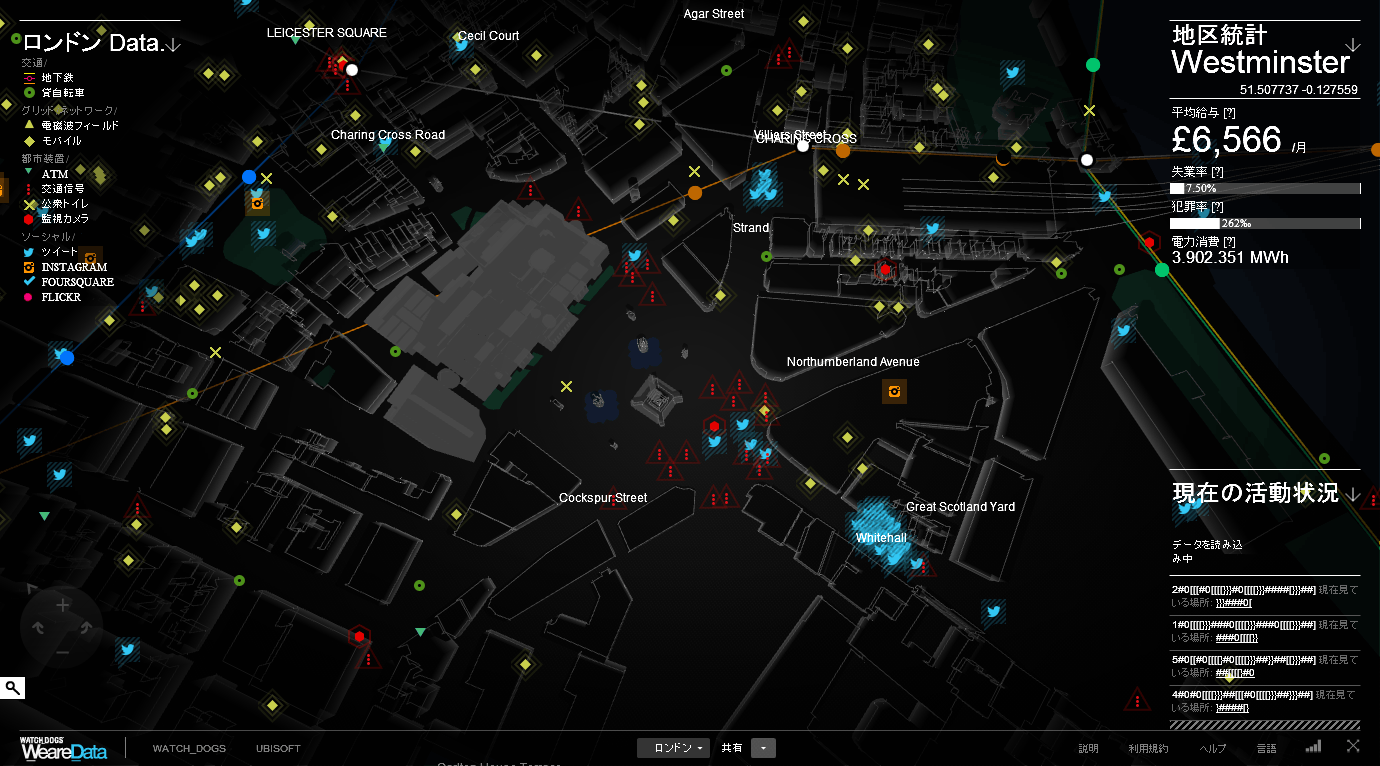
I moved to around
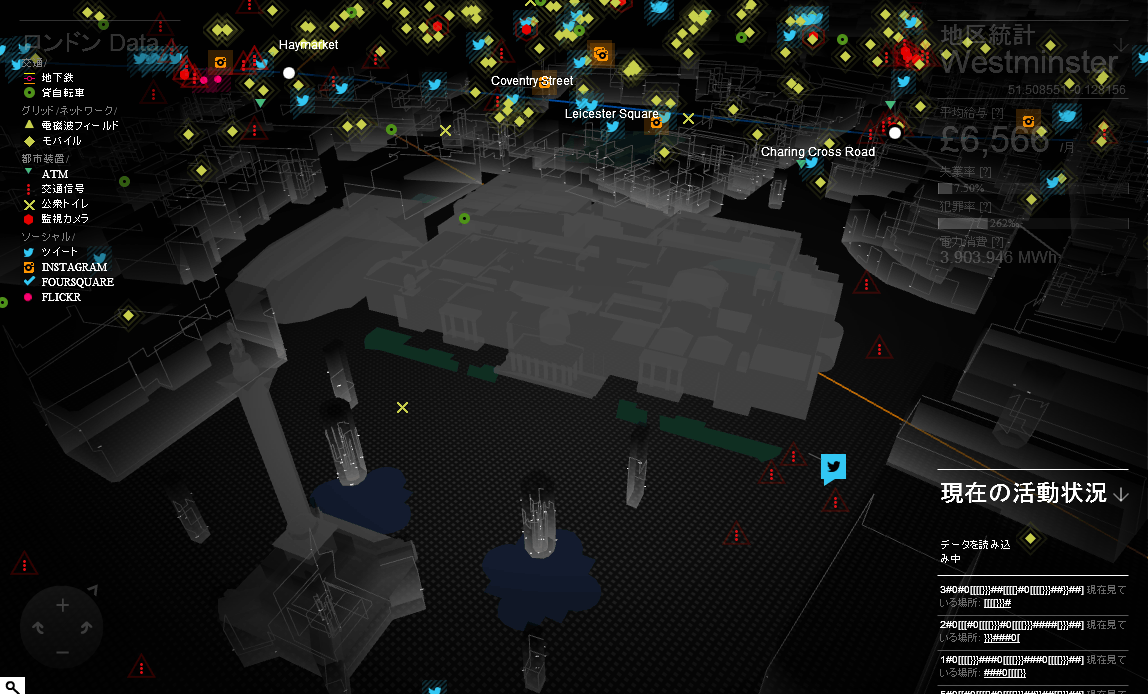
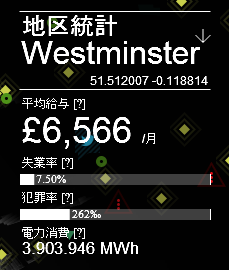
If you change the location, the district statistics will change. The average salary around Westminster is £6,566 per month, the unemployment rate is 7.5%, the crime rate is 26.2%, and the electricity consumption is 3.9 million MWh.
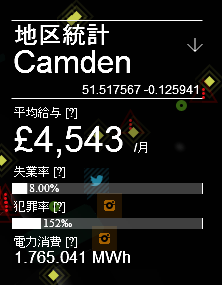
Camden London borough.
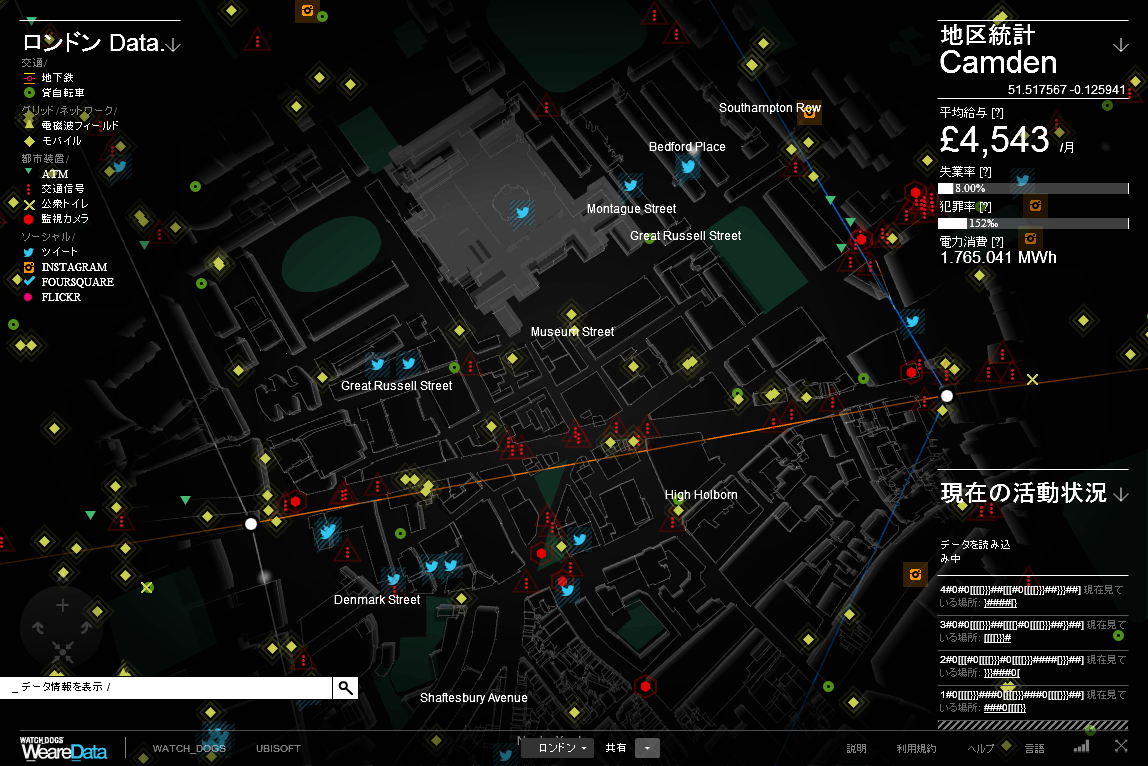
The average salary here was £4543, the unemployment rate was 8%, the crime rate was 15.2%, and the electricity consumption was 1.8 million MWh.
By the way, at the time of writing the article, in addition to London, Paris and...
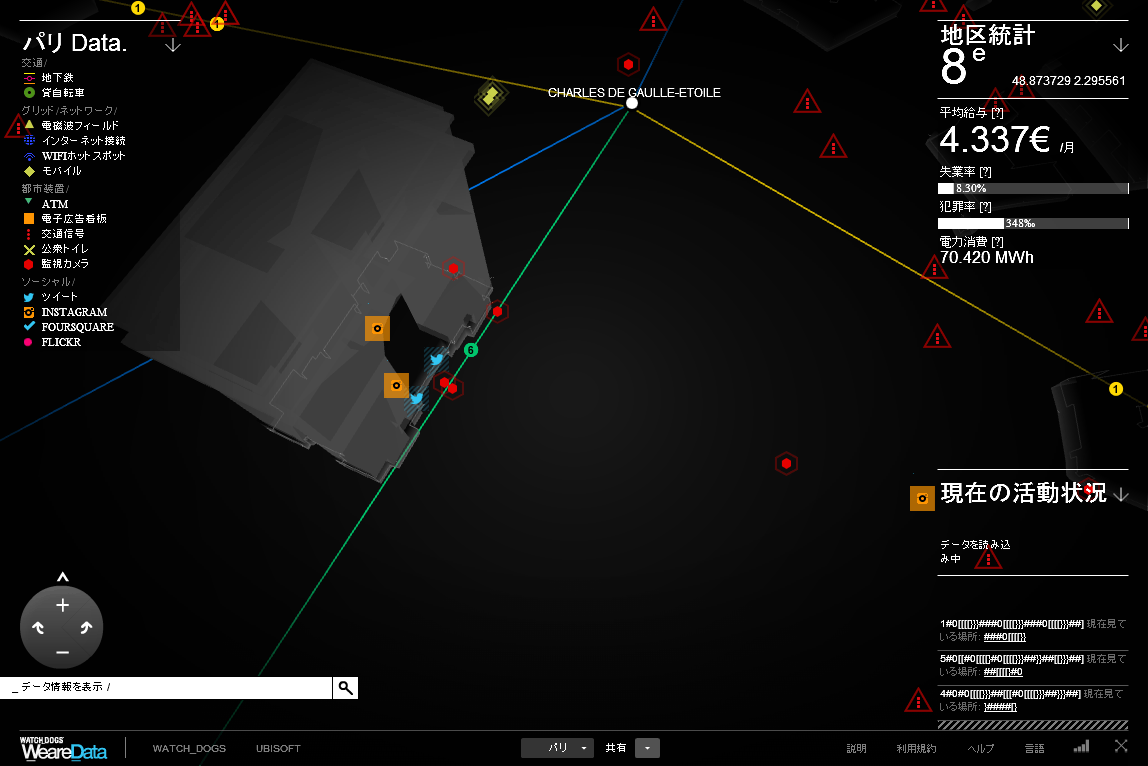
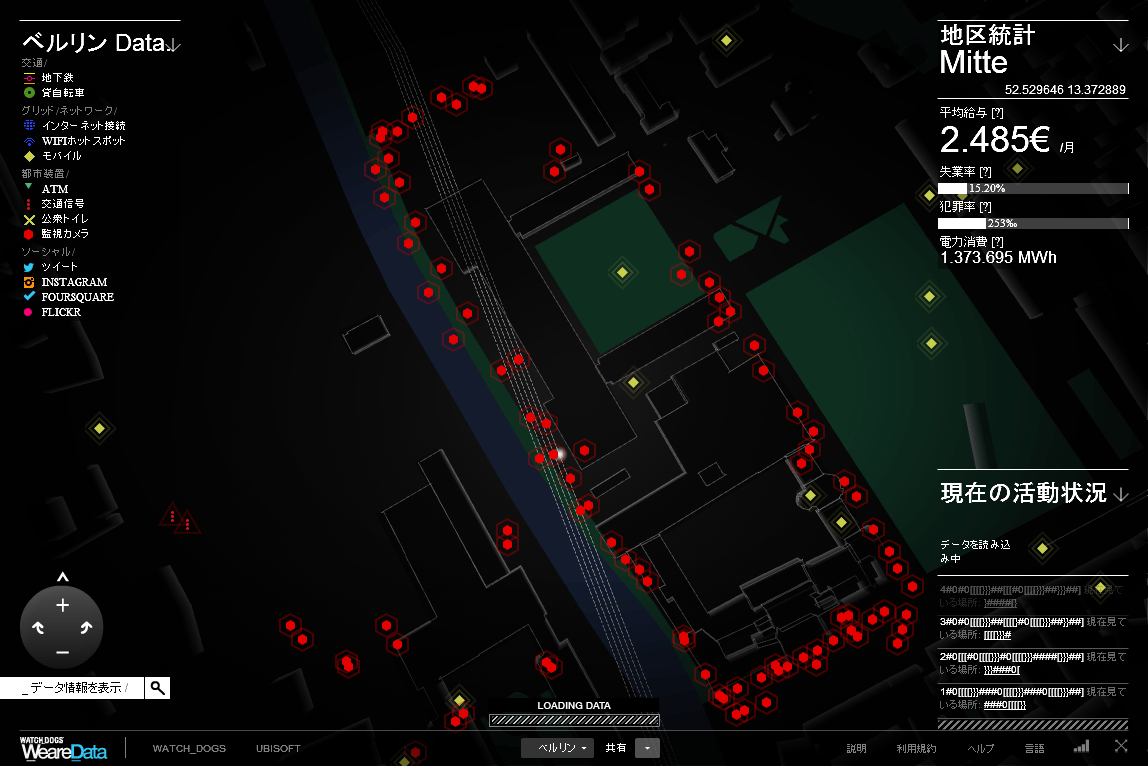
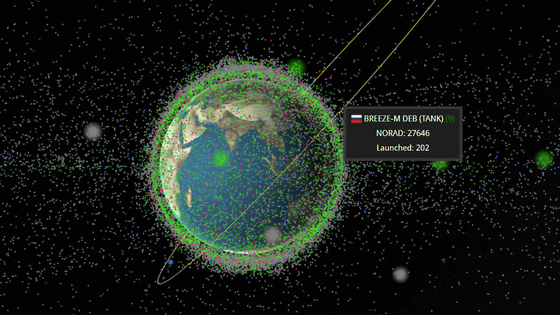
There is a 3D map of Berlin with mysterious buildings surrounded by surveillance cameras.
This is a promotion site for the game Watch Dogs . In the world of Watch Dogs, it is the central operation system (ctOS) that manages the entire city using data to move the city of Chicago, but this is no longer fiction, so the data of ParisLondon Berlin It is said that it was collected on the 3D map. All the data is open to the public, and only the data has been obtained from the information provider.
Related Posts:

in Web Service, Review, Game, Posted by darkhorse_log