The history of performance improvement and evolution in the past 40 years of unknown CPU
ByNera the photos
I am responsible for computer processingA CPU (Central Processing Unit)Has achieved the evolution of the monthly progress so far.VLSI Research Group of Stanford UniversityCompares and analyzes CPUs that appeared in the past 40 years from various angles to survey the history of CPU evolution. What is the actual state of "evolution of CPU" that can be seen from analysis data?
CPU DB: Recording Microprocessor History - ACM Queue

VLSI RESERCH GROUp - Stanford University
http://vlsiweb.stanford.edu/
CPU DBIs a database of CPUs compiled by the VLSI research group of Stanford University, and it is possible to retrieve all information on the CPU such as nominal specifications and benchmarks. It is designed with the philosophy that "Information on CPUs can be obtained easily and easily for everyone".
CPU DB - Looking At 40 Years of Processor Improvements | A complete database of processors for researchers and hobbyists alike.

When comparing the performance of CPU When a specification sheet (specification sheet) becomes the most important material, there are CPU manufacturers not already present in this world, so it is difficult to find a specification sheet as older CPUs, and original data to be analyzed It takes a lot of labor to collect. While fighting with the difficult problem of time, the VLSI research group collected data of 790 kinds of CPUs over the past 40 years in the CPU DB, and analyzed the improvement of the CPU performance from the different viewpoint from the data.
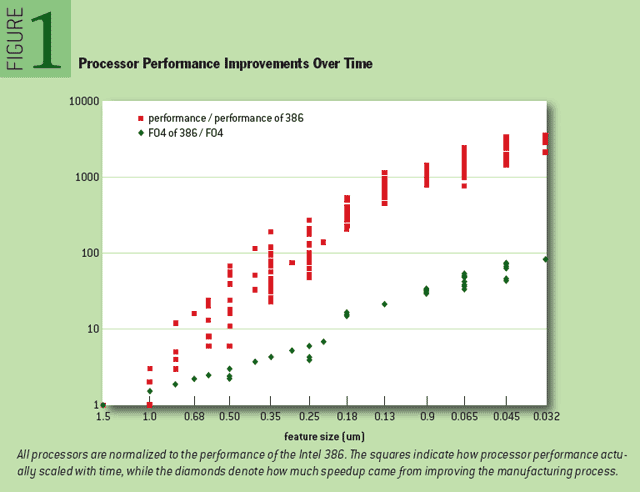
This is a graph showing how much the CPU performance has improved. The standard of performance is "Intel 80386"is. The red plot shows the performance improvement with the passage of time, the green plot shows the CPUProcess ruleIt shows performance improvement due to change. Here, it is necessary to keep in mind that the speed of performance improvement is astonishing, since the vertical axis is a logarithmic scale with one scale of 10 times.
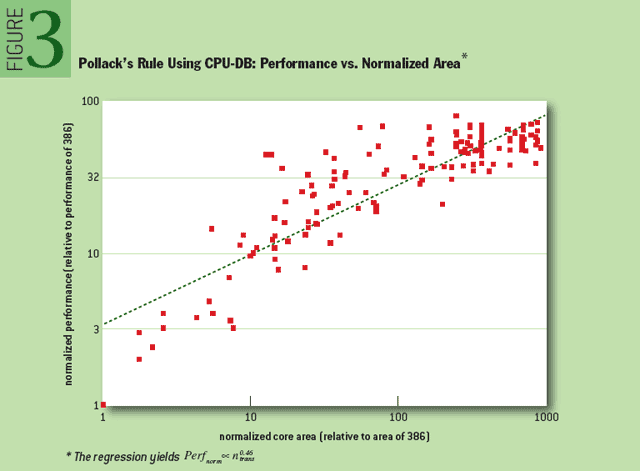
This is a graph showing the relation between the number of transistors and the performance. The green dashed line indicates "Polak's lawIt is the theoretical value of ", and it turns out that the plot generally follows the law of Polac.

This is a graph showing the relationship between CPU core size and performance. The green dashed line is the theoretical value of Polak's law. Here too, you can see performance improvement according to Polak's law.
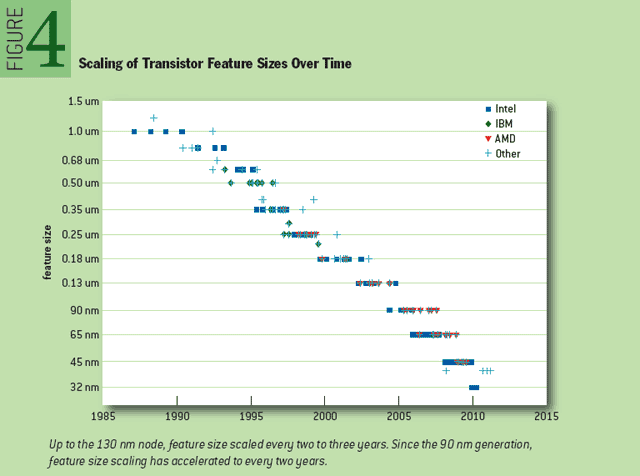
This is a graph showing the relationship between process rule and time. There are some variations depending on CPU makers such as Intel, IBM, AMD, but you can see that down sizing is done approximately every two years from around 90 nm cut. In addition, Intel has been running the beginning of process rule change since 180 nm.
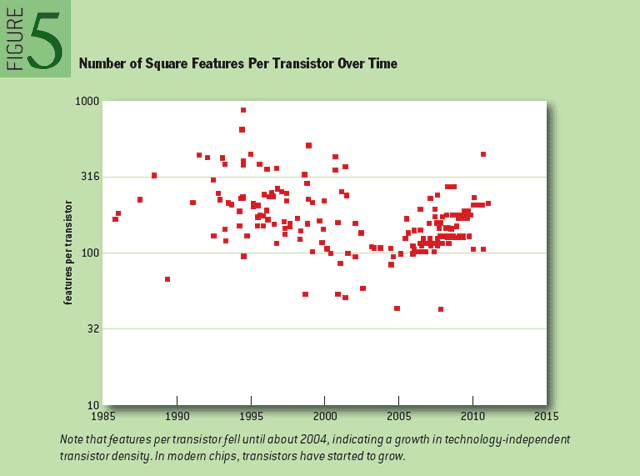
This is a graph showing the relationship between CPU die size and time. It was decreasing till 2004, but it has increased since 2005. This is CPUCache memoryBecause it incorporates functions such as.
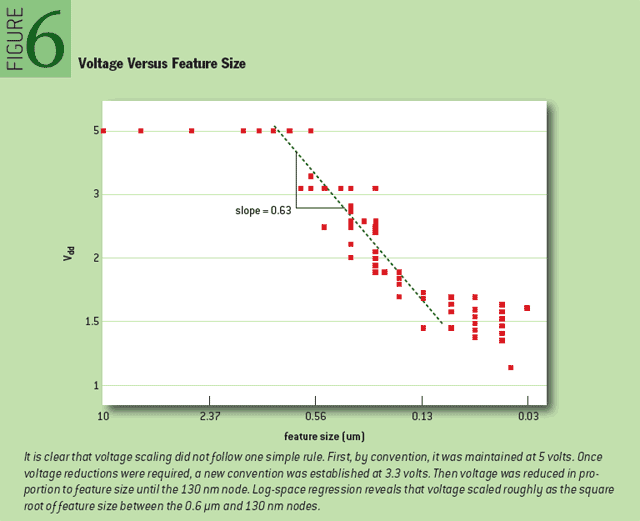
This is a graph showing the relationship between process rule and CPU core voltage. It has been moving at about 5 v until 560 nm, but after that it is moving at 3.3 v, and from around 130 nm the voltage drops. Recently it is distributed around 1.5V.
This is CPUClock frequencyAnd time. Although the frequency has risen steadily from 1985 to 2000, it has been sluggish since then, you can see that it has ceased at 3 GHz recently.

This is a graph showing the relation between heat quantity (thermal density) per time per square millimeter of CPU die and time. Compared with Intel 80386 in 1985, it has increased until around 2005,Pentium 4Has increased 16 times compared to 80386. In recent years, there is a problem of thermal runaway, CPU with lower thermal density is required and it is on a downward trend.

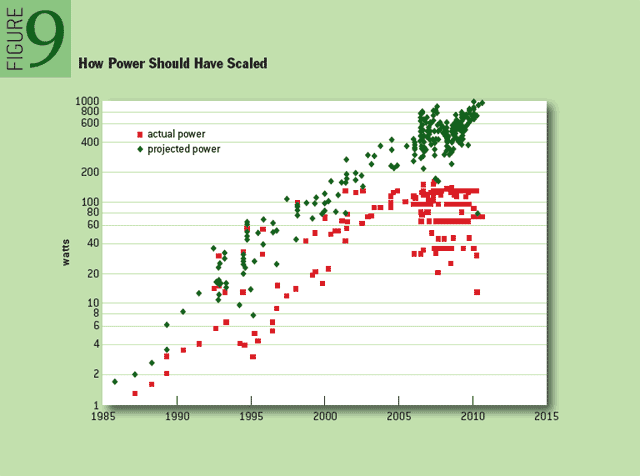
This is a graph showing the relation between power consumption and time. The red plot is the actual power consumption. On the other hand, the green plot shows that 386architectureThe assumed power consumption of how much power consumption will be the case. Thanks to the control function of the clock frequency and CPU core voltage, we can see that the power consumption is greatly reduced compared to the 386 architecture.
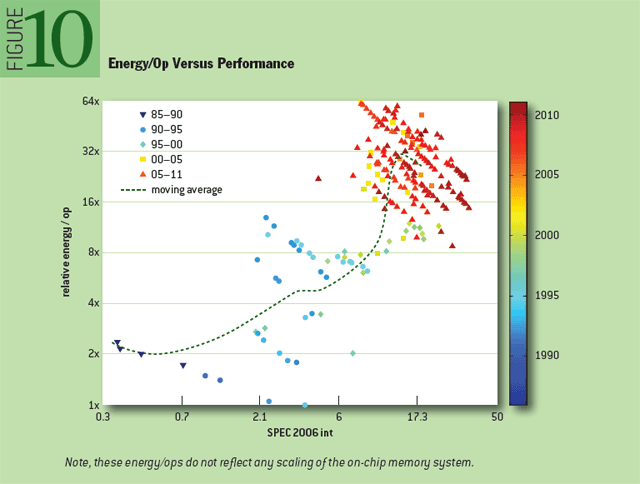
This is a graph showing the improvement of performance (energy efficiency) per power consumption. The CPU from 2005 to 2011 is plotted on the upper right of the graph, you can see that the performance is high and the energy efficiency is much better.
This is a graph showing the energy efficiency when the power loss of the cache memory is taken into account. Compared with the figure above, it can be seen that the power loss of the cache memory is decisive for a CPU with low power consumption.

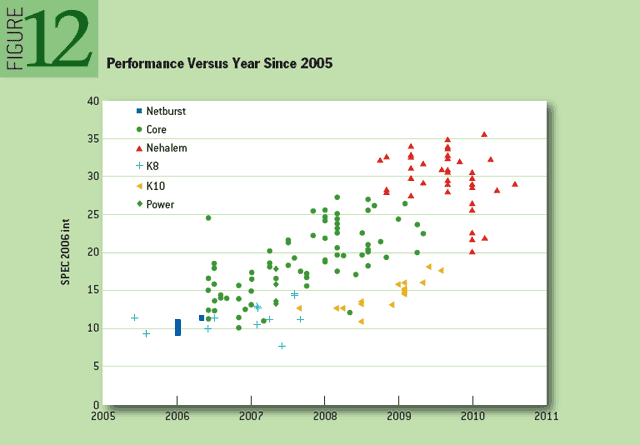
Graph showing the performance improvement of CPU after 2005. Core i series (Neharem architecture) Has higher performance than other CPUs.
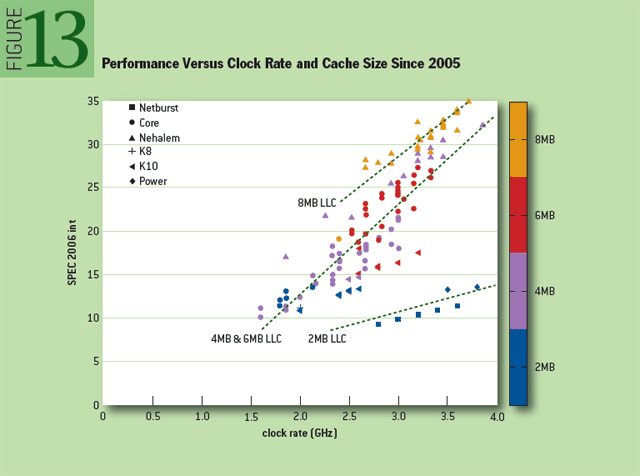
In recent years, the CPU has a large capacitycacheHas been installed. This is a graph showing the relationship between cache capacity, clock frequency and CPU performance. Of course, the one with the larger cache capacity is high performance.
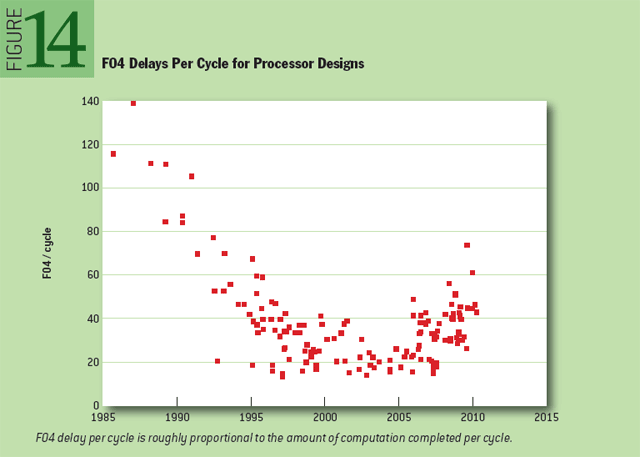
The VLSI research group devised a method called FO 4 that theoretically estimates the gate delay and the wiring delay which are factors that impede the performance improvement of the CPU. This graph is a graph showing the relationship between the amount of delay estimated from FO 4 and time. We can see that the delay has increased again since 2004.
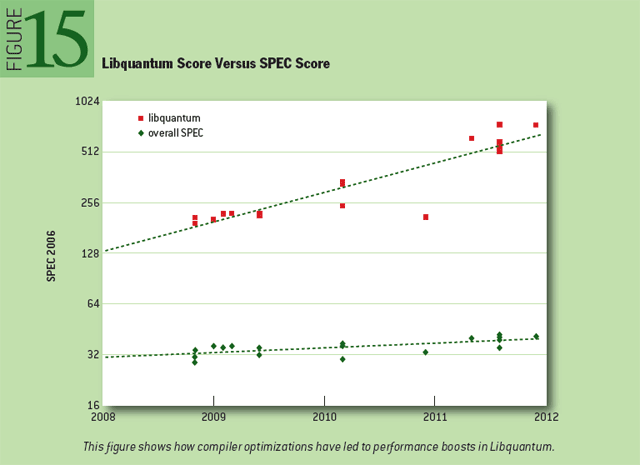
This is a graph showing the relationship between CPU performance and time in the case of combining and optimizing a number of computers called "Libquantum" so as to combine the performance improvement performance program and the computer simply connected. The result that Libquantum has higher performance suggests that there is room for improvement in performance per CPU's single core.
For 40 years, CPU designers have continued to introduce a tremendous amount of expertise. As a result, CPU performance has dramatically improved, and performance per power consumption has also improved. There is no doubt that this was the driving force behind building the IT infrastructure. The VLSI research group will continue to record the actual situation of the CPU performance improvement competition that is currently advancing in the CPU DB.
Related Posts: