JavaScript toolkit for drawing interactive time series graph "Rickshaw"
It is easy to use for graphing the data that you decided in advance or that changes every moment in real time. Moreover, as for some coloring which tends to get lost at the time of graph creation, since some pretty color palette comes from the beginning, it can be graphed without hesitation.
Rickshaw
http://shutterstock.github.com/rickshaw/
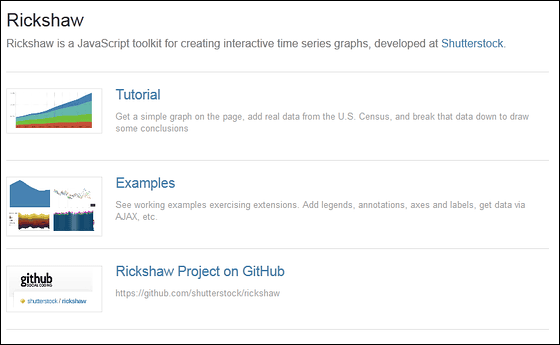
D3 libraryBased on 17.21 million royalty-free stock photosShutterstock"JavaScript Toolkit for graphs developed by the time series chart has become a framework, the following graphs can be created.
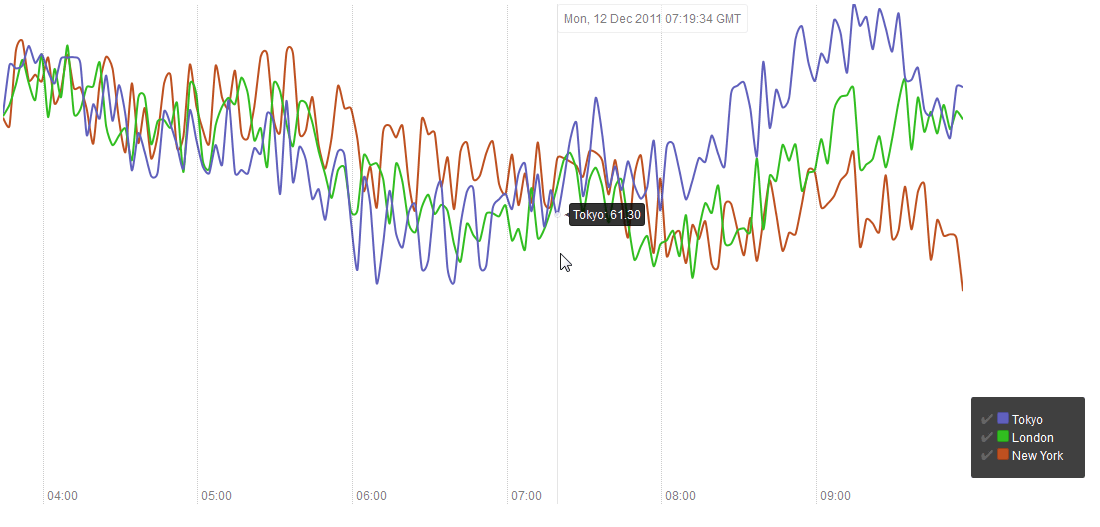
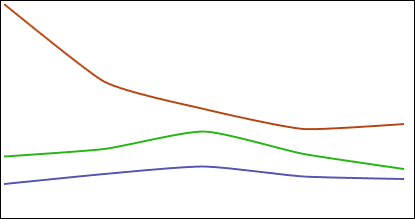
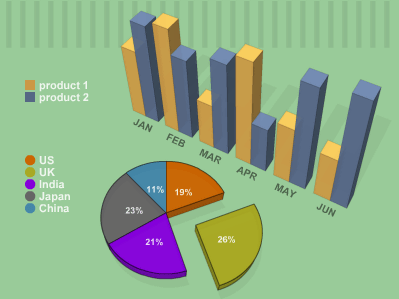
Normal graph
http://shutterstock.github.com/rickshaw/examples/start.html

Each graph can be turned on and off with a checkmark in the lower right, and when the mouse moves over the graph, the date and value are displayed floating like a tool tip.
http://shutterstock.github.com/rickshaw/examples/lines.html
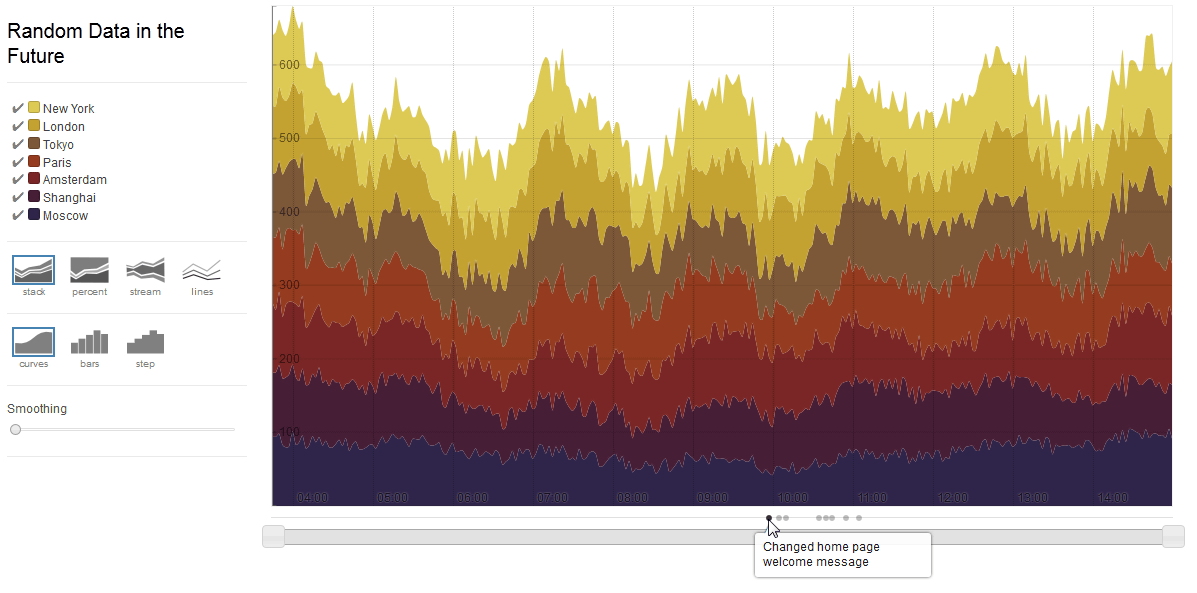
It is possible to install a graph that continues to be displayed while reading continuously changing data in real time, change of each graph and display method, smoothing, movement of the timeline, memo function of what happened on that date as well.
http://shutterstock.github.com/rickshaw/examples/extensions.html
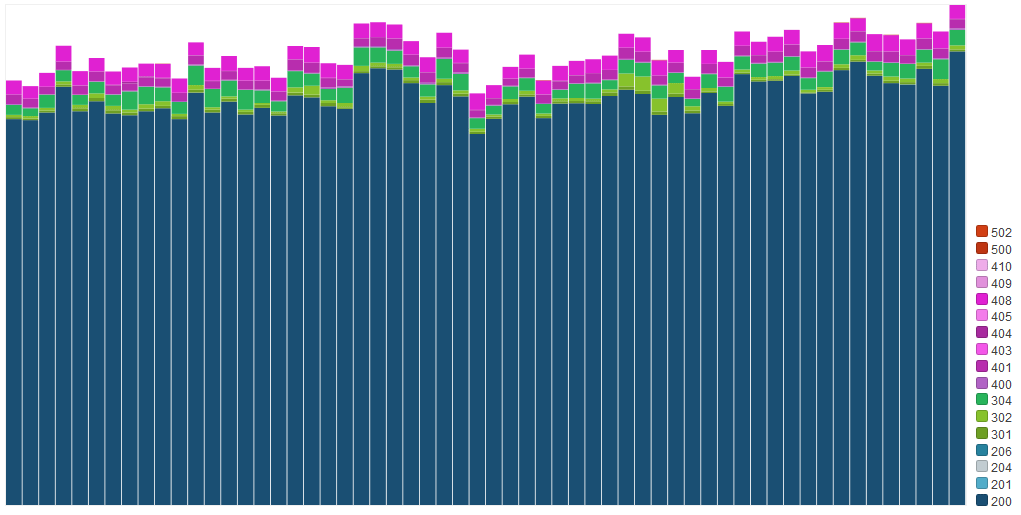
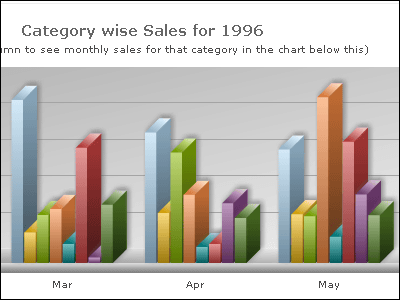
This is easy to create such a bar chart, which accumulated by aggregating the HTTP status code of the page
http://shutterstock.github.com/rickshaw/examples/status.html
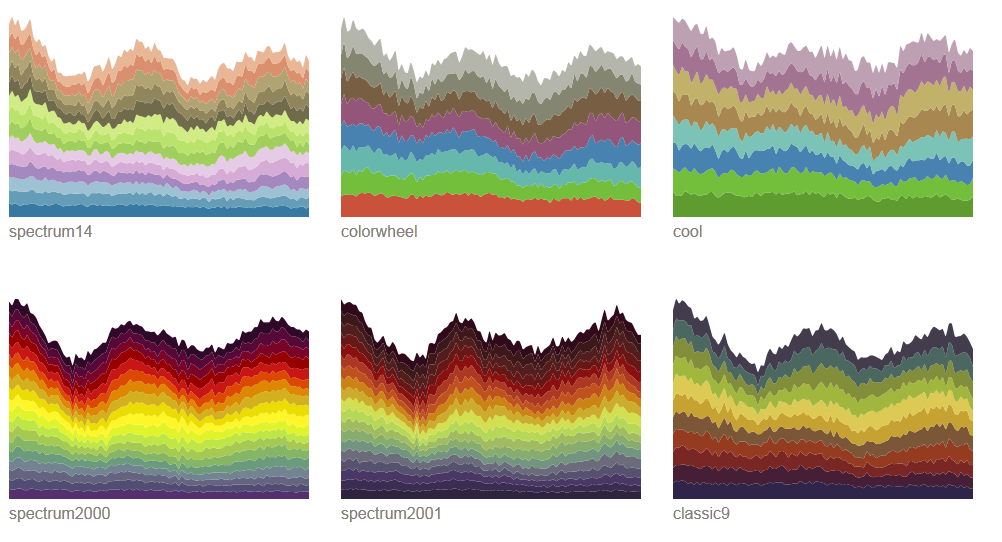
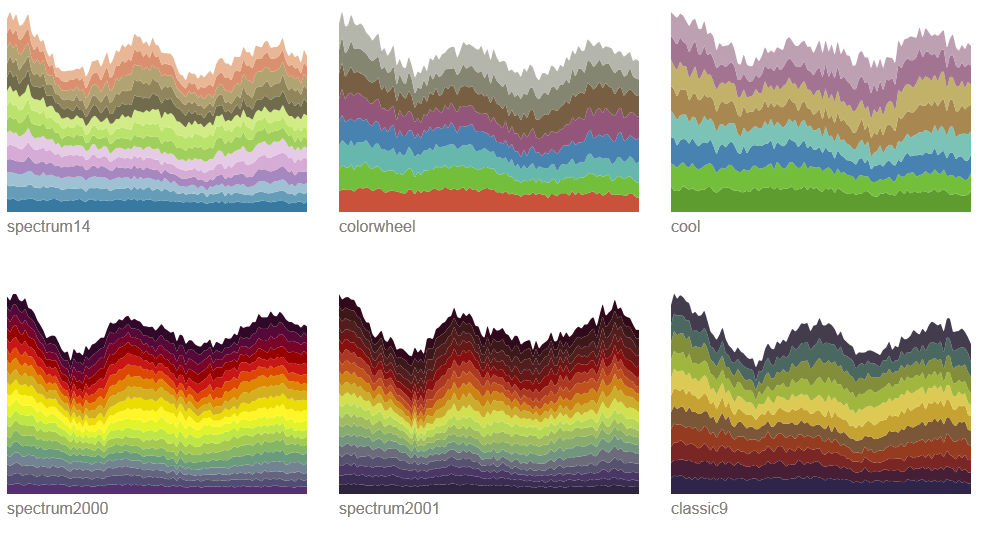
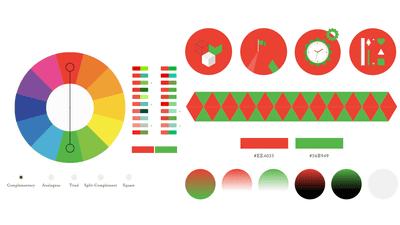
As well as being able to decide colors by themselves, of course, the following color palette is built in from the beginning, and it automatically adds color to the graph just by calling. It looks pretty useful.
http://shutterstock.github.com/rickshaw/examples/colors.html
It is also possible to get data via AJAX / JSONP
http://shutterstock.github.com/rickshaw/examples/ajax.html
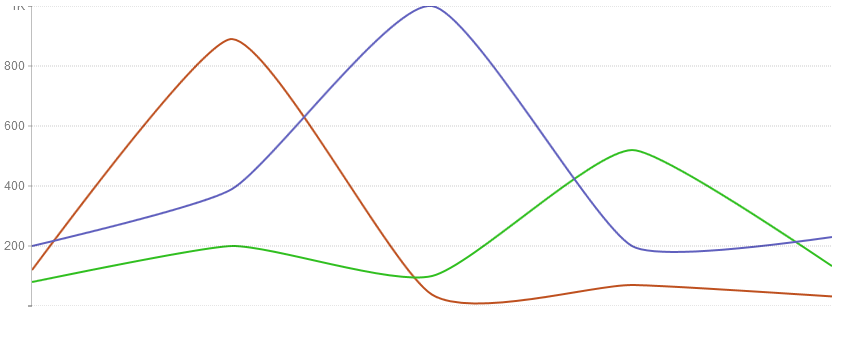
You can also tick marks on the Y axis and draw grid lines
http://shutterstock.github.com/rickshaw/examples/y_axis.html
A lot of cases are posted together with the code and it is very well done.
Related Posts:


in Web Service, Posted by darkhorse