A graph that shows at a glance how much growth has occurred each time Apple that continues to advance strongly delivers new products

Sales of the new type tablet terminal "iPad 2", which was released in the United States, are also strong, but the graph showing at a glance the amount of growth that the company has grown with each new product is released.
Especially the growth in recent years has become remarkable, and I am amazed by the magnitude of the impact that products such as iPhone and iPad gave to the company.
Details are as below.
Timeline of Apple Milestones and Key Product Launches | Graphic.is
According to this article, Apple sells about 15 million iPads in 2010, but analysts predict that this year's sales will be two to three times.
If expected, iPad will have at least 30 million units sold this year and will bring Apple sales of about 20 billion dollars (about 1.6 trillion yen) this year.
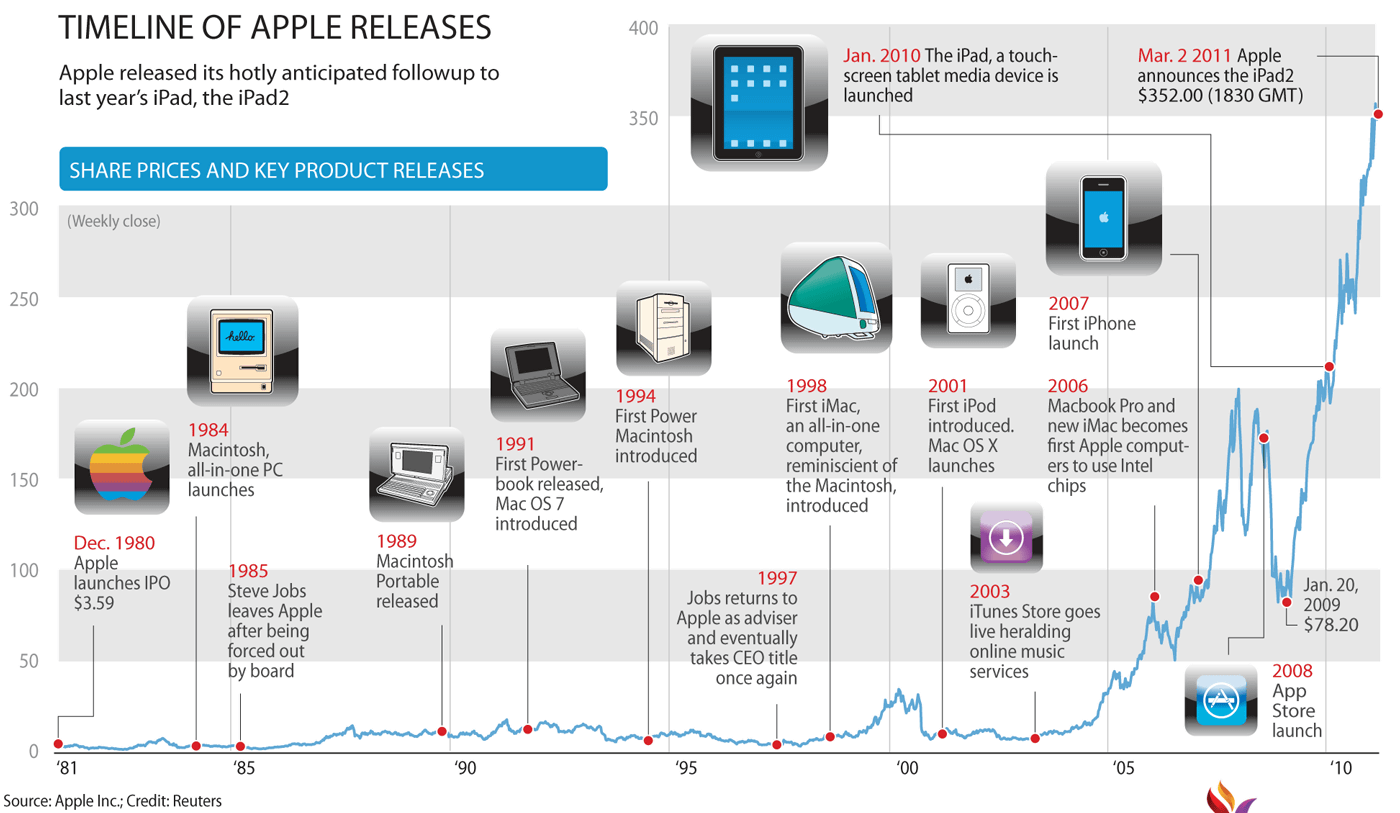
The graph that summarizes the trend of stock price from Apple's IPO (public offering) and the release date of new products is like this. In 1980, the stock price which was 3.59 dollars reached 352 dollars about 100 times on March 2, 2011. Especially the growth after 2005 is remarkable, and you can see clearly that new products such as Mac with Intel CPU, first iPhone, iPad etc. have a huge impact.
By January of this year I will release the iPhone compatible with CDMA 2000, will also incorporate subscribers to the largest cell phone company Verizon in the United States, and furthermore as we expect to release the new iPhone in June as usual, As Apple is still seen, it is not likely to keep an eye on future trends.
Related Posts:


in Note, Posted by darkhorse_log