Line graphs and area graphs can be made with "amCharts" to create beautiful pie charts with Flash

Flash expertise is unnecessary, you can complete data by simply writing the data you want to graph in the configuration file, you can specify various kinds of graphs and how to show them ""AmCharts" to make beautiful pie charts and pie charts free in FlashAlthough it seems that there were a lot of users very much, "version amCharts" which can create line graphs and area graphs at last finally appeared. I can actually see examples from the site, but this time it seems to be quite practical. Ideal for those who would like to make a nice looking graph.
Details are as follows.
AmCharts: customizable flash Line & area chart
http://www.amcharts.com/line/
Download is possible from the following.
DOWNLOAD LINE & AREA CHART
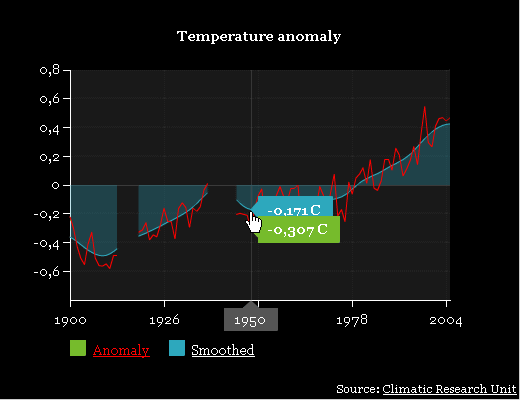
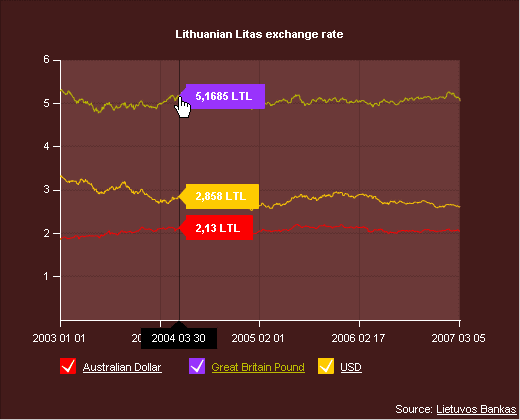
Example 1: Two types of line graph. It is also possible to take a link to the data citation source site etc.
In addition to simply displaying it, there is a check box for each graph, and if you uncheck it you can hide that graph.

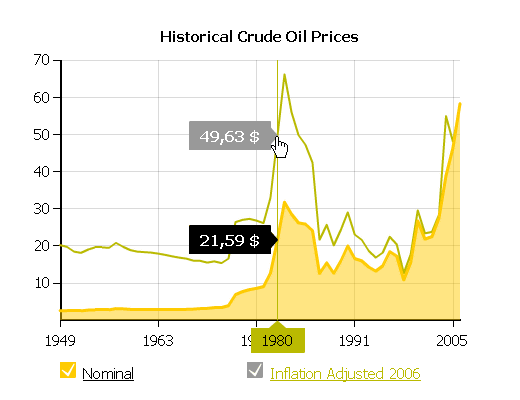
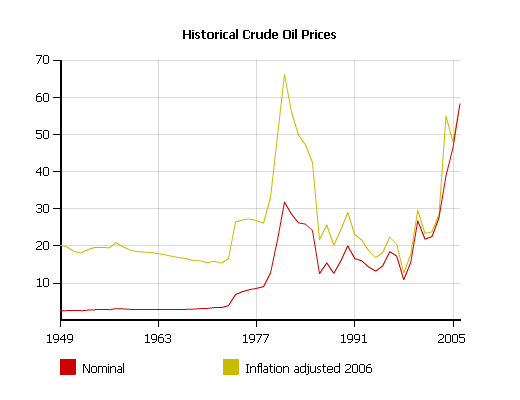
Example 2: Combination with area graph. The amount of change over time can be emphasized.
Also, when you designate the range by dragging like this with the mouse ......
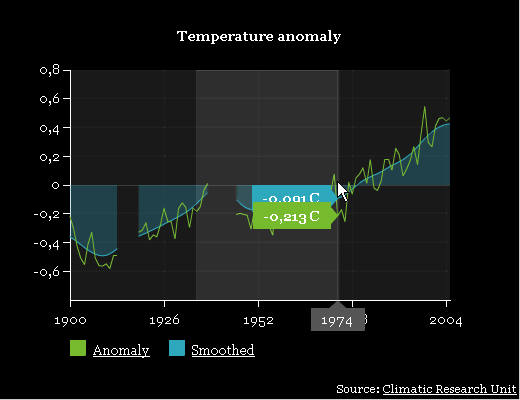
The selection range is enlarged. Click "Show all" to return to full view again.

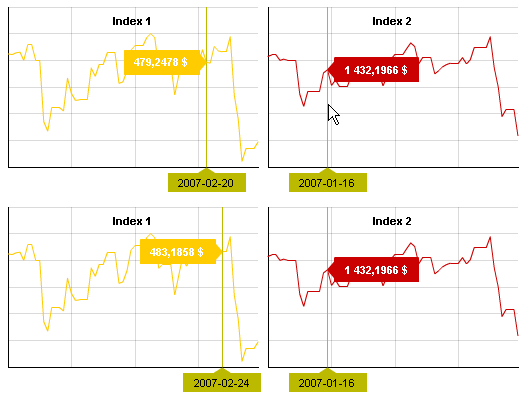
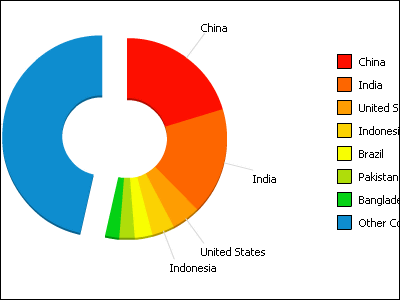
Example 3: It is also possible to display the same graph by changing the size only at the same time
Example 4: When trying to display multiple graphs
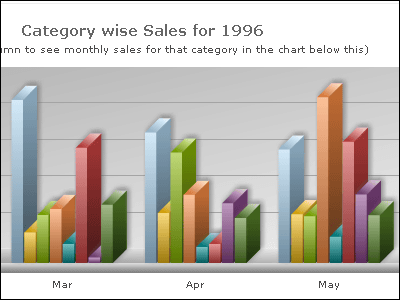
Example 5: Typical line graph
Example 6: Simple graph. It is possible to simply turn off all interactive functions and simply display them.
Although it is available for free this time, it seems that a logo with a link to this site will be included in the free version. Purchase of a paid version is possible when the logo is unpleasant, the paid version is single site license (75 euro, about 11 thousand yen), enterprise license (245 euro, about 38 thousand yen) .
Related Posts:


in Web Service, Posted by darkhorse