A report on Claude's usage patterns has been released, revealing findings such as 'AI is used more for personal purposes on weekends,' 'Women tend to use it for longer periods,' and 'High-paying tasks are often run at night.'
Anthropic collects and analyzes usage data from its proprietary AI services while respecting user privacy. On June 26, 2026, a usage report was released that included usage via Claude Code and APIs.
Anthropic Economic Index report: Cadences \ Anthropic
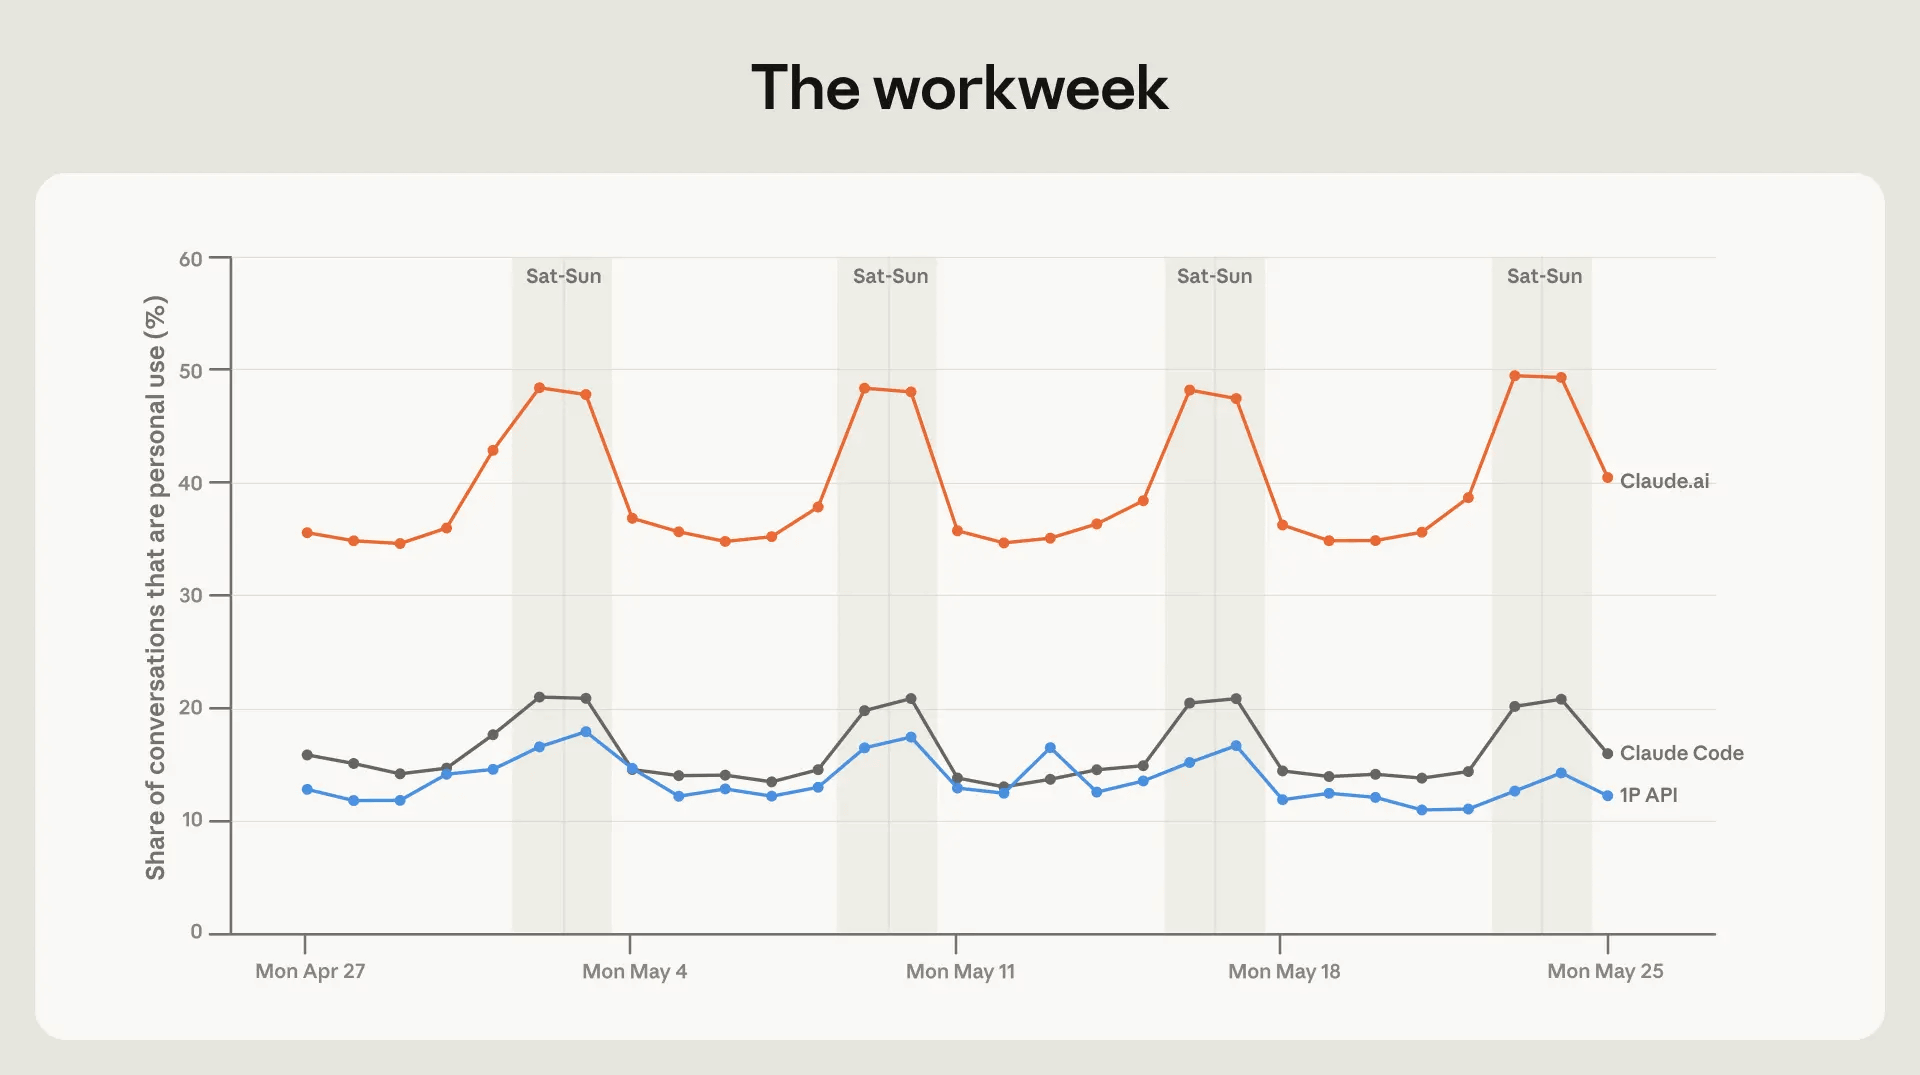
The graph below records the daily percentage of personal use for 'Claude.ai (Claude's chat service),' 'Claude Code,' and 'Anthropic's API.' It shows that Claude.ai has a higher percentage of personal use compared to Claude Code and the API, and that personal use increases on weekends for all usage methods.
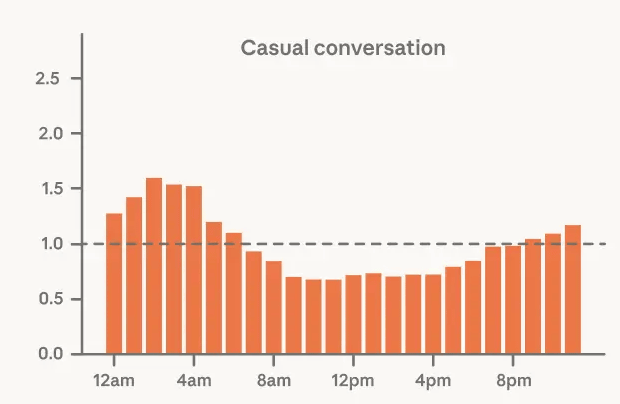
This report also includes a detailed breakdown of usage patterns by time of day for each conversation category. The graph below shows how often 'Claude' is used in everyday conversation, with the horizontal axis representing time and the vertical axis representing the ratio to the average. It can be seen that everyday conversation increases from night to morning and decreases during the day.
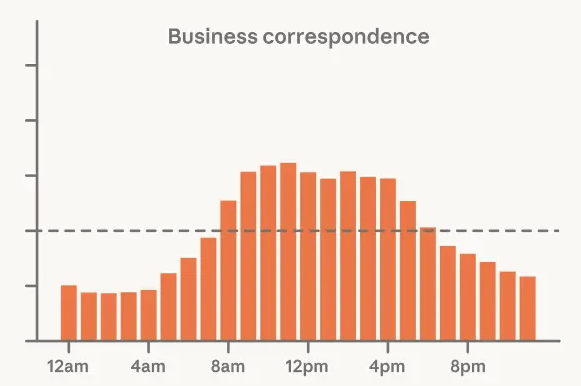
Conversely, business use increases during the daytime.
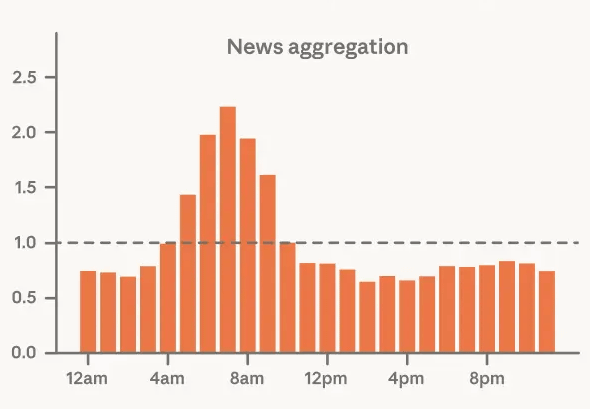
Conversations about the news increase in the morning.
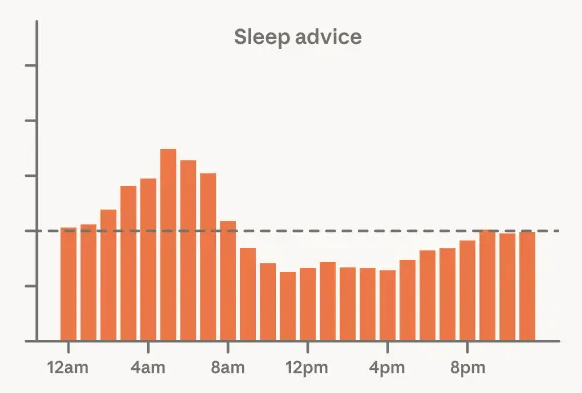
Requests for sleep-related advice increase from around midnight, peaking at 5 AM.
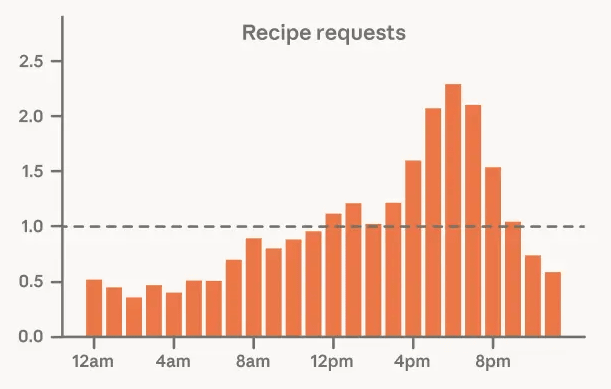
Conversations about cooking recipes peak at 6 PM. Dinner recipes appear to be used more frequently than breakfast or lunch recipes.
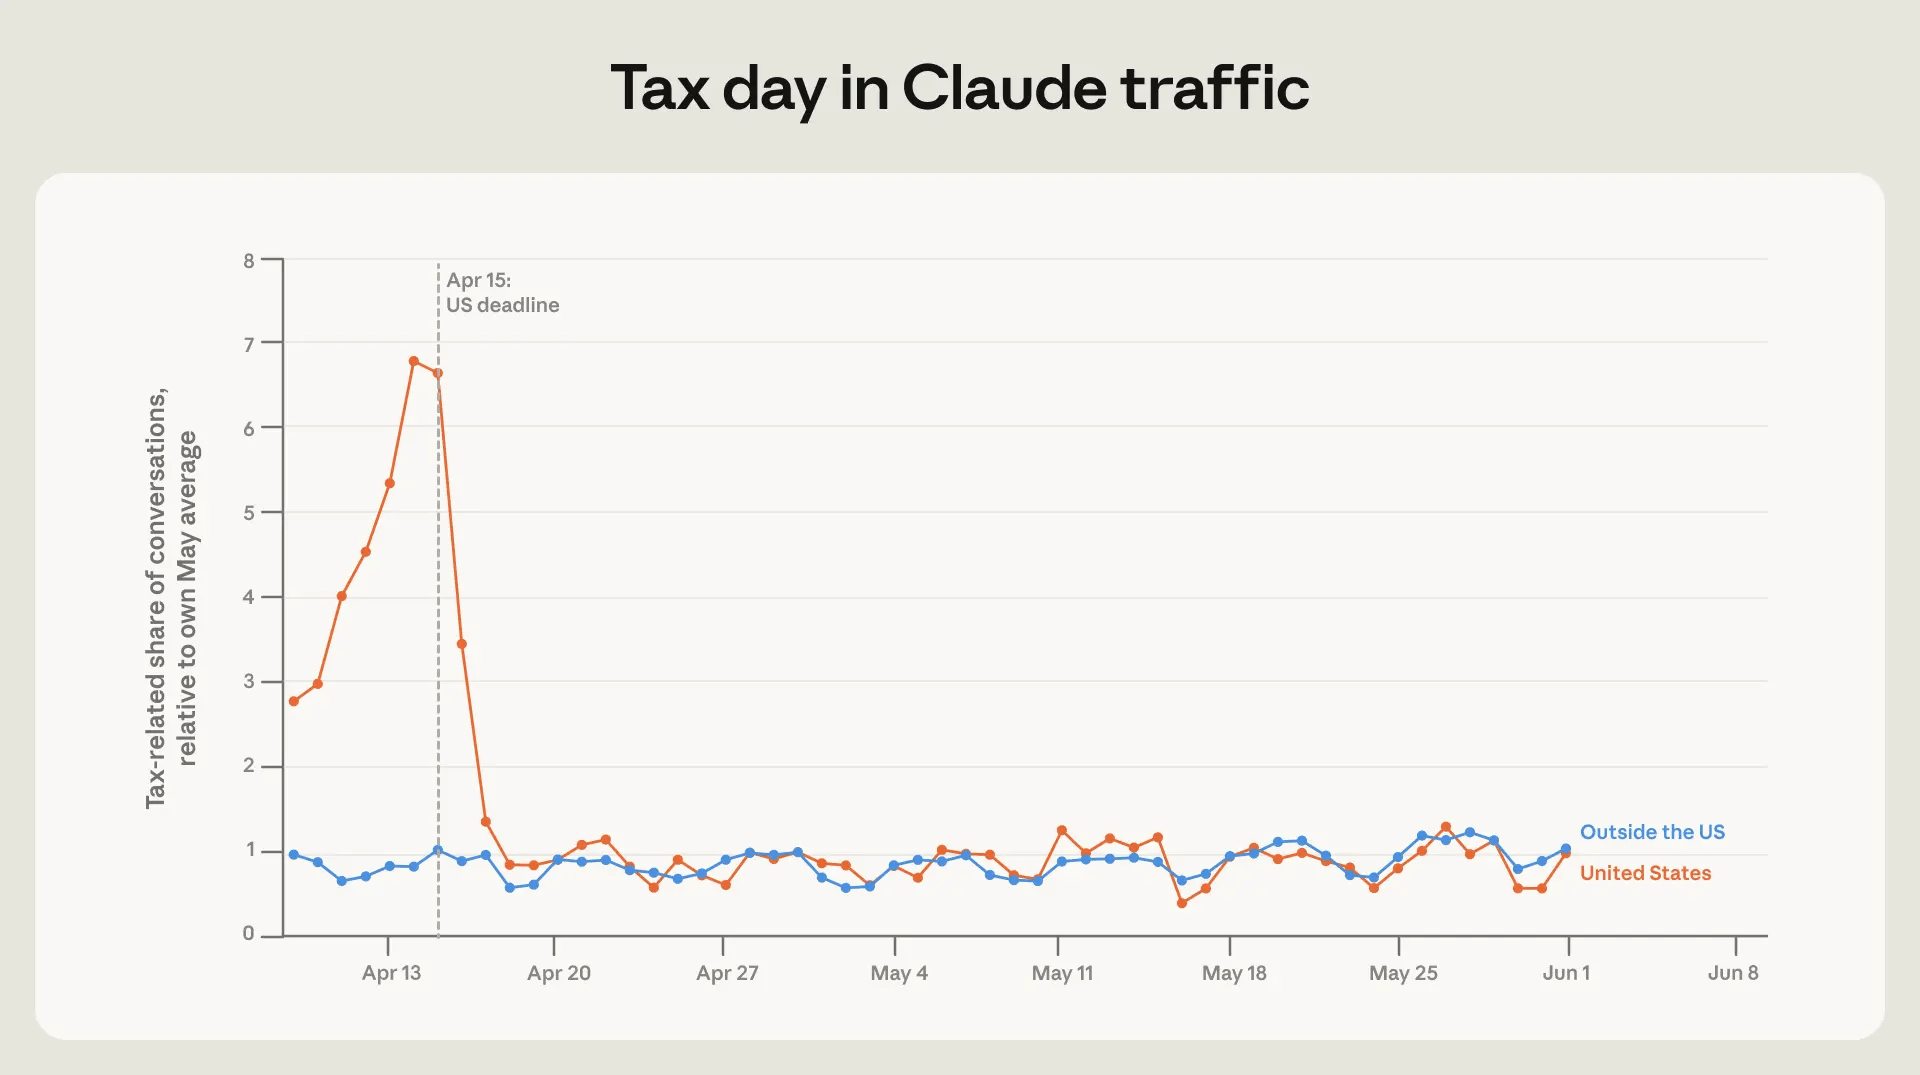
We also confirmed that usage patterns change in line with real-world events. The graph below shows the frequency of conversations about taxes, with the orange line representing US users and the blue line representing users outside the US. In the US, the tax filing deadline is April 15th, and it can be seen that the number of people asking the AI questions increases sharply just before the filing deadline.
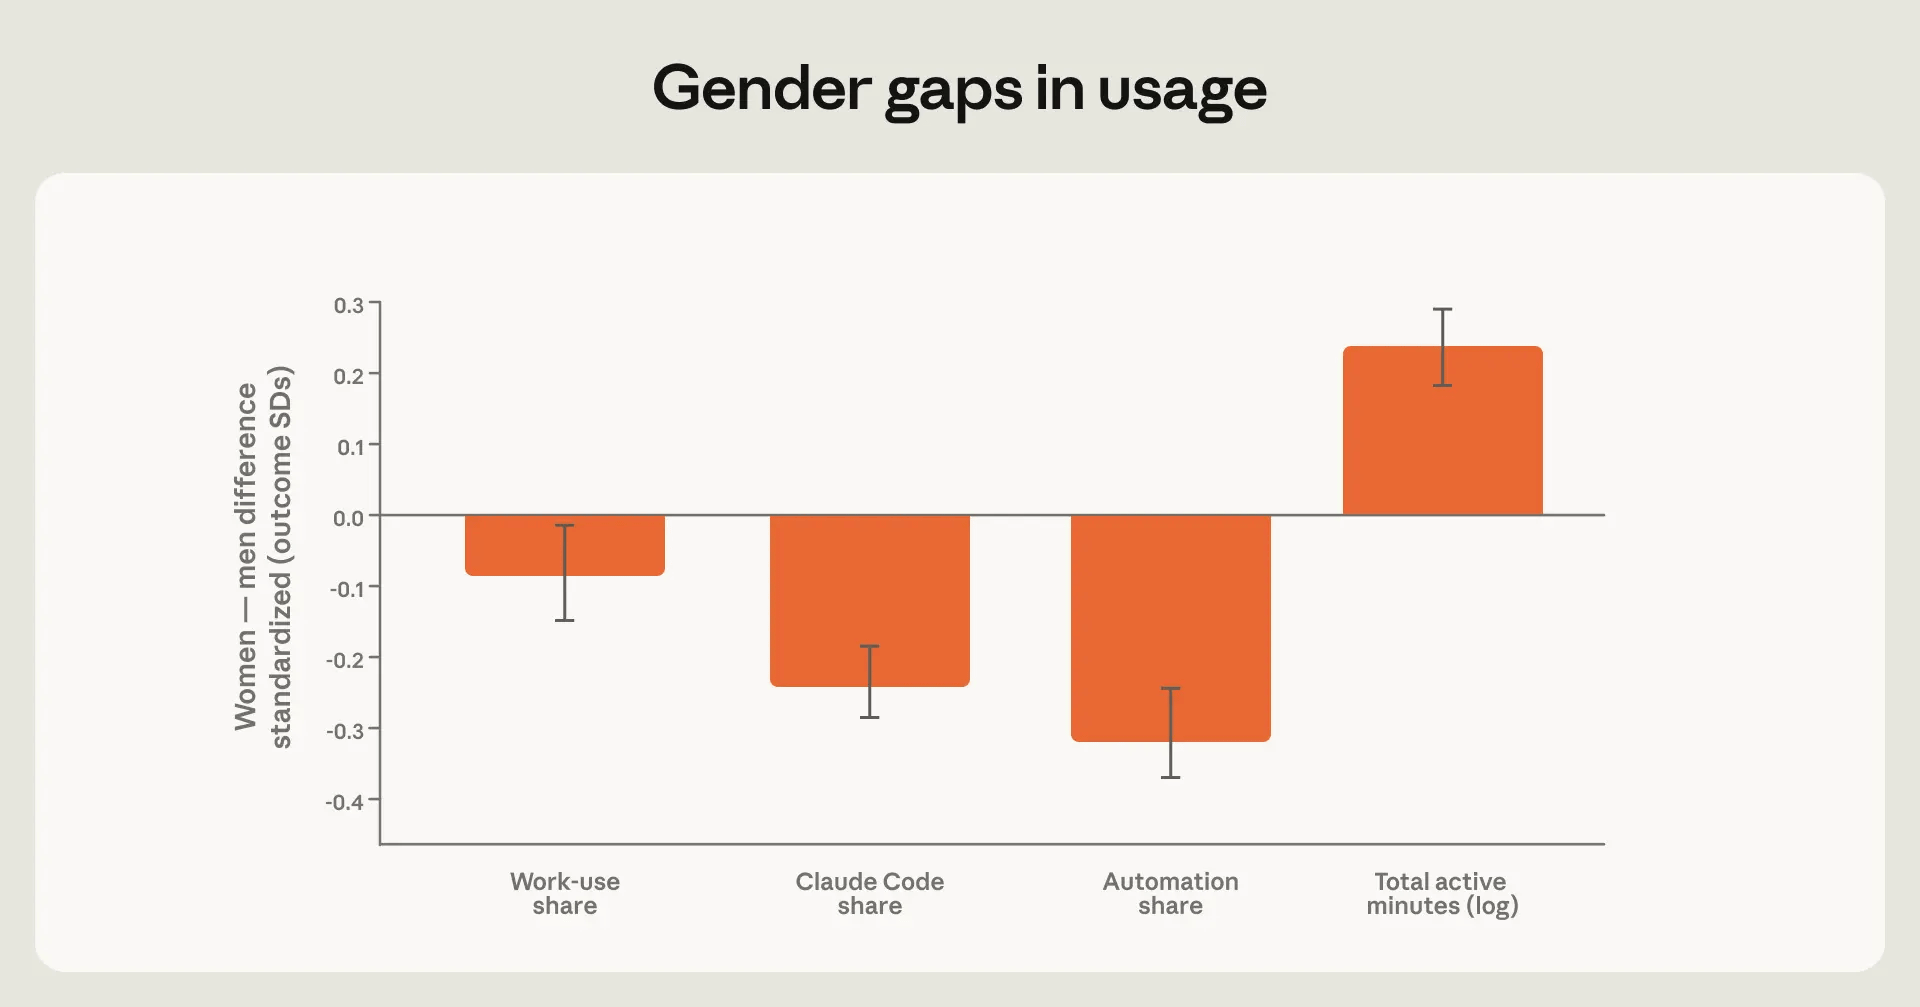
We also found that there are gender differences in usage trends. The graph below shows the difference in usage frequency between men and women in each category. An upward-sloping bar indicates that 'women use it more frequently,' while a downward-sloping bar indicates that 'men use it more frequently.' Men use it more often for 'work-related purposes,' 'using Claude Code,' and 'using it for automation,' but it was revealed that women spend more time using 'Claude for total time.'
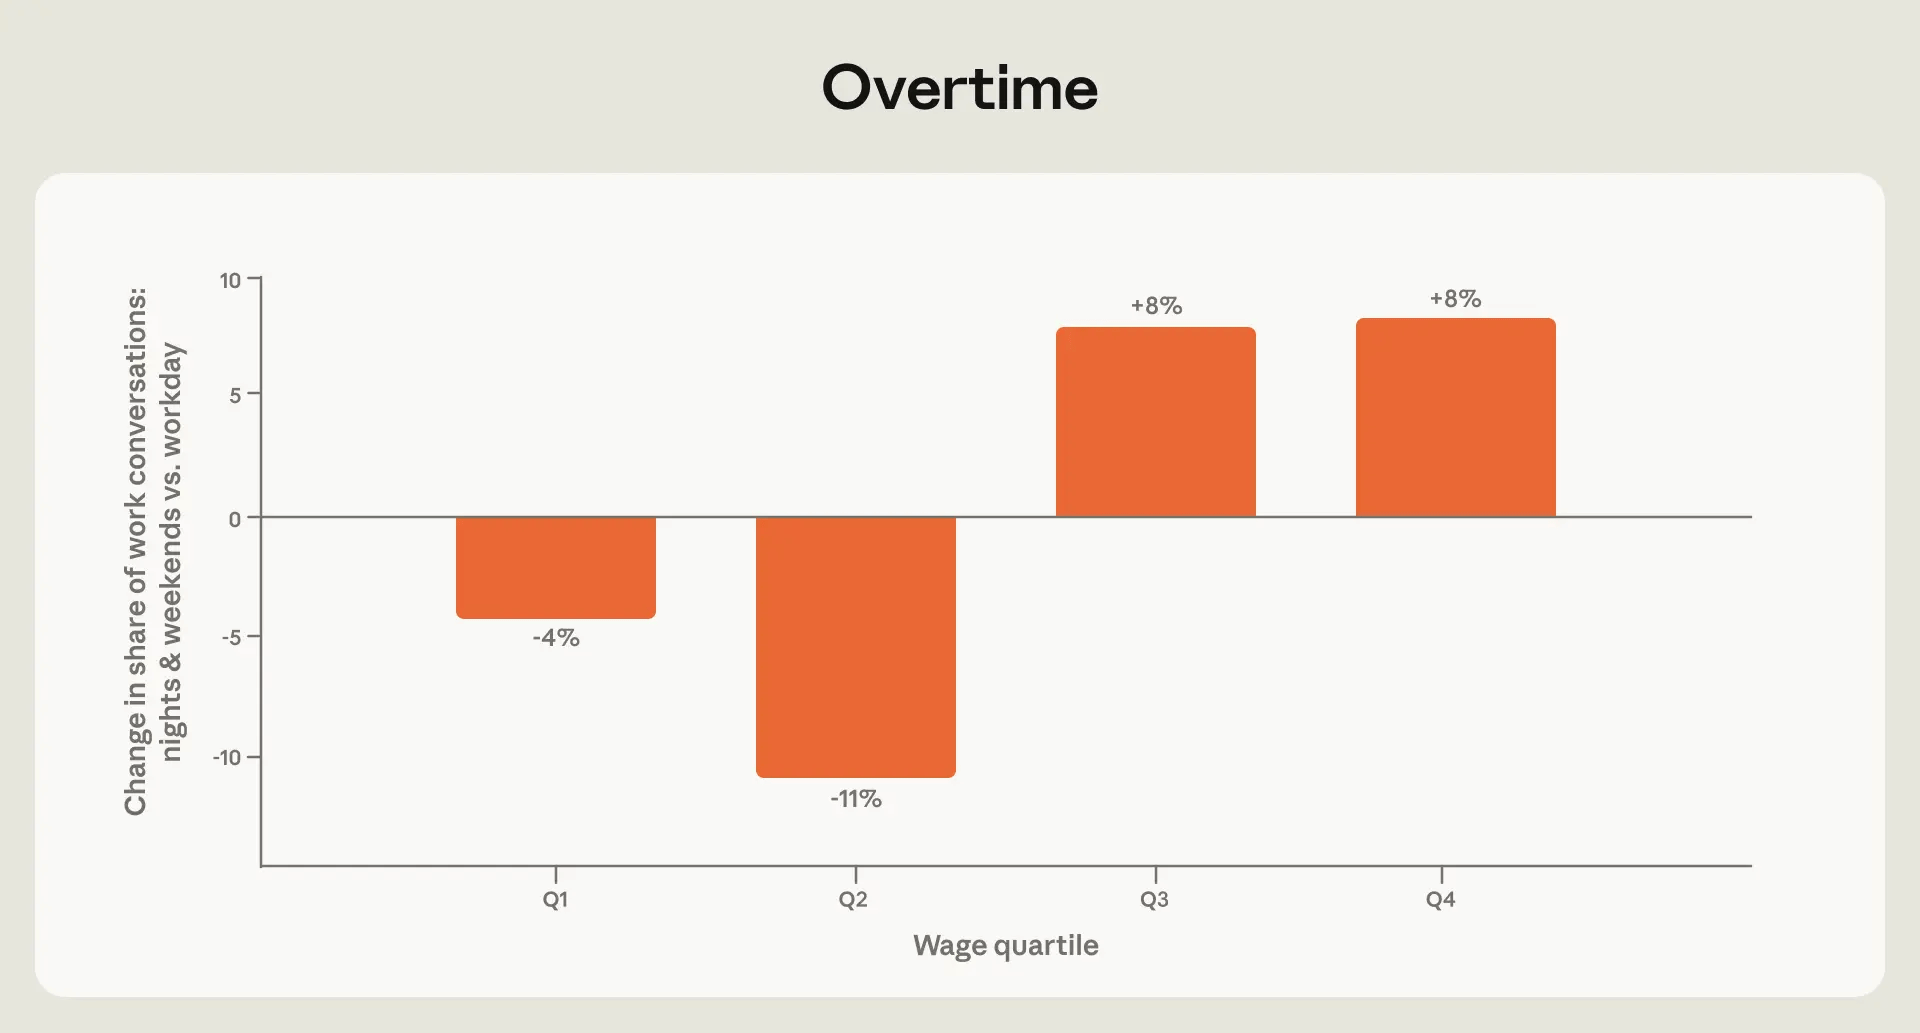
There are also differences based on wages. The graph below divides users into four levels, Q1 to Q4, based on their wage level, and compares 'whether they use Claude more on weekdays or weekends.' In Q1 and Q2, when wages are lower, usage is higher on weekdays, but in Q3 and Q4, when wages are higher, Claude is used more on weekends.
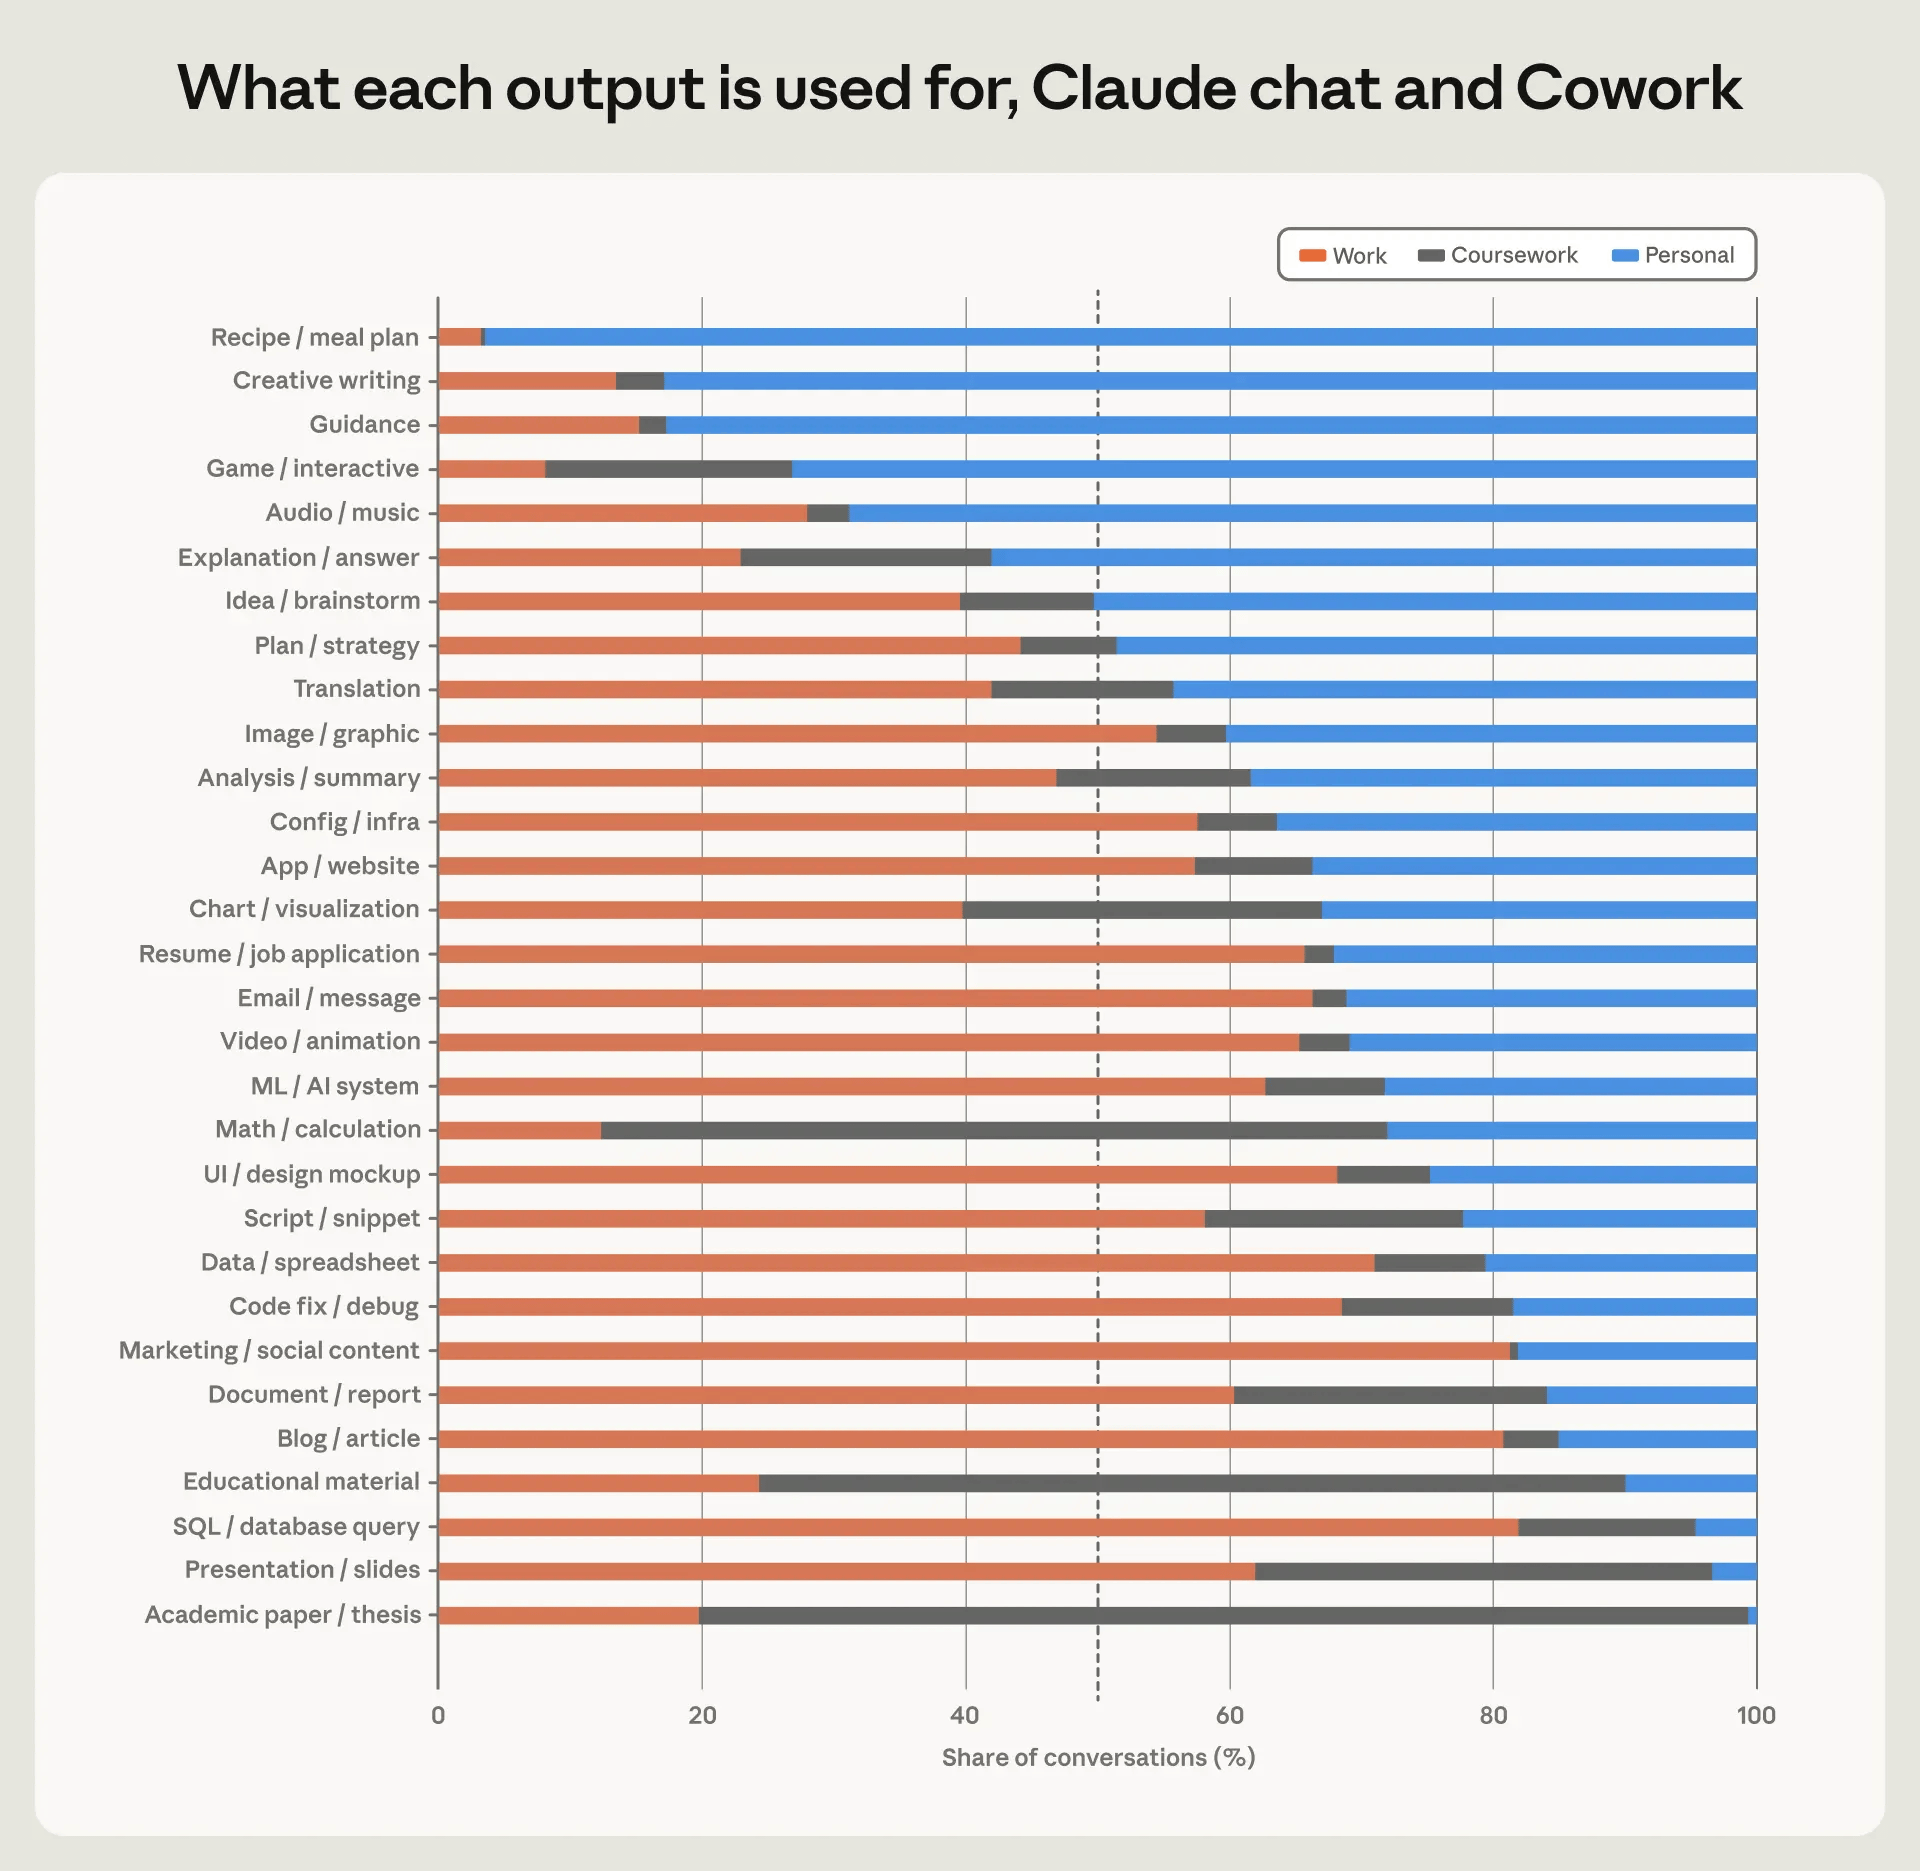
The graph below divides usage categories into three types: 'Work (orange),' 'Academics (gray),' and 'Personal (blue).' For 'Recipes,' 'Writing,' and 'Guidance Creation,' over 80% were for personal use, while for 'Marketing,' 'Blog Post Creation,' and 'Database Query Creation,' over 80% were for work use. Academic use was predominantly for mathematics and reading academic papers.
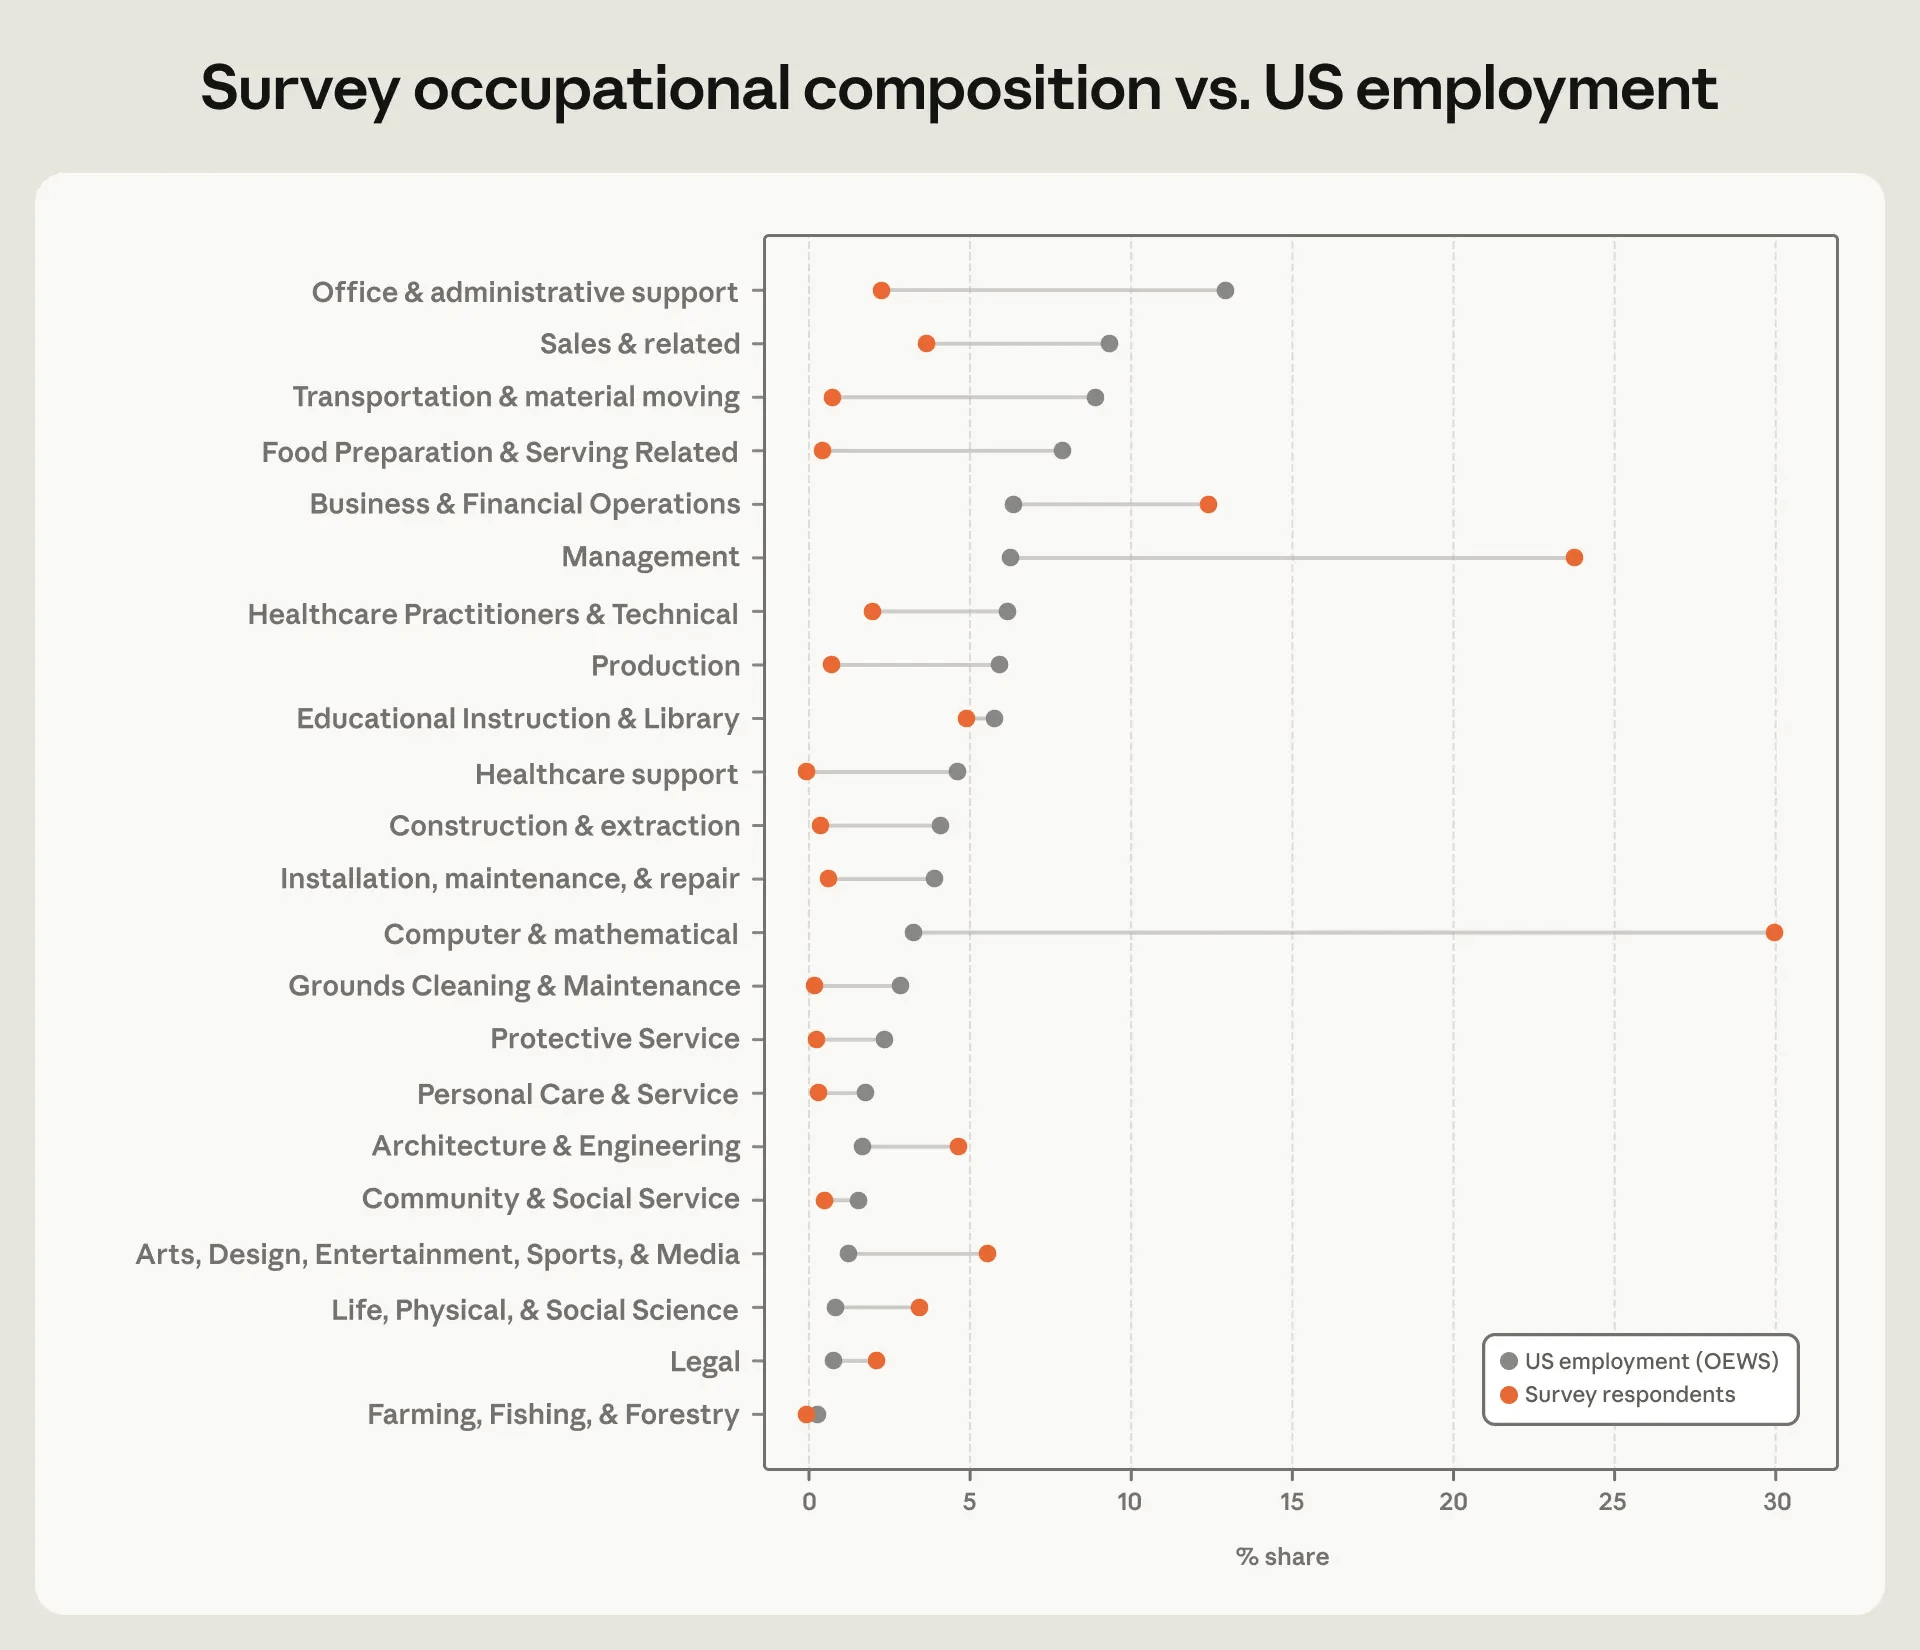
The graph below compares the 'percentage of Claude users (orange)' and the 'percentage of Americans in total employment (gray)' for each industry. It can be seen that the percentage of Claude users is higher than the percentage of Americans in total employment in 'Computer and Mathematics' and 'Management,' while the percentage of Claude users is significantly lower in occupations such as 'Transportation' and 'Food Processing and Hospitality.'
The Anthropic report includes a variety of other metrics, so if you're interested, please check it out.
Related Posts:






in AI, Posted by log1o_hf