'weather_landscape' project to make weather forecasts easier to understand by visualizing them like landscapes

Weather forecast results are basically expressed as letters and numbers, such as 'rain followed by sunny spelling,' 'minimum temperature 23 degrees, maximum temperature 34 degrees,' and 'probability of precipitation 30% in the morning, 50% from afternoon to evening, and 70% at night.' However, reading such letters and numbers requires effort and can sometimes be stressful. So software developer
GitHub - lds133/weather_landscape: Visualizing Weather Forecasts Through Landscape Imagery
https://github.com/lds133/weather_landscape
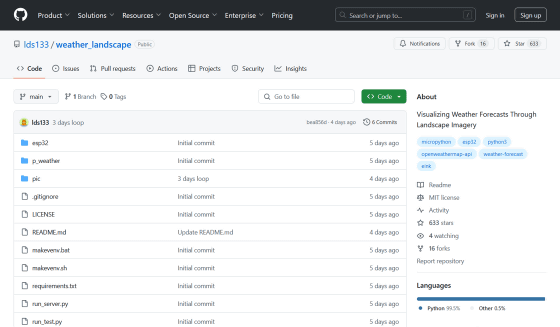
lds133 points out that when looking at a dashboard that displays sensor measurements as raw data, it takes a lot of effort to find, interpret and visualize the parameters you want to know about. Here's what the weather forecast dashboard that lds133 envisions looks like.
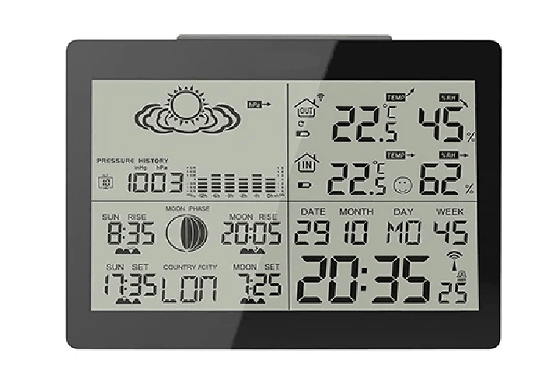
So lds133 started a project called 'weather_landscape' to visualize weather forecasts as landscape paintings. 'Looking at landscape images feels natural to the human eye,' lds133 said. 'The calming effect of observing landscape elements reduces stress and requires minimal effort, making for a more relaxing visual experience.'
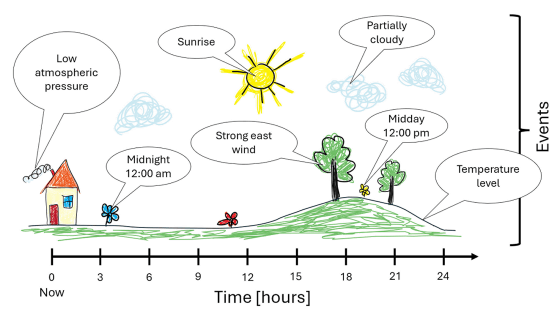
Below is a simple illustration of the principles of 'weather_landscape.' Time progresses from left to right, with the house on the left representing the current time, the blue flower representing 12 o'clock, and the yellow flower representing midnight. The clouds and sun above indicate the weather at that time, and the undulating ground indicates changes in temperature. In addition, the type of tree can indicate the direction of the wind.
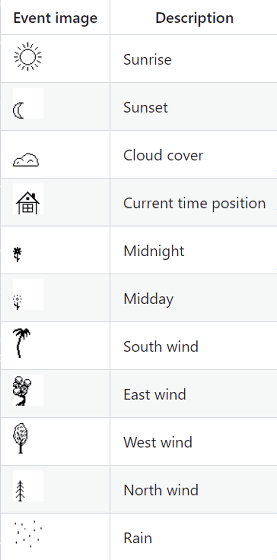
'weather_landscape' is intended to be displayed on a 296 x 128 pixel e-paper display, and displays weather-related events with the following icons: (from top to bottom): Sunrise, Sunset, Cloud cover, Current time position, Midnight, Midday, South wind, East wind, West wind, North wind, and Rain.
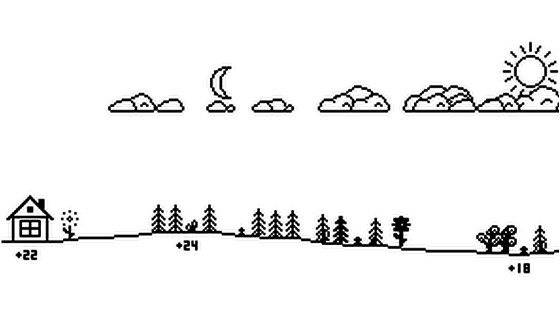
Here's what the weather forecast for the day looks like on 'weather_landscape.' It's just before noon, and the weather is sunny with a few clouds. The temperature is expected to gradually rise in the afternoon, reaching a maximum of 24 degrees Celsius, with a gentle northerly wind. The temperature will also start to drop after sunset, dropping to a minimum of 18 degrees Celsius before sunrise.
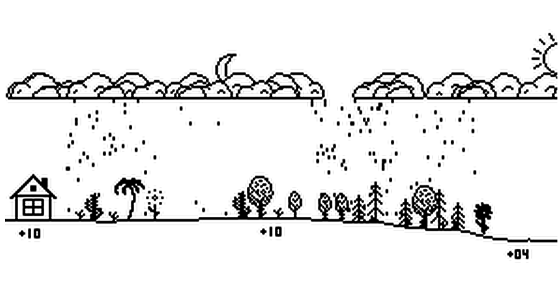
In the following pattern, it is currently raining in the morning, and the temperature is today's highest at 10 degrees Celsius. The rain weakens after noon, and after sunset the rain temporarily stops, but starts again after a while, and a northwest wind blows at night. The rain is expected to stop before sunrise, and the minimum temperature is 4 degrees Celsius.
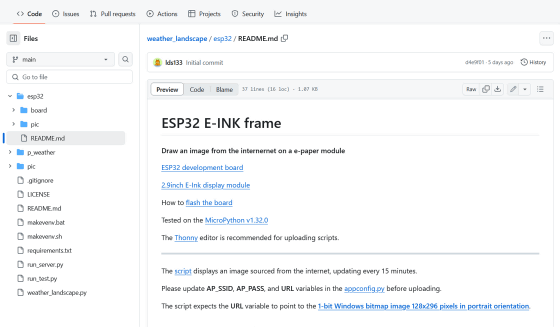
lds133 has published the code for running 'weather_landscape' on GitHub, and also describes a system that uses the microcontroller
weather_landscape/esp32/README.md at main · lds133/weather_landscape · GitHub
https://github.com/lds133/weather_landscape/blob/main/esp32/README.md
'Weather_landscape' has also been a hot topic on the social news site Hacker News. One user commented that they used an old photo frame to display 'weather_landscape' and made the images more realistic through OpenAI's image generation AI DALL-E, enabling even richer visualizations. Other similar apps mentioned were ' Yr.no ' and ' Weather Strip .'
Visualizing Weather Forecasts Through Landscape Imagery | Hacker News
https://news.ycombinator.com/item?id=41603546
lds133 said, 'I have a screen on my desk, and the image changes throughout the day. It's surprisingly fun to watch the changes. For example, rain comes in from the right side and disappears after a few hours, and trees start to grow. Meanwhile, the sun and moon move steadily forward, showing the transition between day and night. Another fun thing is that the mechanism resembles a binary clock . People think there must be some meaning in it, but often don't know how to interpret it. But the simple design invites people to try to figure it out.'

Related Posts:
