Six graphs that clearly show that the supply of batteries is increasing exponentially and will continue to expand in the future

The Rise of Batteries in Six Charts and Not Too Many Numbers - RMI
https://rmi.org/the-rise-of-batteries-in-six-charts-and-not-too-many-numbers/
◆Battery shipments are rapidly increasing
In the graph below, the horizontal axis shows the year and the vertical axis shows the total amount of electricity (GWh) of batteries shipped around the world. Battery shipments are increasing at a rate of doubling every two to three years, with an average annual growth rate of 33%. If you look at the fields of shipment, you will see that a particularly large proportion of shipments are for electric vehicles (dark blue and light blue).

◆Quality improves and costs decrease
In the graph below, the blue line shows the change in battery weight energy density, and the green line shows the change in battery price. Over the past 30 years, gravimetric energy density has increased approximately five times, while costs have fallen by 99%.

◆Uses continue to expand
RMI is based on the phenomenon that ``batteries will spread as battery costs and capacity density increases'' and ``technological innovation will occur as batteries are adopted in one market, which will lead to batteries being adopted in other markets.'' This is called the 'battery domino effect.' Below is a graph showing the share of battery-equipped models in 'two-wheeled vehicles and three-wheeled vehicles,' 'buses,' 'private cars,' 'low-load trucks,' 'energy storage systems,' 'large-load trucks,' and 'trains, ships, and airplanes.' . RMI says, ``As the adoption of batteries in private cars expands, the adoption of batteries in battery storage systems and trucks with small payloads will also expand,'' and ``By 2030, the share of battery models in ships and airplanes will increase.'' ” points out.

◆Recorded growth exceeding existing prediction models
In the graph below, the horizontal axis is year, the vertical axis is automotive battery demand (GWh), the blue line is the actual measured value, and the red line is the prediction by the International Energy Agency (IEA). Although the IEA has revised upward its forecasts each year for the transition to 2018, actual demand is increasing faster than predicted. RMI points out that 'the IEA's linear forecasting model is simply wrong, and actual demand is growing exponentially.'

◆Battery growth is “fast” or “faster”
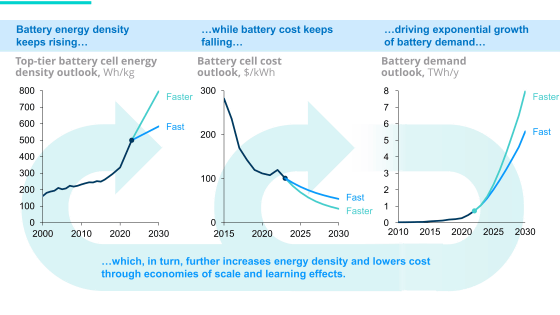
Analysts tend to build predictive models considering that batteries will either be ``fast'' or ``slow'' when it comes to ``improvement in weight energy density,'' ``decrease in price,'' and ``increase in market share.'' However, RMI points out that it is unlikely that the movement related to batteries will slow down, and presents a predictive model assuming that it will change to either ``fast'' or ``faster.'' According to predictions made by RMI, by 2030, the gravimetric energy density of batteries will reach 600-800Wh/kg, the cost will fall to $32-54 (approximately 4,800-8,000 yen) per 1kWh, and battery sales will increase. It is said that it will reach 5.5 to 8 TWh per year.

◆ Phase out fossil fuels
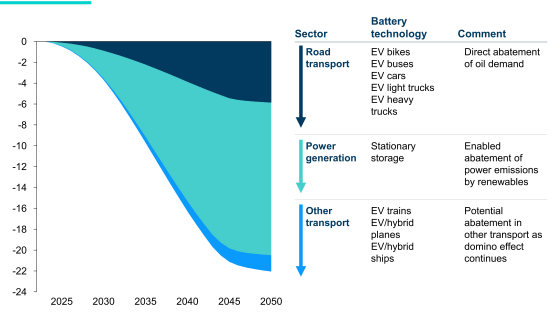
The graph below shows how much carbon dioxide emissions around the world can be reduced by batteries. The demand for gasoline is already decreasing due to the spread of electric vehicles, and the spread of energy storage systems using batteries is expected to revolutionize energy production. RMI predicts that widespread adoption of batteries will reduce fossil fuel demand for road transport by 86 exajoules per year, and fossil fuel demand for sea and air transport by 25 exajoules per year. Additionally, we predict that battery storage systems will maximize the efficiency of solar and wind power generation, reducing fossil fuel demand for energy production by 175 exajoules per year.

Related Posts:


