``The Reality of Hometown Tax Donations - Is your city a winner or a loser?'' that visualizes whether your town is gaining or losing money through hometown tax payments.
Under
The reality of hometown tax payments: Is your city a winner? Losers? : Nihon Keizai Shimbun
https://vdata.nikkei.com/newsgraphics/hometown-tax-donation-trends-map/
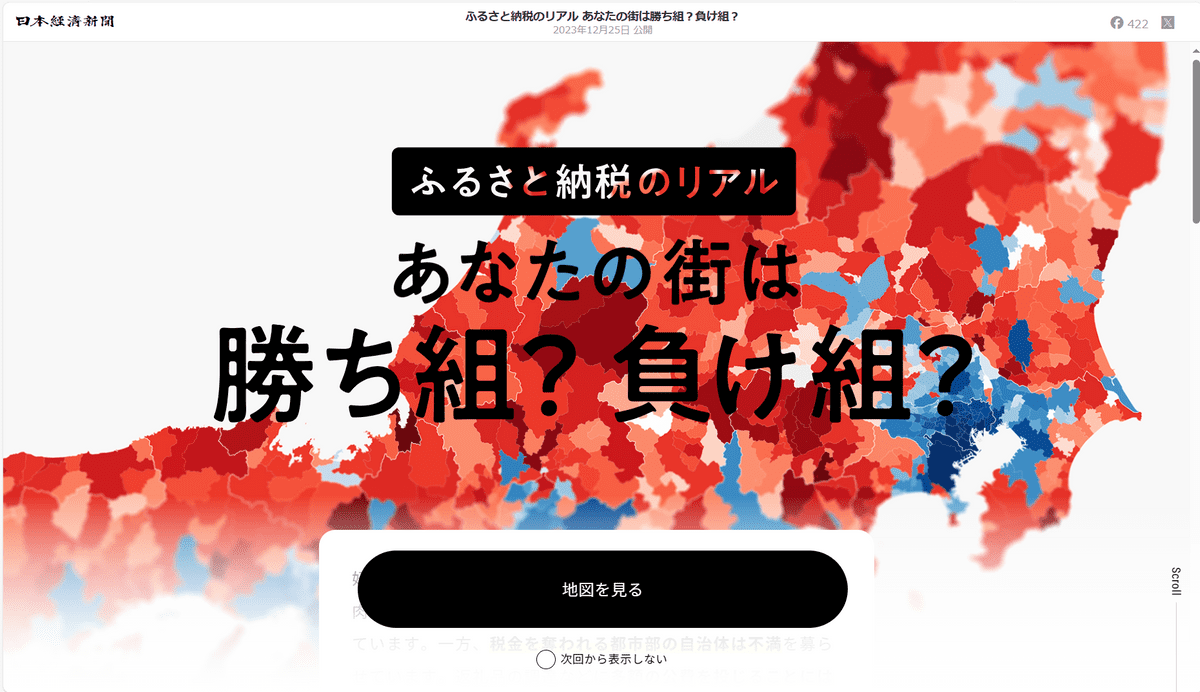
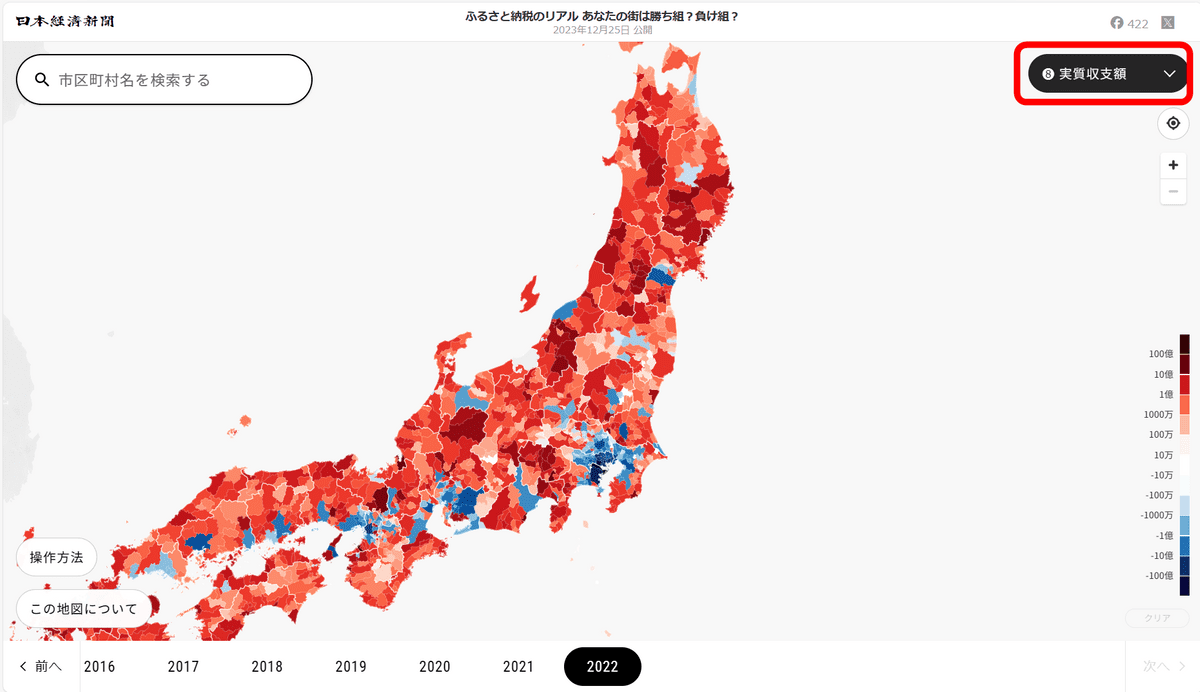
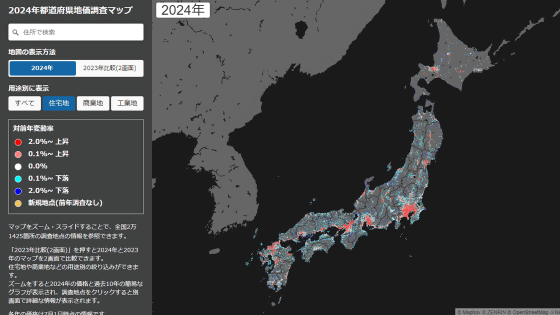
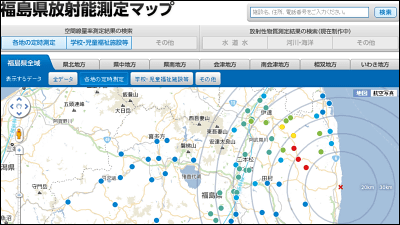
When you access the above URL, you will see a screen like the one below.
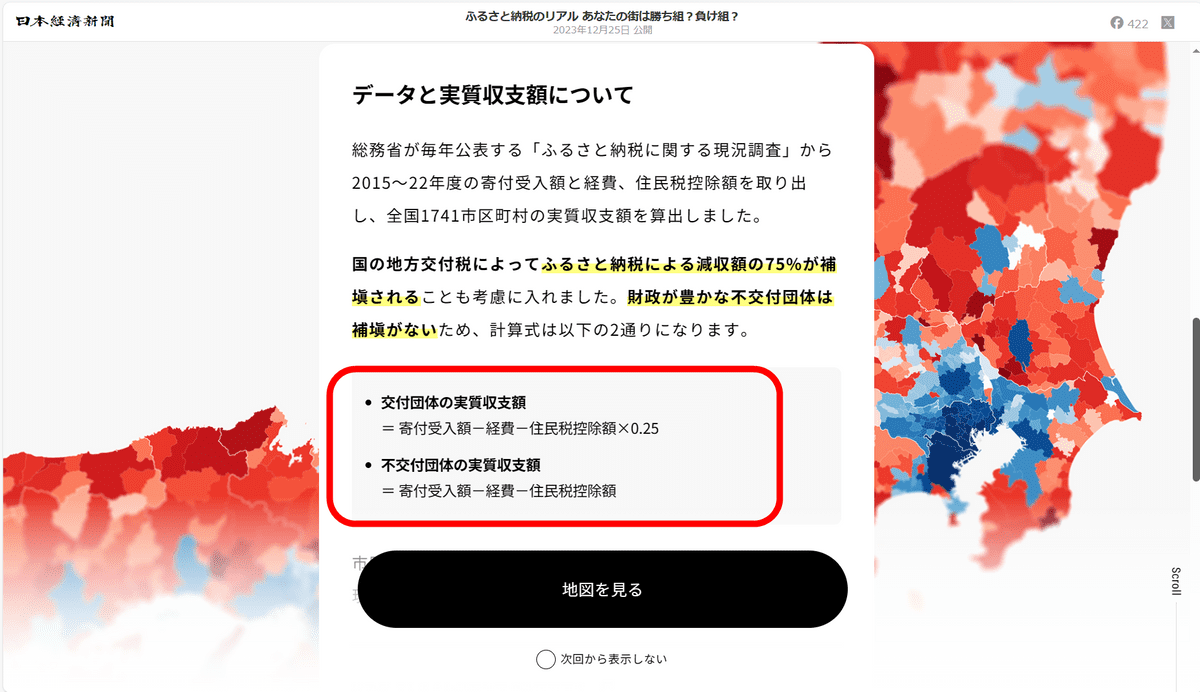
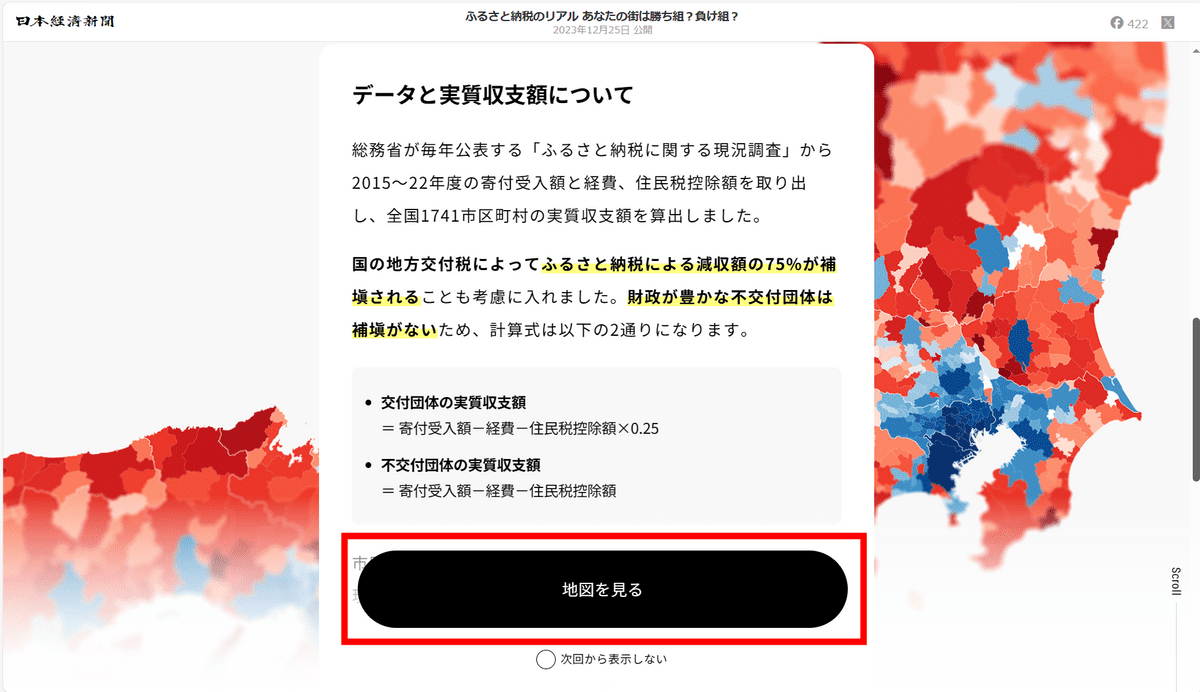
Scroll down and you will see an explanation of how the income and expenditure for hometown tax payments was calculated. According to this, in municipalities that receive
Click 'View Map' to actually see the map.
In the default 'real balance amount', regions with positive balances are displayed in red, and regions with negative balances are displayed in blue, and the darker the color, the larger the amount. Looking at the distribution of red and blue regions, you can see that metropolitan areas such as Tokyo, Osaka, and Aichi tend to have negative income and expenditure.
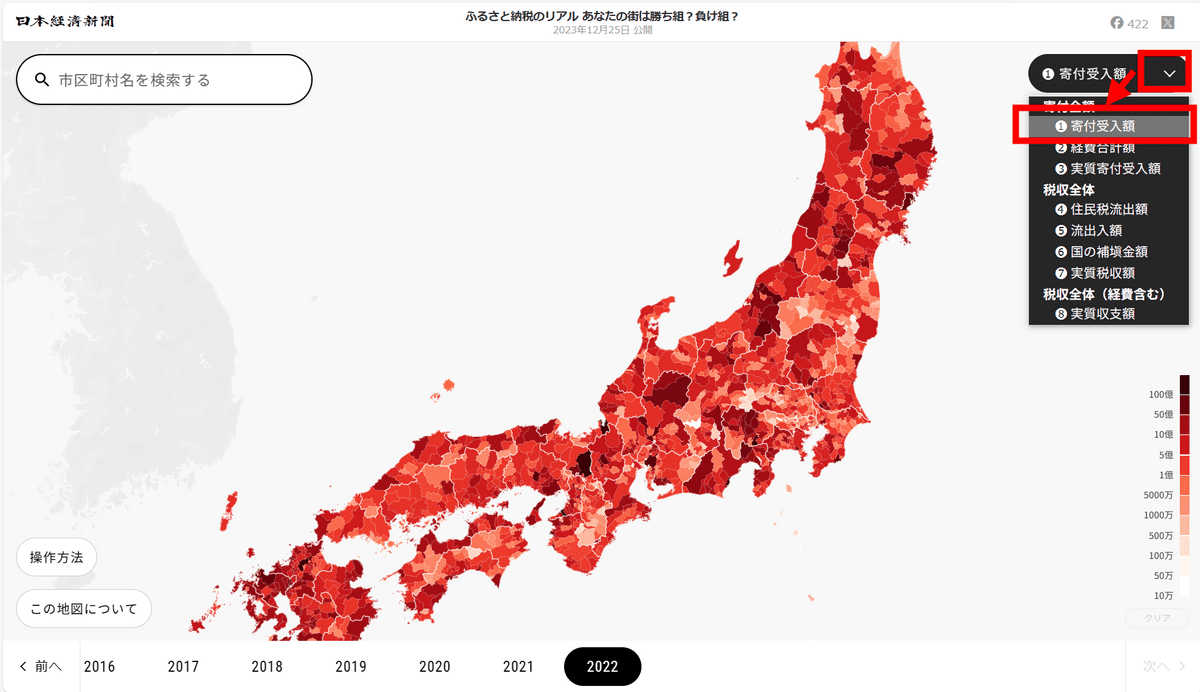
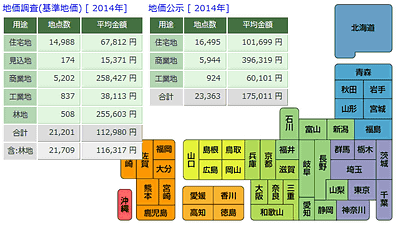
If you select 'Donation Amount Received' from the menu on the top right, you can see the color-coded amount of donations received.
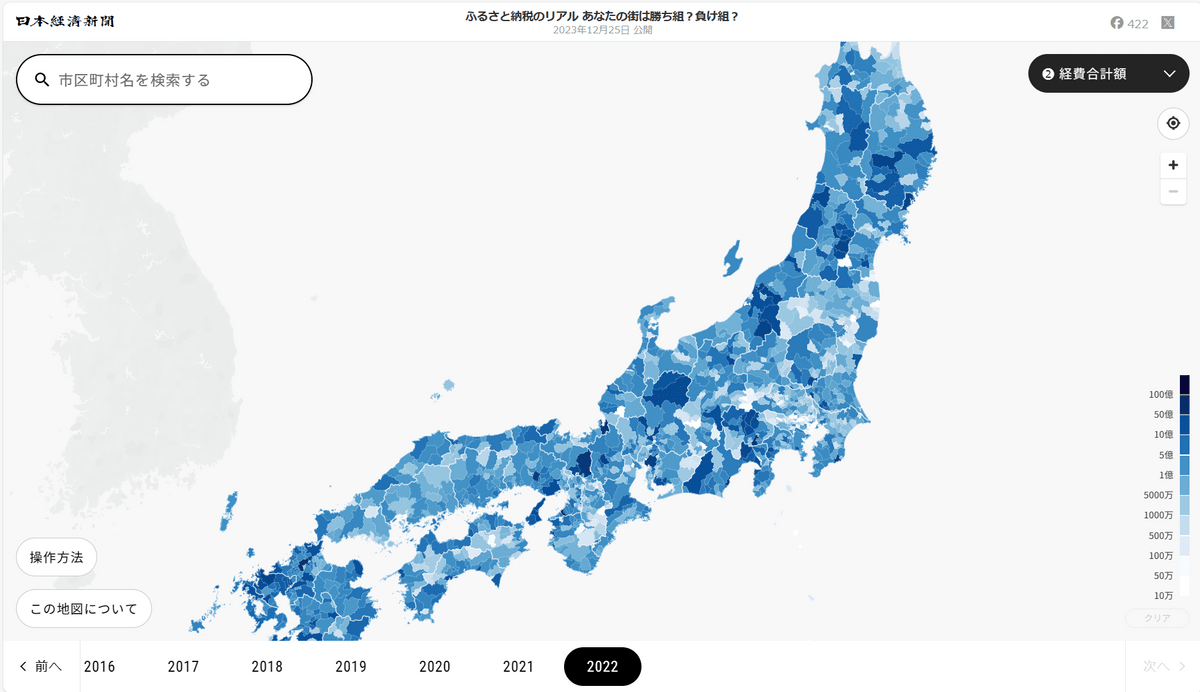
The total amount of expenses shows how much you spend on things like procuring return gifts and public relations costs, in other words, how much you spend on receiving donations through hometown tax payments.
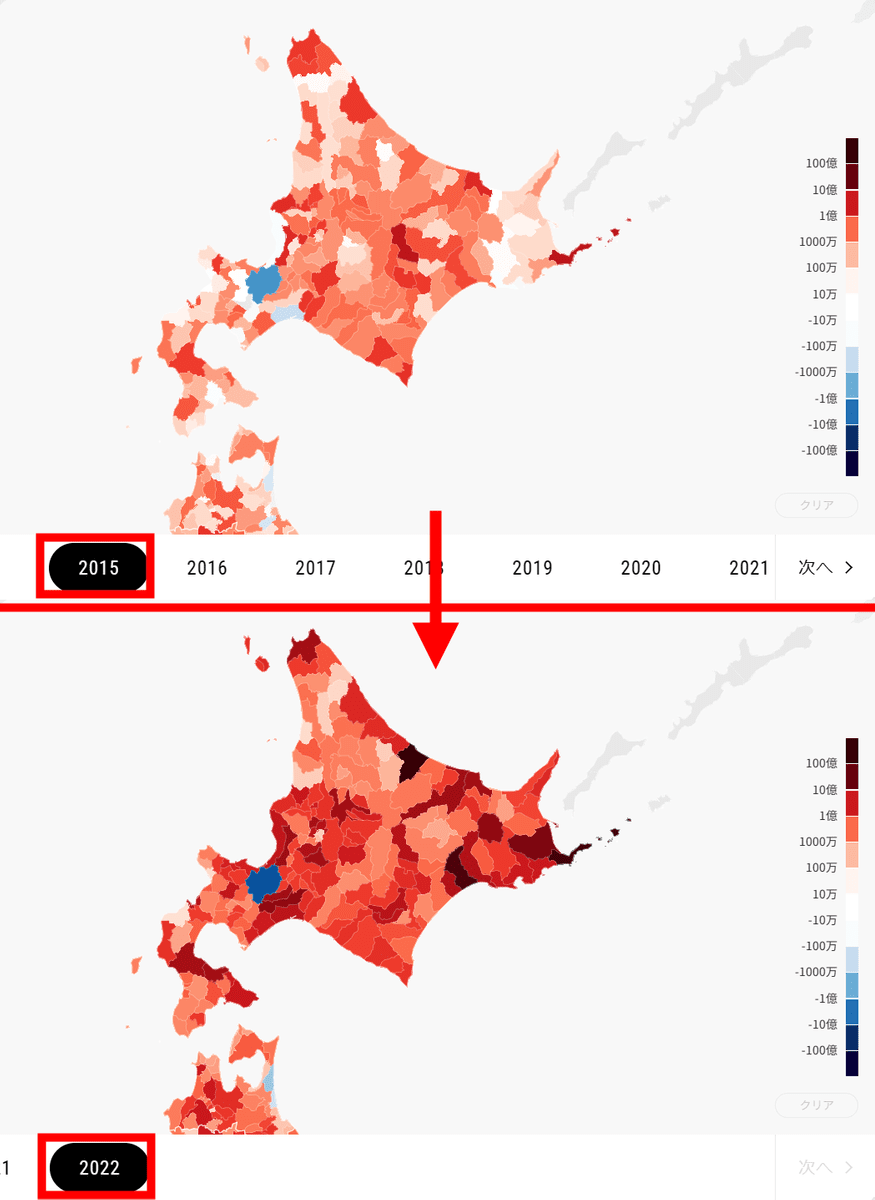
By switching the displayed year at the bottom, you can also see how disparities are widening within the same prefecture.
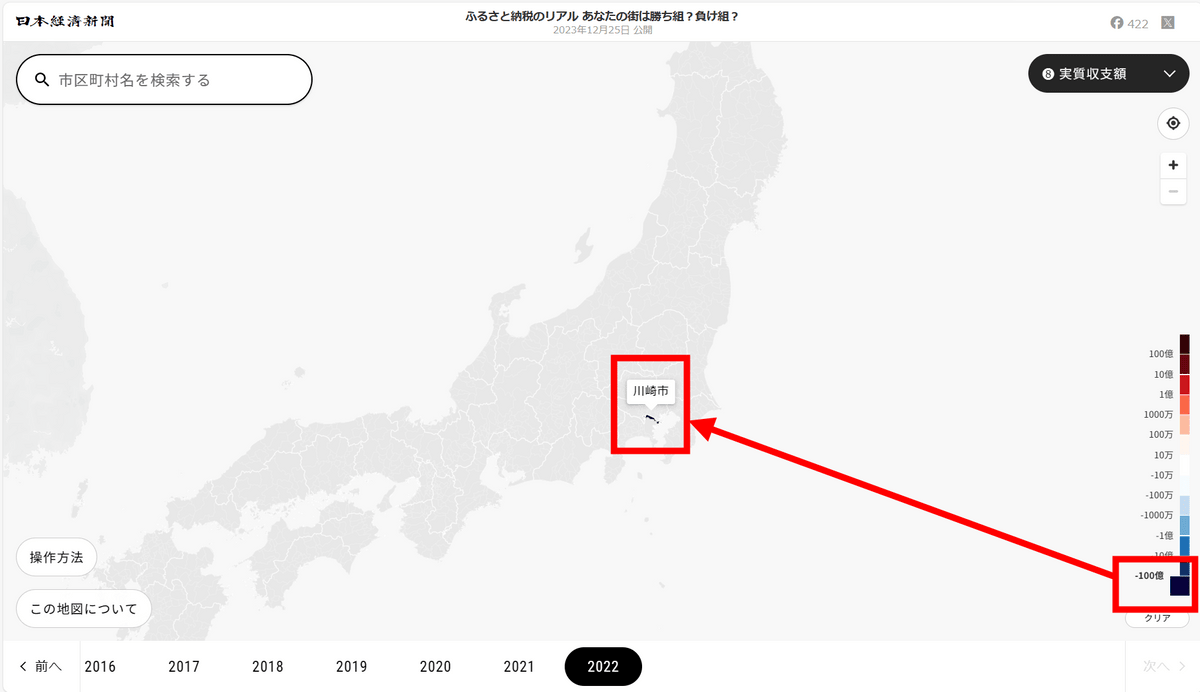
There is also a function to filter by price range. As a test, I narrowed it down to municipalities with a real income and expenditure amount of '-10 billion yen', and the result was as shown below, so I clicked on Kawasaki City, Kanagawa Prefecture.
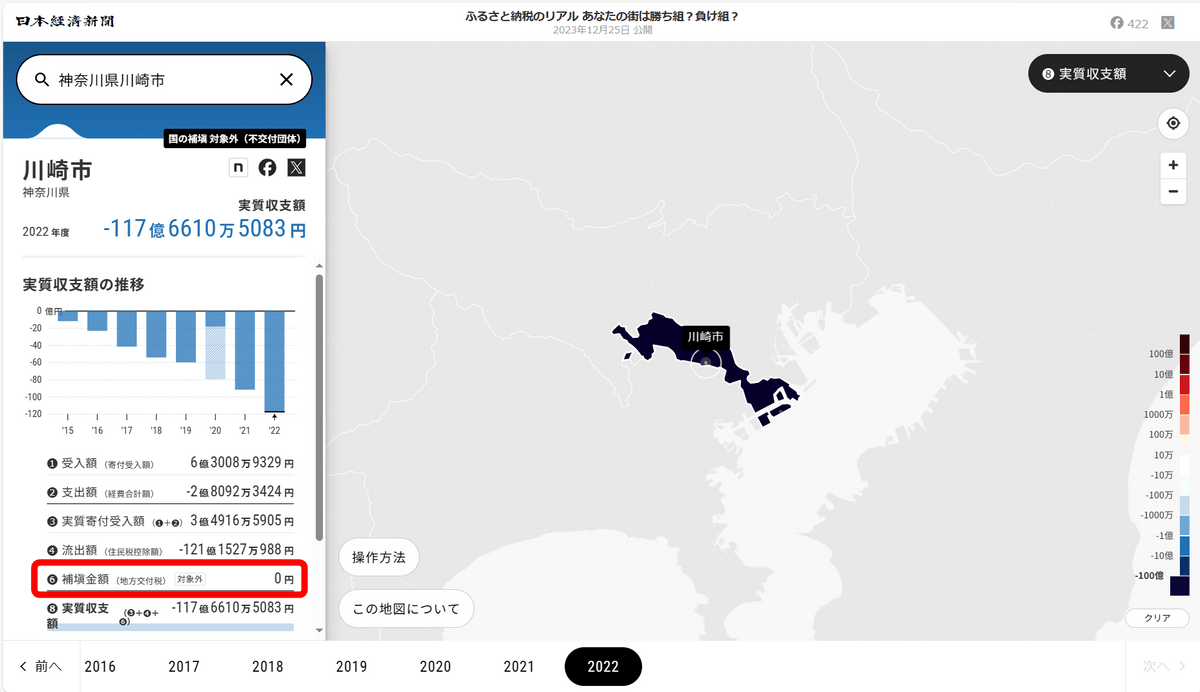
Looking at the details of the income and expenditure, Kawasaki City, Kanagawa Prefecture is a non-grant organization with abundant financial resources, so it cannot receive compensation from local allocation tax and is
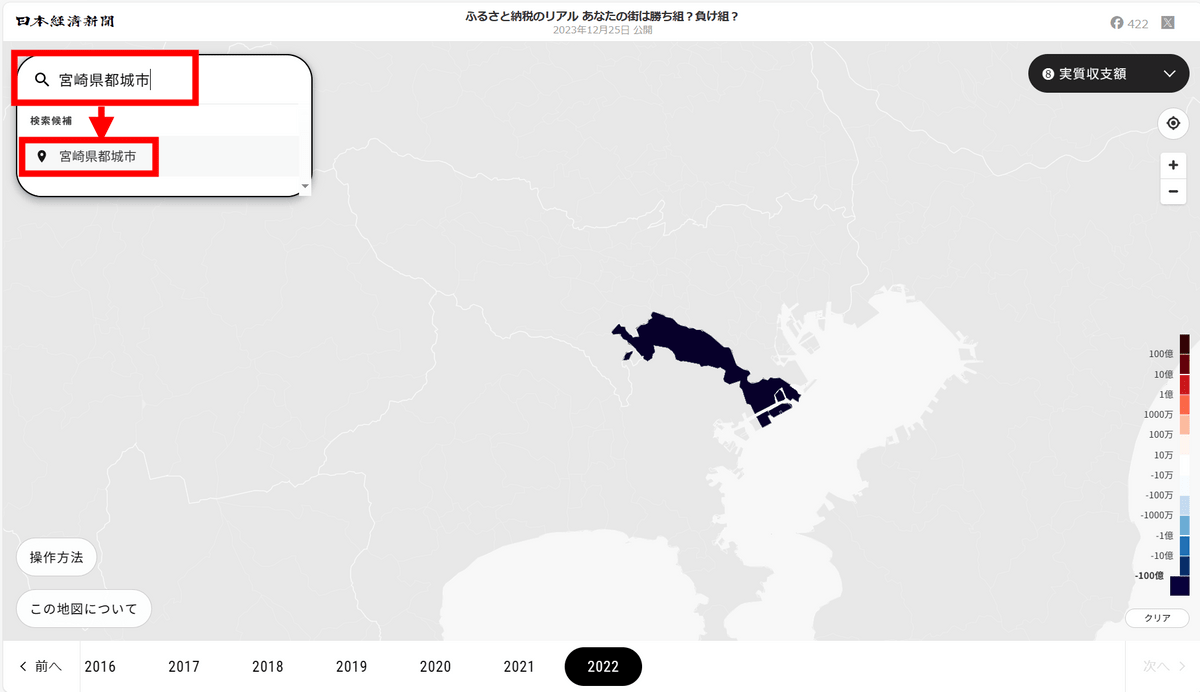
According to the Nihon Keizai Shimbun, ``The top winner is Miyakonojo City, Miyazaki Prefecture,'' so I entered ``Miyakonojo City, Miyazaki Prefecture'' in the search field in the upper left.
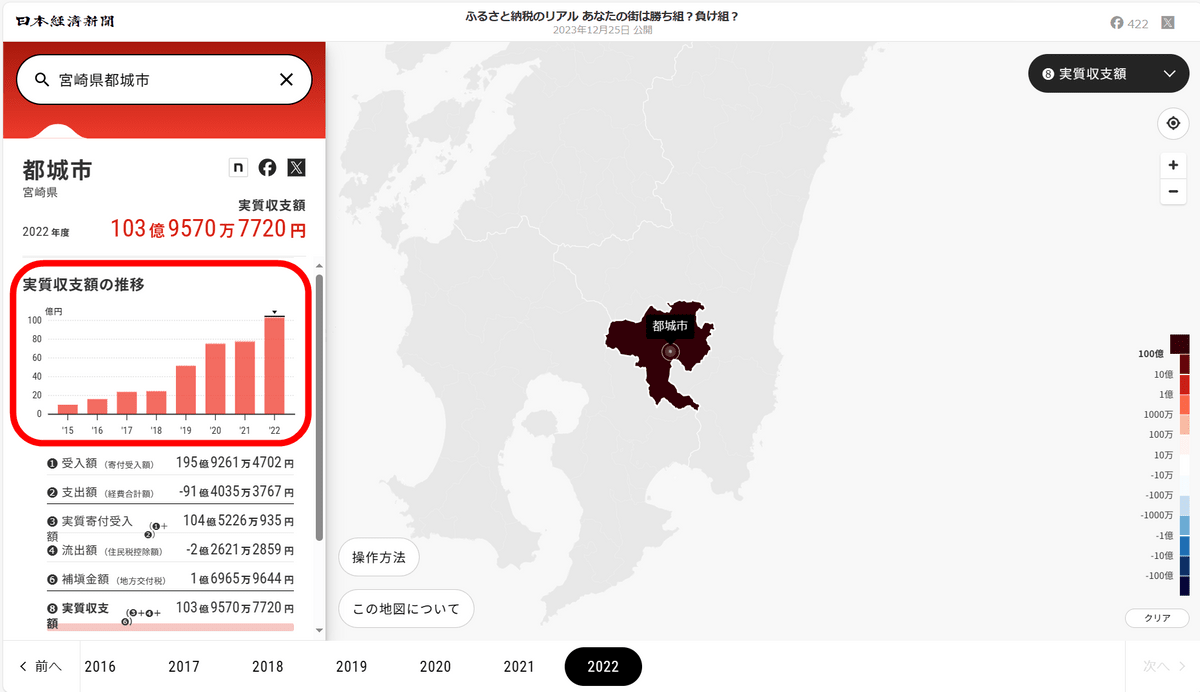
The details of Miyakonojo City, Miyazaki Prefecture are as follows. In particular, we can see that the real balance has increased significantly from 2018 to 2019. According to the city's
Related Posts:
in Review, Web Service, Posted by log1l_ks