There is a change in the 'bathtub curve' that shows the relationship between the usage time of HDD / SSD and the failure rate.
Backblaze, known for detailed analysis and disclosure of HDD and SSD data used in the storage server in operation, has a 'bathtub curve' that appears when the storage usage time and failure rate are graphed. I am reporting that there has been a change.
Drive Failure Over Time: The Bathtub Curve Is Leaking
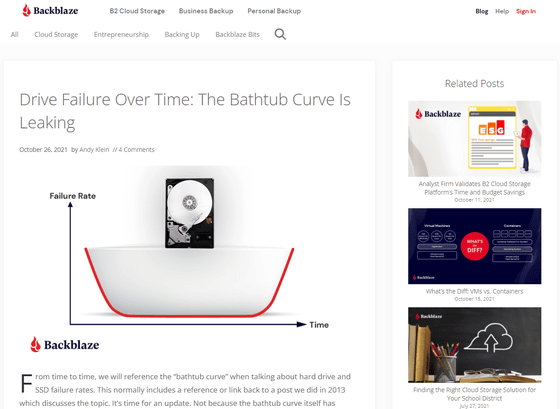
The graph below shows the time in the horizontal direction and the failure rate in the vertical direction. The red dotted line represents the initial failure, which is concentrated in a short time from the start of use and decreases over time. The solid green line is called a random failure and occurs with a certain probability regardless of the usage time. The yellow dotted line is 'wear failure' and appears over time. The blue line 'bathtub curve' is a combination of these three, named after the shape with high sides and low center.

This is the graph created by the data actually measured by Backblaze. As in the previous graph, the horizontal is the time and the vertical is the failure rate. Blue is the data for 2013 and red is the data for 2021. It is clear that the time of occurrence of the part corresponding to 'wear failure' is delayed, and Backblaze describes it as 'the width of the bathtub has expanded'.
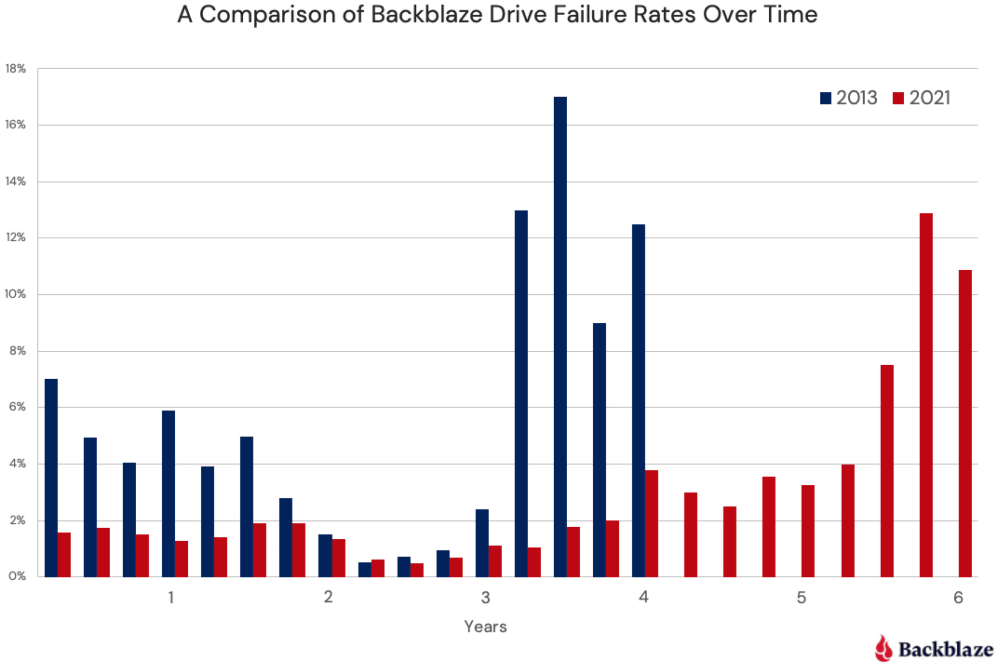
In addition, the initial defective part, which is the front edge of the bathtub, is also considerably low. This could be the effect of pre-shipment testing by the manufacturer.
According to Backblaze, a 2013 study found that storage had an average 4-year survival rate of 80% and a 6-year average survival rate of 50%, but by 2021, the 6-year average survival rate increased to 88%. I did. Backblaze says this isn't just about storage quality, it's also about good servers and skilled operations by good teams.
Related Posts: