'GovTrades.com' that visualizes how members' assets are fluctuating

' GovTrades.com ', a site that visualizes how the assets of a specific member of the Diet fluctuate by combining public information such as 'what stocks the member holds stock' and transaction data has been released ..
GovTrades.com

When you open the site, the line graph that you can see first shows the movement of the senator's assets until May 2020 when January 2014 is set to '0% (no increase or decrease)'. The data is based on the
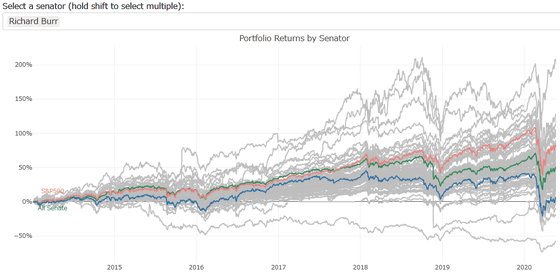
I cut out only the part from 2019 to 2020. The large drop in the graph in 2020 is due to the effect of the new coronavirus. Rep. Bar is being investigated by the FBI for selling out his shares before the market crash due to the spread of the virus. GovTrades.com has analyzed this suspicion in a

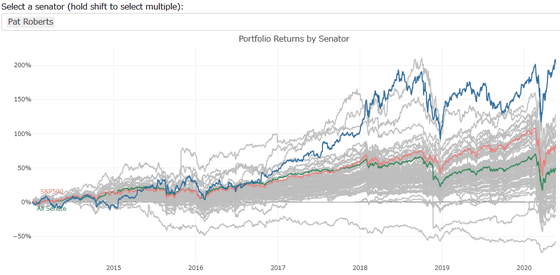
The largest increase in assets since 2014 was that of Kansas-nominated Pat Roberts .
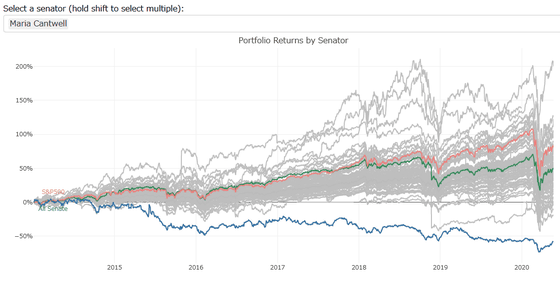
It was Washington State lawmaker Maria Cantwell who had the highest rate of asset loss.
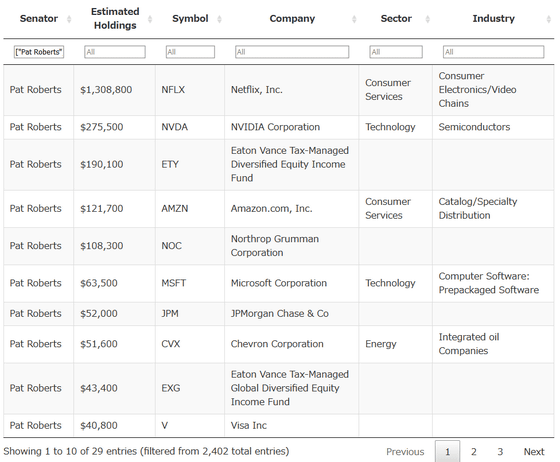
Below the graph is a table showing which members hold what stocks and how many. You can narrow down the search by item such as the member of the Diet, the amount held, and the brand. For example,
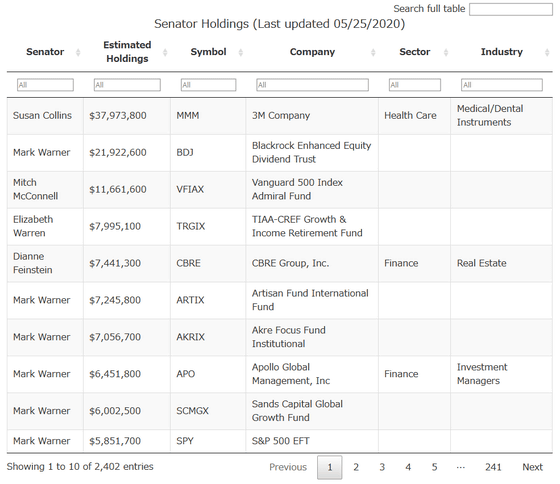
Congressman Pat Roberts, who has increased assets since 2014, holds Netflix shares and others, and I understand the reason for the increase.
Related Posts:
in Web Service, Posted by logc_nt


