Just as there is a 'wealth disparity', there is an 'exercise disparity', and the larger the disparity, the more the obesity rate is affected.

by
A research team at Stanford University analyzed minute-by-minute data on activities of 700,000 people and about 68 million days from around the world, and found 'the most active country in the world' and 'the least active country in the world' in Nature. It was announced. This is the largest survey ever conducted, and it was found that the average number of steps per day for people all over the world is 4961, with the highest average number of steps in China and Hong Kong, and the lowest in Indonesia. It has also been found that the more 'exercise disparity' that is not the 'wealth disparity' in a country, the higher the obesity rate in that country.
Large-scale physical activity data reveal worldwide activity inequality | Nature
https://www.nature.com/articles/nature23018
Do you live in the world's laziest country? --BBC News
http://www.bbc.com/news/health-40570442
According to Scott Delp, a professor of bioengineering who is a member of the research team, this study is about 1000 times larger than similar studies in the past that investigated human movement. The survey data was collected from 'ARGUS ' and found that the country with the highest average number of steps was 6880 steps in China and Hong Kong, and the lowest was 3513 steps in Indonesia.
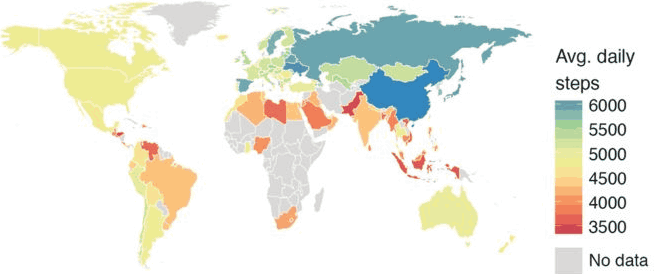
The following world map shows the average number of steps of app users in each country. The areas painted in gray are countries for which there is no data, and the average number of steps is indicated by warm and cool color scales. China and Japan are painted in cool colors, which indicate that the average number of steps is high, and the islands of Indonesia are painted in warm colors, which indicates that the average number of steps is low.
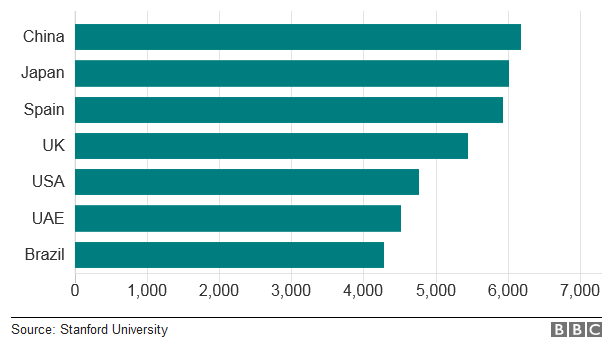
The graph below shows the differences in each country regarding the average number of steps per day for app users. Japan has the highest average number of steps after China, which is about 6000 steps per day. Japan is followed by Spain, the United Kingdom, the United States, the United Arab Emirates, and Brazil.
The study reveals a 'movement gap' between high and low activity, just as there is a 'wealth gap' between the poor and the rich. That it exists. And, as the disparity in exercise increases, the probability of becoming obese also increases. 'For example, Sweden is one of the countries with the smallest gap between those with high physical activity and those with low physical activity, and it is also one of the countries with low obesity rates,' said Tim Althoff, a member of the research team. It was.
On the other hand, the difference in the average number of steps in each country did not affect the obesity rate so much. The average number of steps in the United States and Mexico is similar, but the United States has a large disparity in exercise and tends to have a high obesity rate.
Researchers also found that there was a disparity in exercise between men and women. In Japan, where the disparity in exercise is small and the obesity rate is low, the gender disparity in exercise was small. However, in countries with movement disparities such as the United States and Saudi Arabia, women tended to spend less time doing activities. In countries with large exercise disparities, women's physical activity is dramatically lower, which is why women are more likely to become obese.
The research team believes that this study explains the causes of obesity patterns on a global scale and will be of great help in future efforts to prevent obesity.
Furthermore, data analysis revealed not only the differences between countries, but also the differences between cities. While New York and San Francisco are pedestrian-friendly roads in the United States, Houston and Memphis are lands that require a car to get around. As a result of comparing such cities, it is natural that people tended to walk more in New York and San Francisco.
The blue graph below shows the change in the average number of steps per day in a city that is difficult to walk, and the green graph shows the change in the average number of steps per day in a city that is easy to walk.

Researchers note that with such data, it is possible to design cities to make it easier for people to engage in exercise.
Related Posts:


in Science, Posted by darkhorse_log