"Why traffic congestion will occur" & "Simple Highway Simulator" can realize how useful the automatic driving is
ByJames Schwartz
As long as you drive a car, you should have experienced once in many traffic congestion that many cars will not move. Although it is traffic jam caused by factors such as accidents and signals, among many of them there are many mysteries, but "Traffic concentrationCongestion is caused by. It can be difficult to simulate a moment when traffic congestion occurs due to traffic concentration that can not be witnessed easily, traffic jam may be solved by a car equipped with automatic driving function, a site that can check such a state on the browser is "Simple Highway Simulator"is.
Simple Highway Simulator
http://mühlemann.ch/highwaysim/
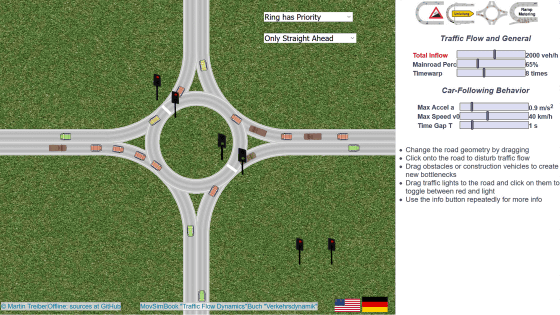
The screen displayed when you visit the site is kore. On the upper part of the screen are arranged sliders for adjusting the parameters such as the speed of the vehicle and the number of vehicles traveling, and graphs showing actual results of running. A black road is displayed at the bottom of the screen, and the car continues running from left to right with two lanes in one direction.
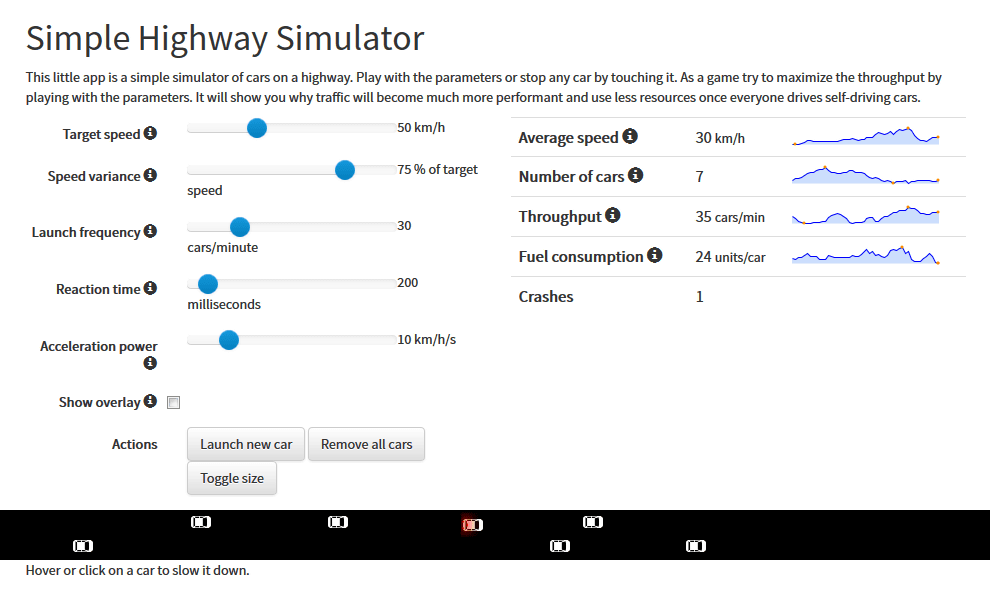
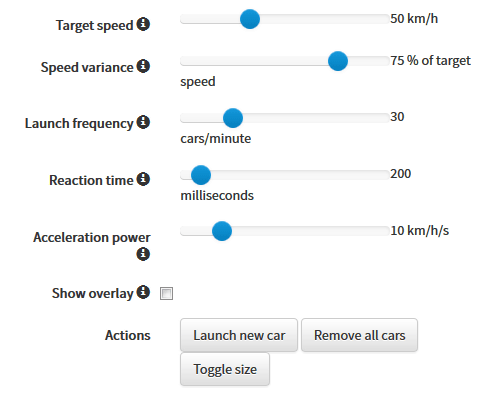
By moving the slider at the upper left of the screen, you can adjust the speed of the car, the variation of the speed of each car, the number of cars that runs, the reaction time to change the brake or lane in response to the preceding car, Acceleration force etc. can be changed freely. Also, by clicking on the button you can insert the car at any time, or you can reset all cars to reset.
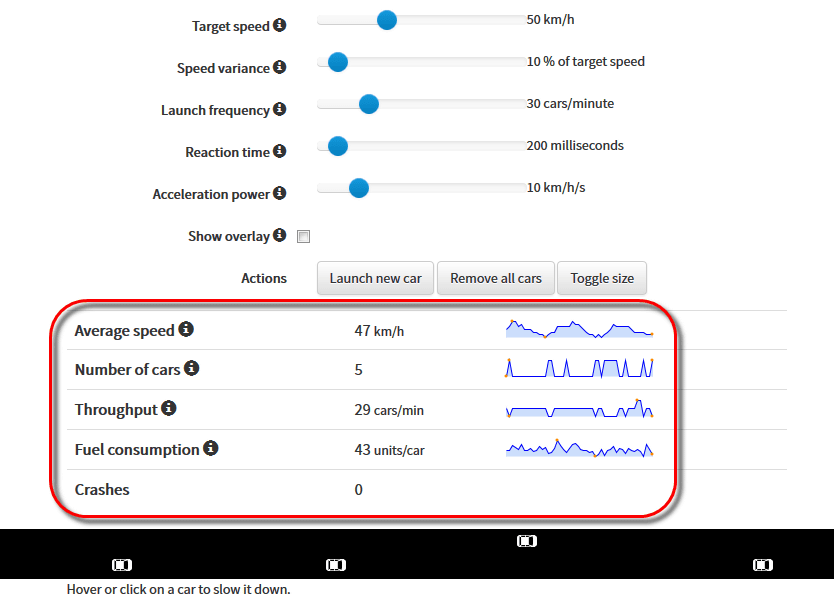
Beside the slider, the average speed of all vehicles, the number of cars, the throughput (number of vehicles traveled) and fuel consumption, and the number of accidents that occurred are displayed as graphs and so on.
In addition to being able to adjust the speed of the car with the slider, it is also possible to forcibly drop the speed by placing the mouse cursor.
◆ When trying various adjustments ......
First of all, I tried running the car in the initial state. When the target speed "50 km / h", the speed variation "10%", the number of cars "30 vehicles / minute", the reaction time "200 ms", the acceleration force "10 km / h" per second, The speed is 47 km / h and it is 6% lower than the target speed. The actual traffic volume was one less than the setting "29 units / minute", fuel consumption was "43 units" per unit, and the number of accidents was "zero".
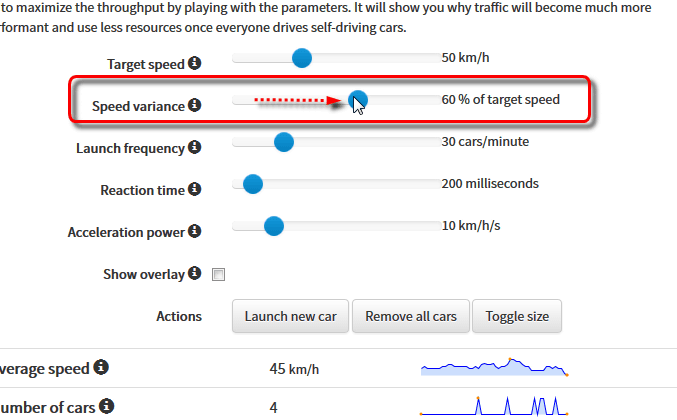
Next, I will raise the variation of speed to about 60%. This is to reproduce the situation where cars of various speed exist on the road, it should be said that it is close to the actual road situation.
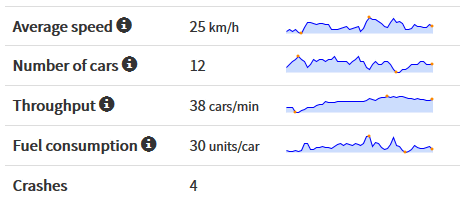
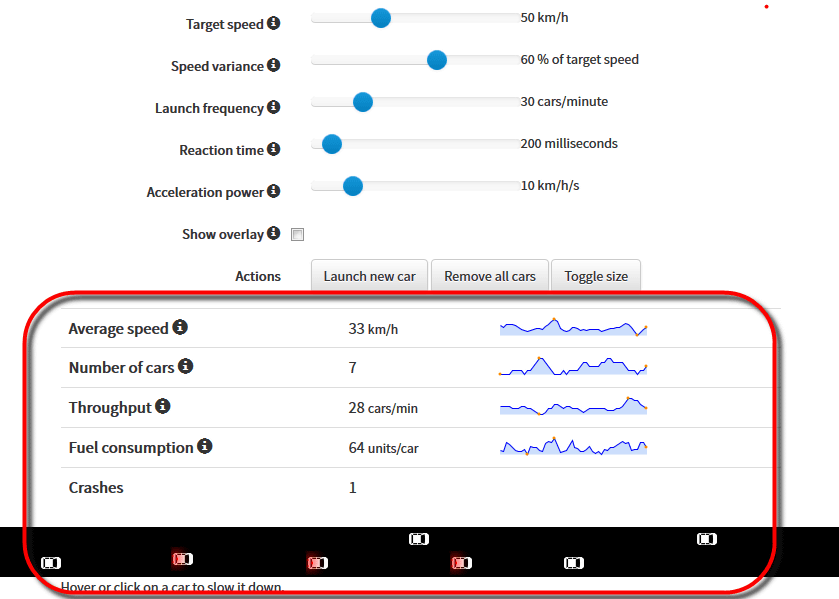
Changes to the graph occurred when left untouched. The average hourly speed dropped from 47 km / h to "33 km / h", and the number of vehicles on the road obviously increased. Traffic volume has decreased slightly to "28 cars / minute", and fuel consumption has greatly worsened from 43 units to "64 units". Furthermore, in this situation there was one accident.
In this state, the number of cars increased from 30 units / minute to "95 units / minute" at a stretch. Then, although the average hourly speed further decreased to "21 km / h", the traffic volume increased to "46 vehicles" because the number of running vehicles itself increased. Fuel consumption is also "45 units", but the number of accidents is "5 cases", four more than in the previous year has increased by four.
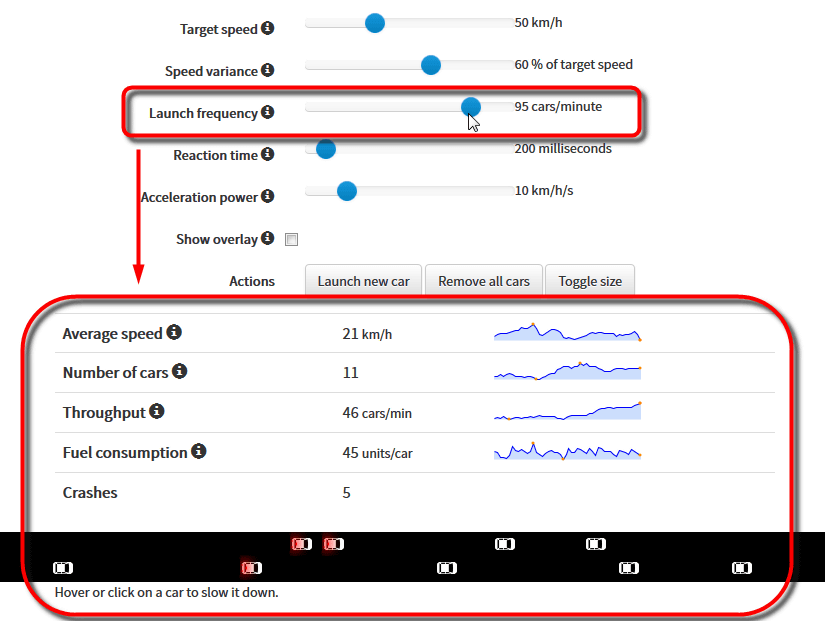
This means that if there is a variation in the speed of each car, it means that increasing the number of steps to stepping on the brake or changing the lane will mean slowing the overall average speed. Furthermore, it can be seen that there is an effect that accidents increase with this.
Next time, let's run only with the variation of speed set to "0%" from the initial state and run it, obviously the average speed has achieved "50 km / h" as set. Traffic volume is also set to "30 cars / minute" as expected, but somehow the fuel consumption has increased to "54 units". Nonetheless, as you can see from the graph, mystery increases and decreases occur depending on the timing, and in some cases 30 units were recorded. Perhaps this is influenced by how the algorithm is tuned.
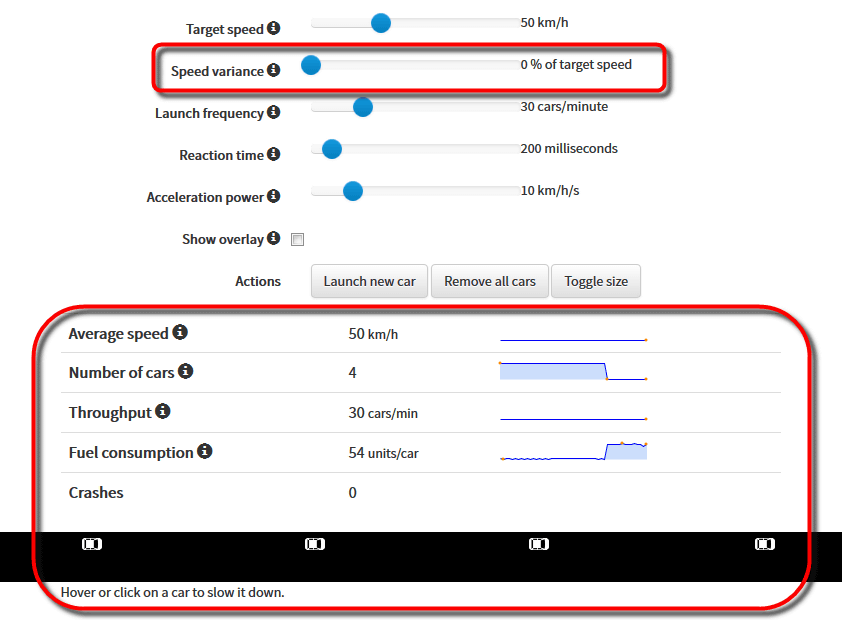
The fact that the variation in speed is zero means that all the vehicles simulated the state of running by automatic driving. In other words, from here, you can see that each car is running at the same speed and the probability of a traffic jam or accident decreases greatly. Actually, running at a constant speed seems to be the best way to get to the destination most efficiently although it is likely to skip the car as soon as you are in a hurry.
Related Posts:


in Vehicle, Web Application, Posted by darkhorse_log