A settlement report & various data showing the tremendous Facebook growth and earnings are released

SNS giant Facebook announced financial results for the fourth quarter of 2015 on January 27, 2016. I realized that we achieved record sales. In addition, it is clear that various kinds of data on users are also released at once, and Facebook is building a stone posture.
Facebook Reports Fourth Quarter and Full Year 2015 Results - Facebook
http://investor.fb.com/releasedetail.cfm?ReleaseID=952040
Facebook Q4 and Full Year 2015 Earnings
(Automatic sound reproduction)http://edge.media-server.com/m/p/r63ian8u
Facebook's revenue for the fourth quarter of 2015 was 5,841 million dollars (about 707 billion yen), up 51.7% compared to the same period last year, and net profit up 1,362 billion dollars (about 189 billion yen) up 123% That was a recordable account settlement.
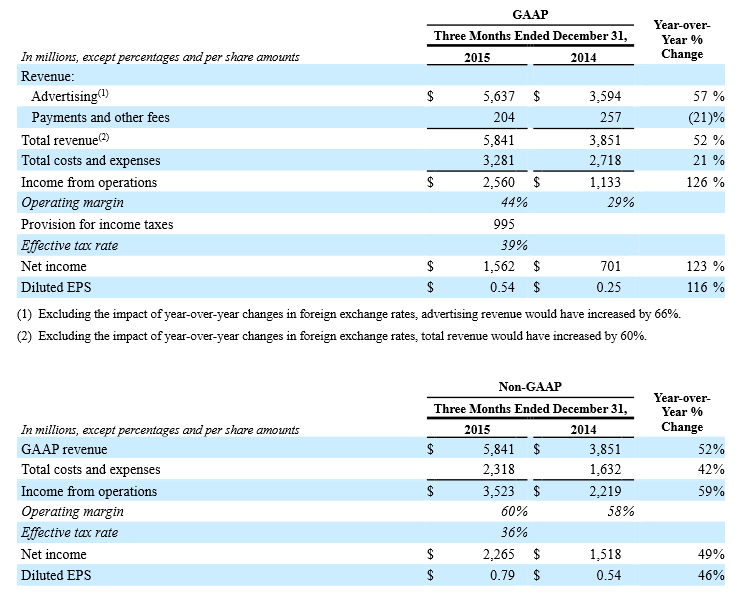
Revenue for the full year of 2015 was 17.928 billion dollars (about 2.1 trillion yen), up 43.8% from the previous year and net profit up by 38.3% over the previous year at 6.518 billion dollars (about 789 billion yen) It is getting strong.

Materials that make it easy to understand how the profit structure of Facebook is tremendous are published at once. The graph below shows the number of active users per day. The number of active users steadily increasing steadily year by year reached 1,038 million in the fourth quarter of 2015.
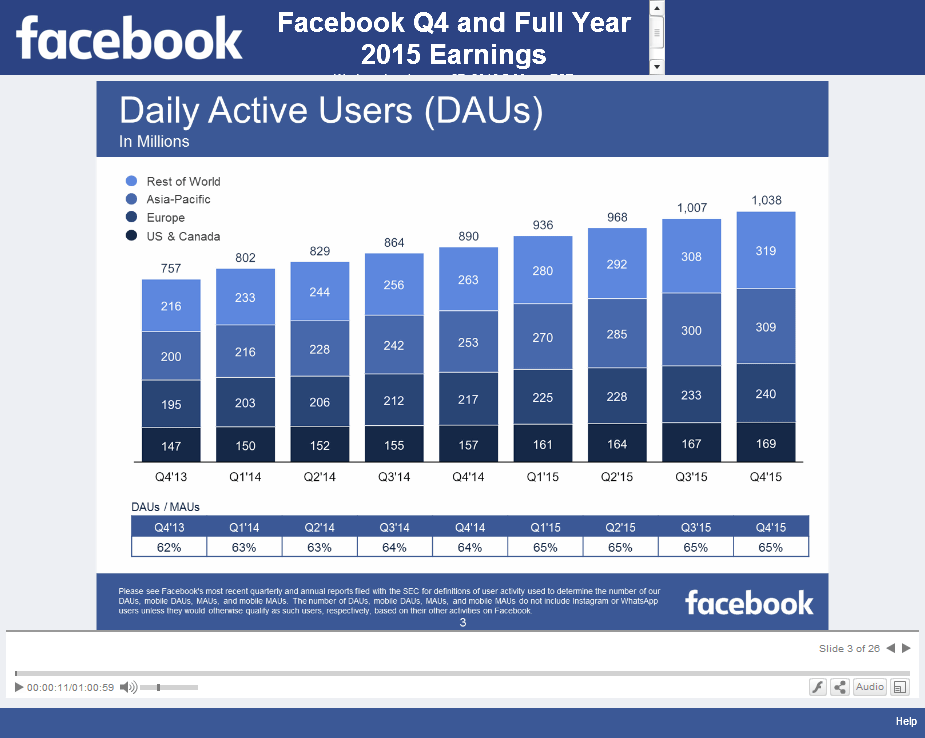
And about 934 million of them are mobile terminal users, mainly smartphones.
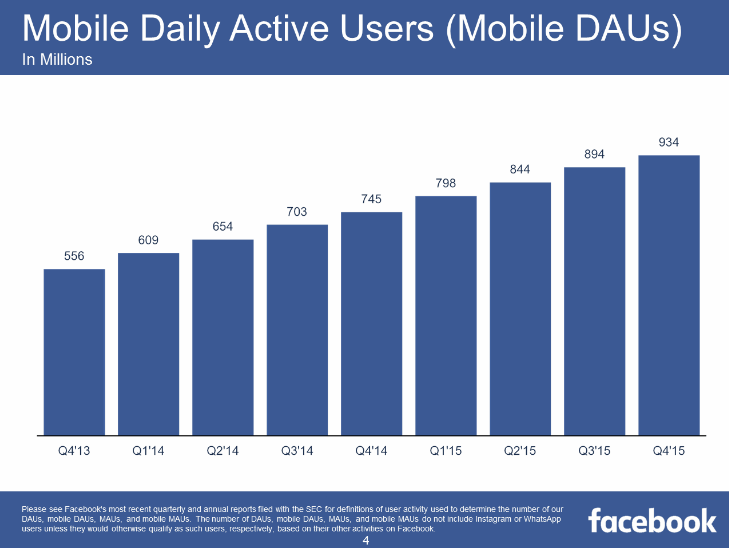
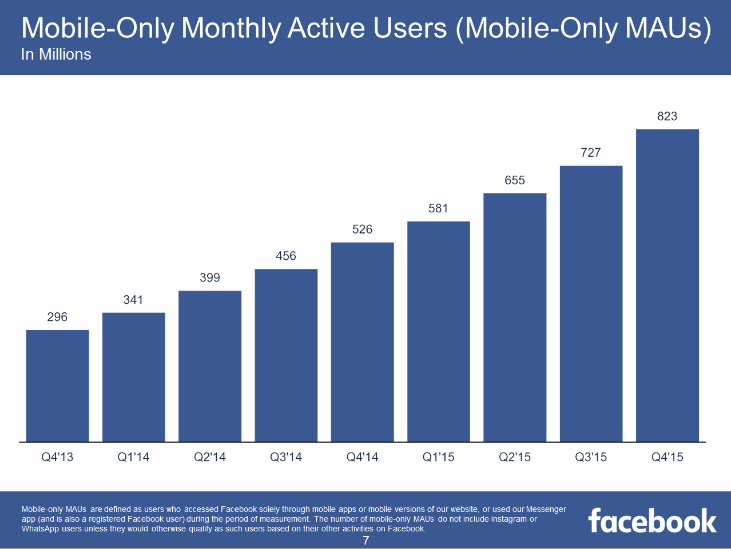
This is the number of active users per month using mobile terminals.
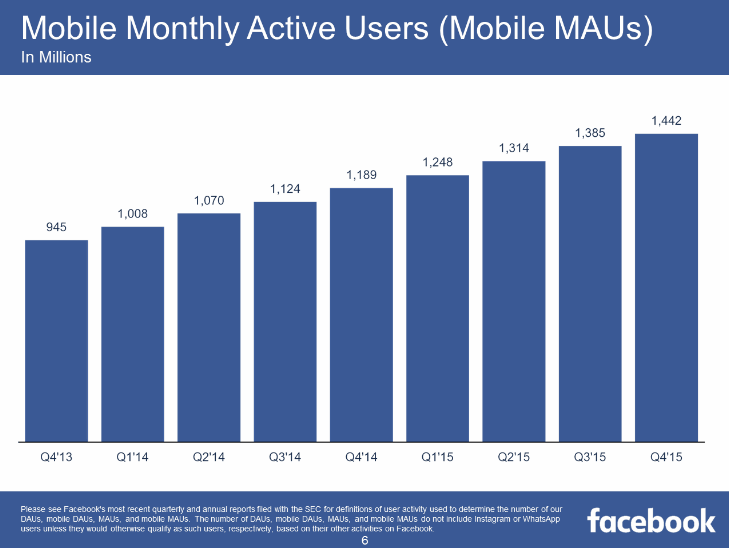
On the other hand, the number of monthly active users who use Facebook on mobile terminals alone is like this. In comparison with the previous graph, it turns out that 57% of users are using Facebook on mobile terminals only. This seems to indicate that Facebook is a service blended into everyday life.
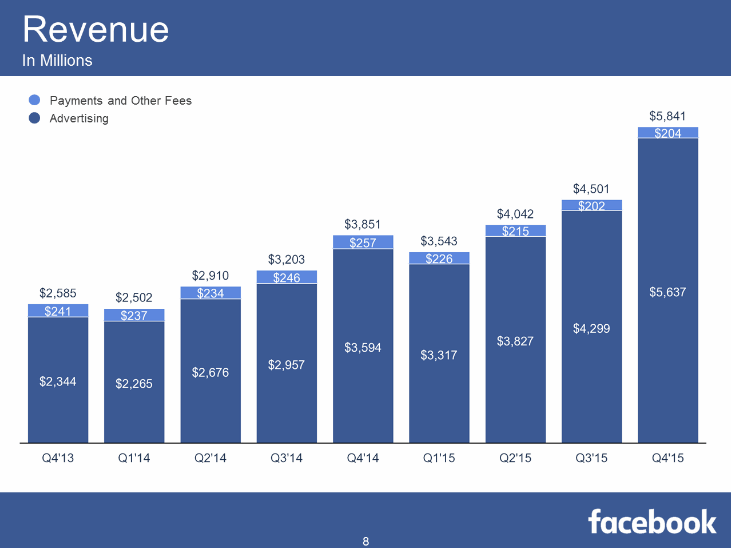
Quarterly sales trend. There is an increase / decrease, but steadily increase. In fact, advertising revenue is more than 90% revenue.
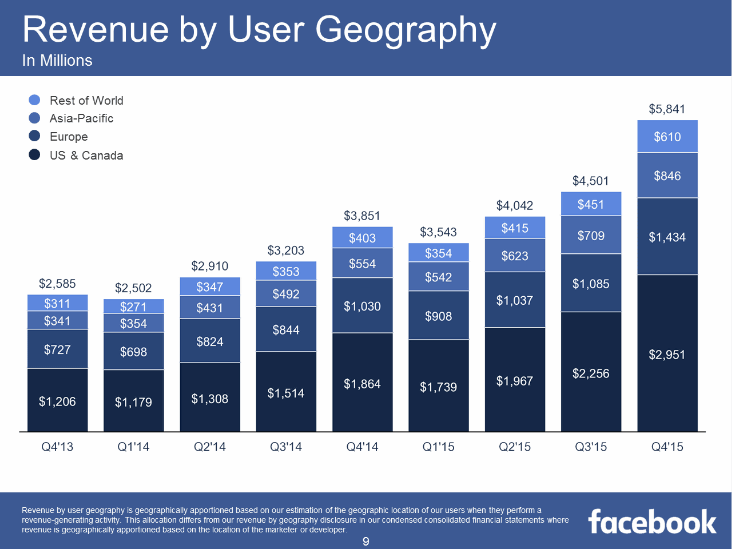
Breakdown of sales is North America, Europe, Asia and other regions in order. There seems to be a potential market in Asia.
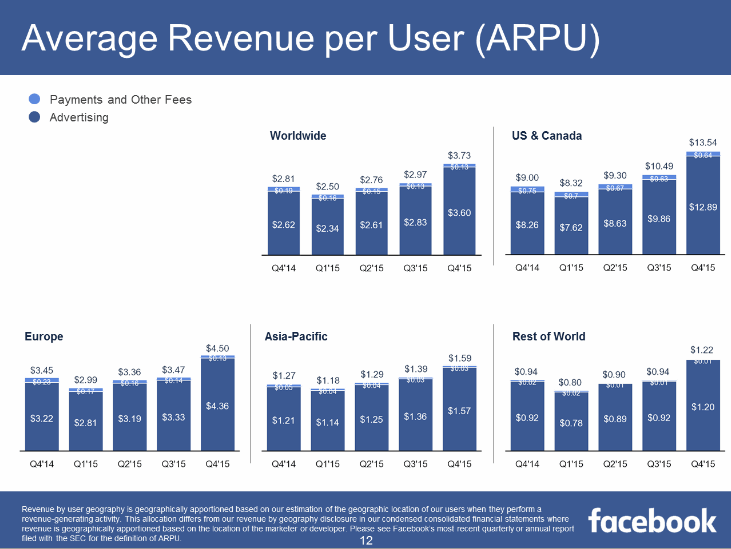
This is a graph showing revenue per user by region. Revenue per user is increasing in both regions.
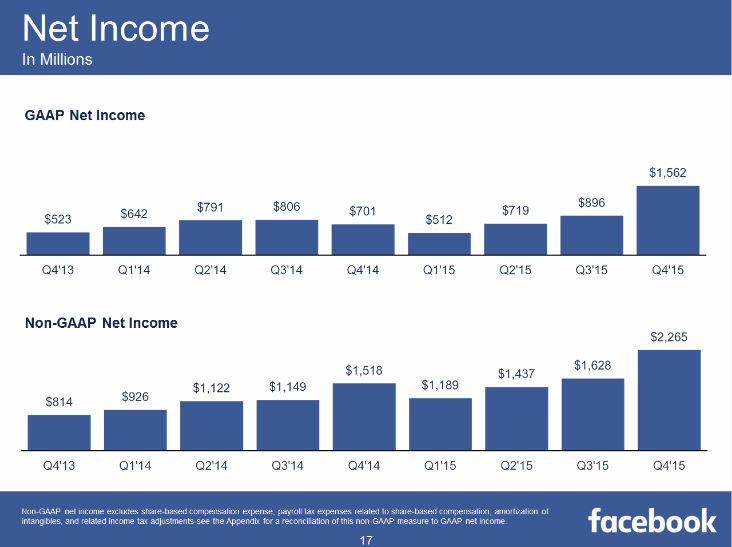
Graph of trends in net income per quarter. I understand that I keep steadily increasing profits.
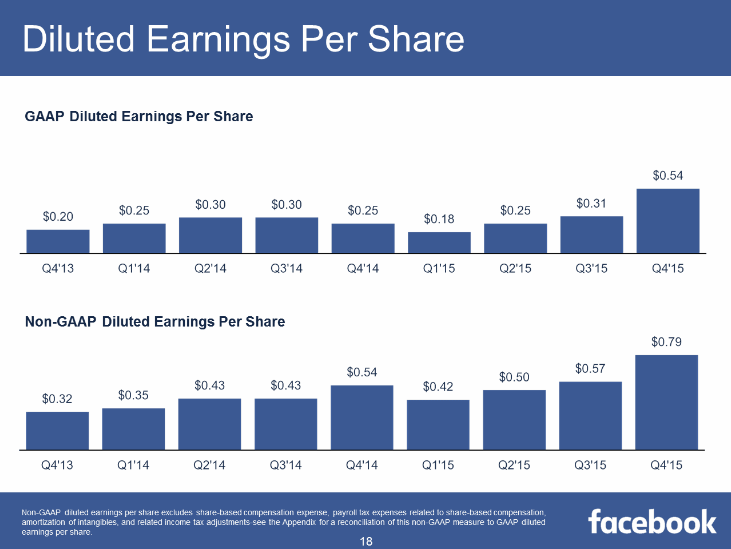
Earnings per share look like this.
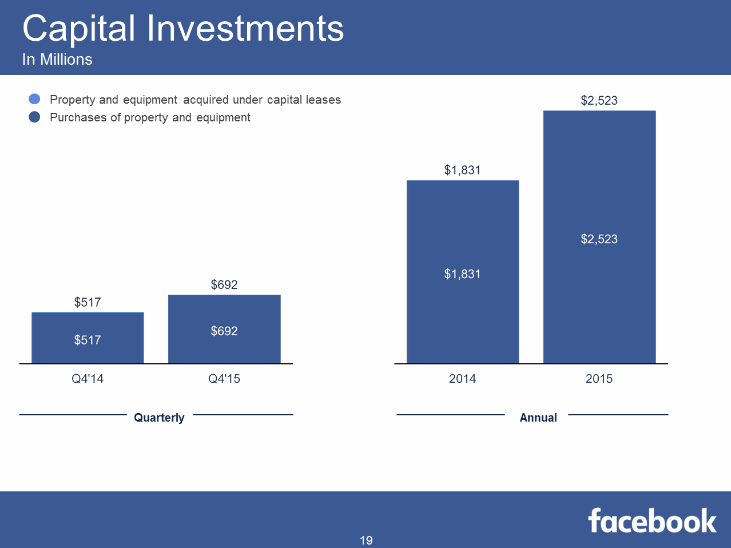
Facebook is actively investing $ 2,523 million (about 306 billion yen) in 2015.
The advertisement business unique to Facebook, which allows users to fully understand their taste and advertise pinpoints, is top notch. It is like this when you graph the advertisement revenue of Facebook that continues to grow on the right side. Jan Dawson, an analyst who saw this graph, evaluates it as "crazy" (abnormal).
Crazy to see Facebook's ad revenue growth continue to acceleratePic.twitter.com/yFk3u7CThU
- Jan Dawson (@ jandawson)2016, January 27
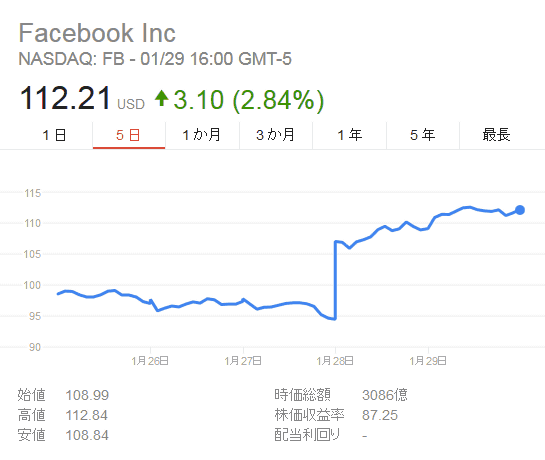
The share price of Facebook, which makes analysts crazy to say, soaring after the announcement of the fourth quarter 2015 accounts has surged.
·bonus
Following the strong Facebook stock price, Mark Zuckerburg emerged as the world's sixth-largest rich. Total assets amounted to 46.25 billion dollars (about 5.5 trillion yen) as of January 28, 2016.
Mark Zuckerberg Becomes World's Sixth Richest Person As Facebook Shares Soar - Forbes
http://www.forbes.com/sites/katevinton/2016/01/27/mark-zuckerberg-becomes-worlds-sixth-richest-person-as-facebook-shares-soar/
Related Posts:


in Note, Web Service, Posted by darkhorse_log