A time-thief book "Adams' Synchronological Chart" summarizing the 6000 year world history of free public release into one piece
The first edition was published in 1871 "Adams' Synchronological Chart"This is a book that connects 21 panels will be a huge timeline of seven meters. In the timeline of 7 meters, the history from the 4000 BC to the end of the 19 th century, which is said to be the beginning of the primitive world history, is summarized at once, but the whole picture has been released on the Internet It is free, and anyone can browse it.
Composite: Adams' Synchronological Chart. - David Rumsey Historical Map Collection
http://www.davidrumsey.com/luna/servlet/detail/RUMSEY~8~1~226099~5505934:Composite--Adams--Synchronological-
When opening the above URL, one long piece of book is displayed next to the middle of the page, which becomes Adams' Synchronological Chart.
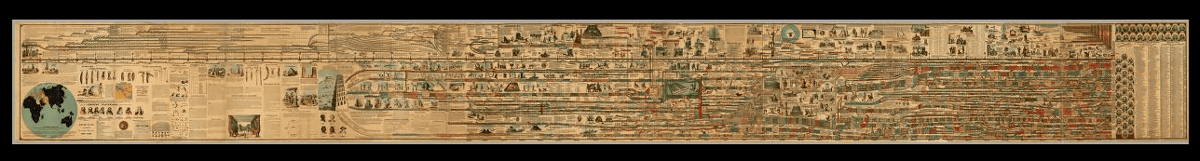
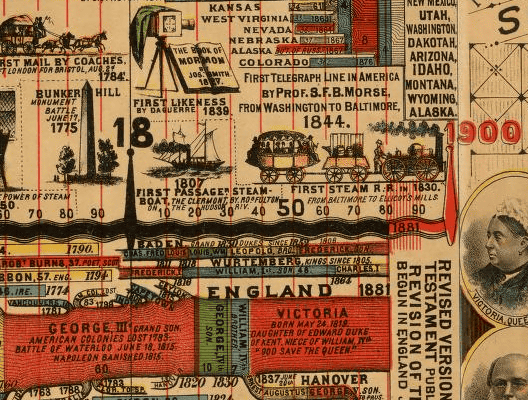
When zooming, you can see that the illustration of the event at the top with an illustration was shown and the timeline of the major nation whose color was divided at the bottom is displayed.
By zooming to the limit it is possible to read clearly up to one letter.

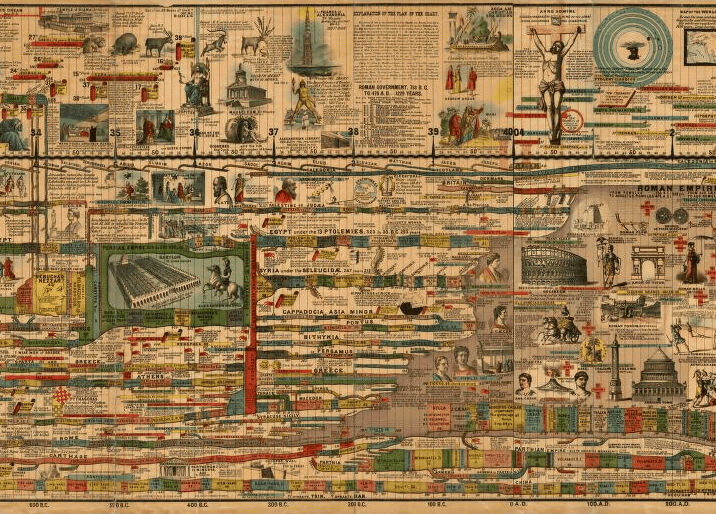
This is the timeline from around the year CE. Zoom with google and ... ...
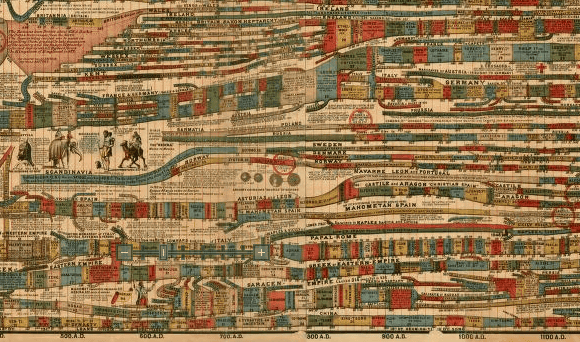
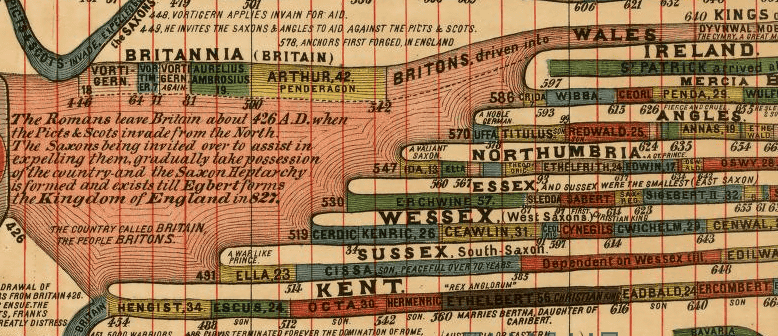
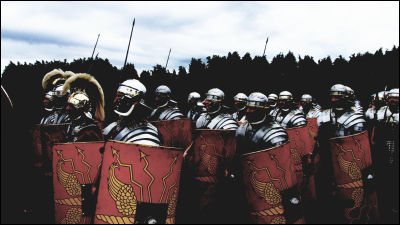
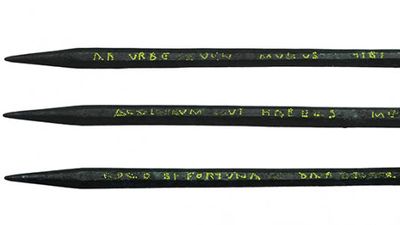
Try looking at the British timeline around the 5th century. The Romans who dominated the British lived in the Scottish provincePict peopleIt was attacked and withdrew from the United Kingdom in 426. Then the Pict people are absorbed by Anglo-Saxon, and the timeline shows that various small countries such as Kent, Wales, Sussex and Essex are born.
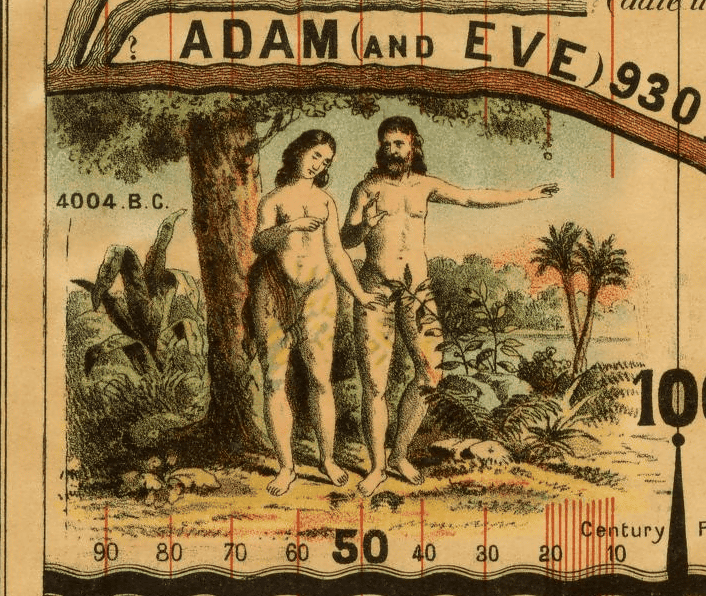
This is an illustration around 4004 BC. Based on the description of the Bible, I calculated the time until creation of heaven and earthUsher's chronicleAccording to, it is concluded that the creation of heaven and earth was done in 4004 BC. IllustrationAdam and EveIt is drawn that the nets stand out under the tree.
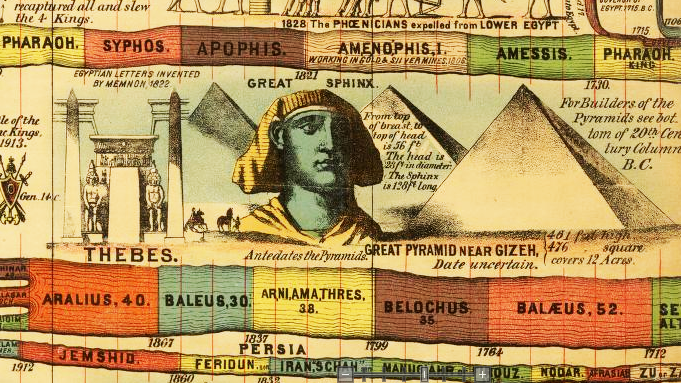
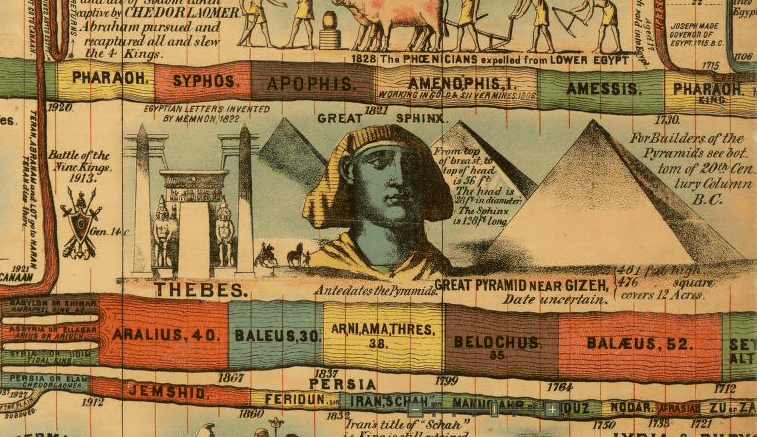
Zooming up the timeline from 1900 BC to 1700 BC, Giza's Great Sphinx and Pyramid were drawn. Next to the Great Sphinx of Giza, "Height from the top to the chest is 56 ft (about 17 m), the total length is described as 128 ft (about 40 m)",Total height and total length published as of 2015It is also interesting that it is different from the number.
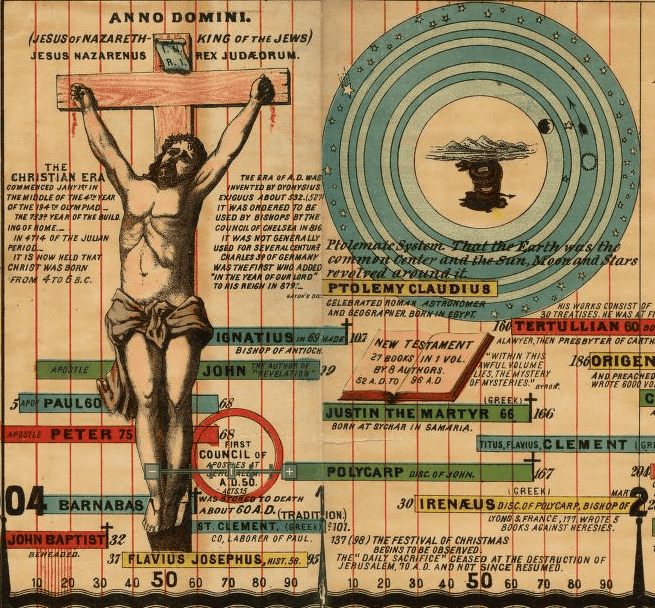
I saw the part from the AD 0 to 200 years. Illustrations depicting Jesus Christ being crucified on the cross are drawn, so even if you do not understand English you can understand what happened from the illustration.
This is the last timeline of the 19th century. In the illustration the locomotive depicting ship and smoke is drawn, and the timeline of England is "VICTORIA (Victorian)" so "Ah,Industrial RevolutionI can understand that it happened.
The timeline ends in the 19th century, but there are other historical events that occurred in the United States in time series ......
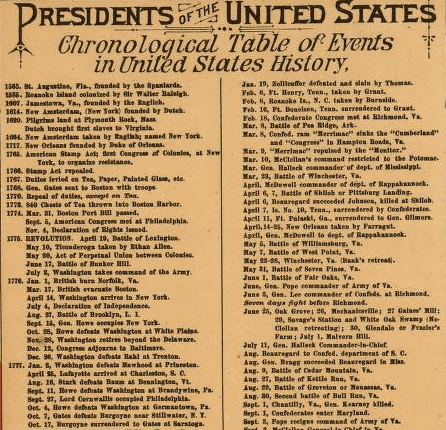
I do not get tired of having all the American presidents with a portrait or even watching it all the while. By the way, from the leftJames BuchananThe 15th president,Abraham LincolnThe 16th president,Andrew JohnsonIt is the 17th president.

The Adams' Synchronological Chart published on the Internet takes a tremendous amount of time from the beginning to the end. When you are looking at little spare time, time may have passed without knowing, so it seems to be good to watch and watch your time.
Related Posts:


in Web Service, Posted by darkhorse_log