"Big data visualization system" which visualizes multiple big data together like cyber punk collectively

big dataAlthough it is said that use of the word is called nowadays, if you have a huge amount of data, it is something you do not understand at all what you can see from where and where. In such a case it seems to be useful "Big data visualization system"We instantly visualize big data instantly so that we can interact with various data more intuitively.
Exhibit item 29 Equipment active at the broadcasting site | NHK Institute of Technology Grant Public 2014 - Kokoro Movement Technology -
http://www.nhk.or.jp/strl/open2014/tenji/tenji29_2/index.html

Arrived at the "Big Data Visualization System" exhibition booth.

Here we saw a demonstration using a big data visualization system to instantly visualize tens of millions of big data.

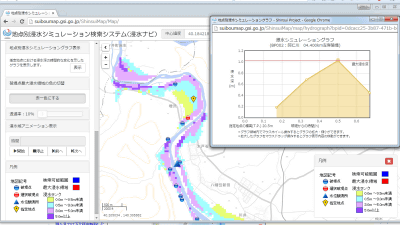
this isNational Land Numeral InformationThe water depth rank at the time of inundation was displayed on the Japanese map based on.

Kanto region

From Tohoku to Kinki district

Japan map, which displays data such as, etc., can be smoothly scaled up and down.

When displaying big data, the initial rendering takes some time but operation is very smooth. And even if the map is enlarged considerably, detailed data is displayed depending on the district.

It will look like this when overlaying the evacuation facility data at the time of disaster to this flooding data. If you look at this, you can see where shelter is really evacuated at the time of flood damage.

Furthermore, since the big data visualization system can overlay multiple data at the same time, you can try to display data that seemingly does not seem to be related to the data like accommodation capacity at the same time.

Since data can be clearly seen even if it expands to the municipal level, it is possible, of course, to check whether there is a sufficient amount of accommodation capacity in the area with a high inundation rank.

It is possible to display the flight status of the domestic flight in real time, but this has become a map where the airplane is jumping over the country and what is going on is not understood at all.

This big data visualization system is able to operate also on mobile PC, so in the future it seems possible to visually confirm a huge amount of data from the destination.

The "big data visualization system"NHK Giken Open 2014It is open to the public at.
Related Posts:


